Data Analysis Assignment: Cancer Case Analysis and Interpretation
VerifiedAdded on 2022/09/24
|4
|519
|25
Homework Assignment
AI Summary
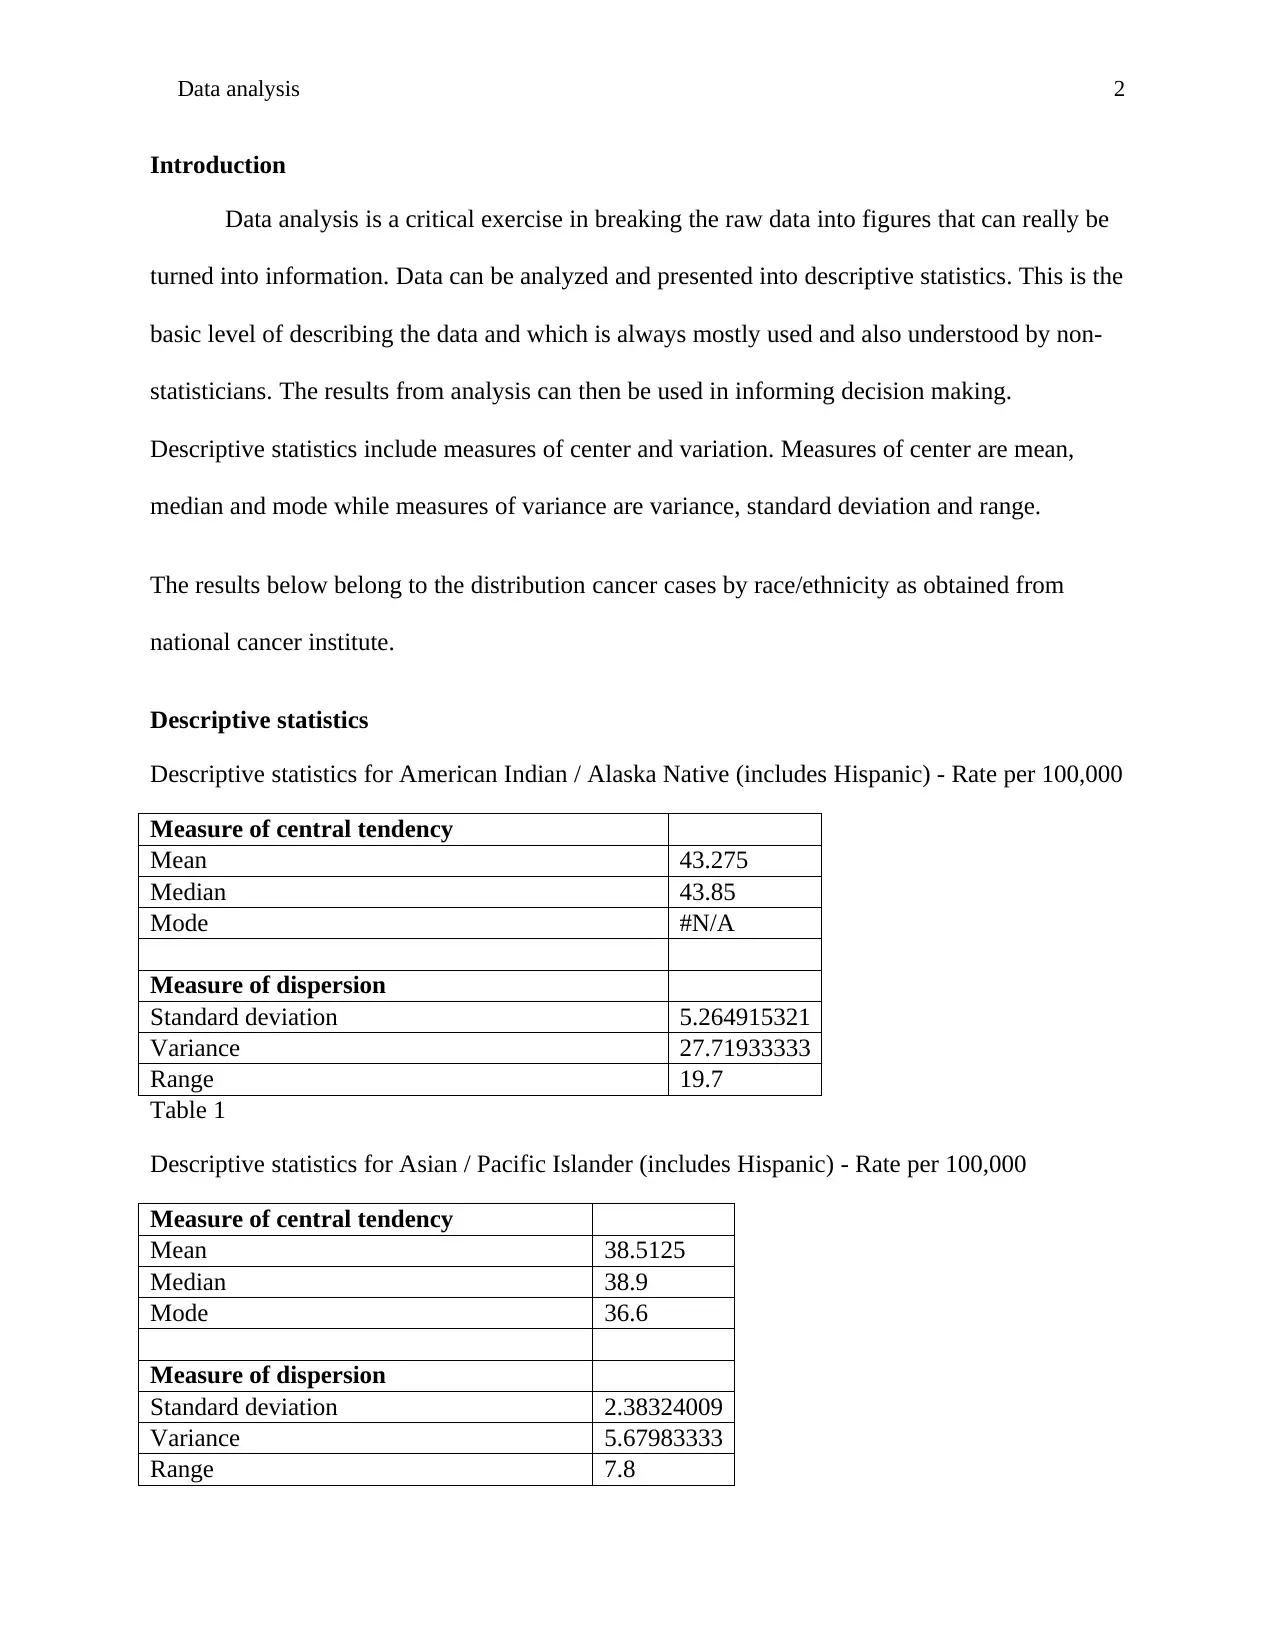
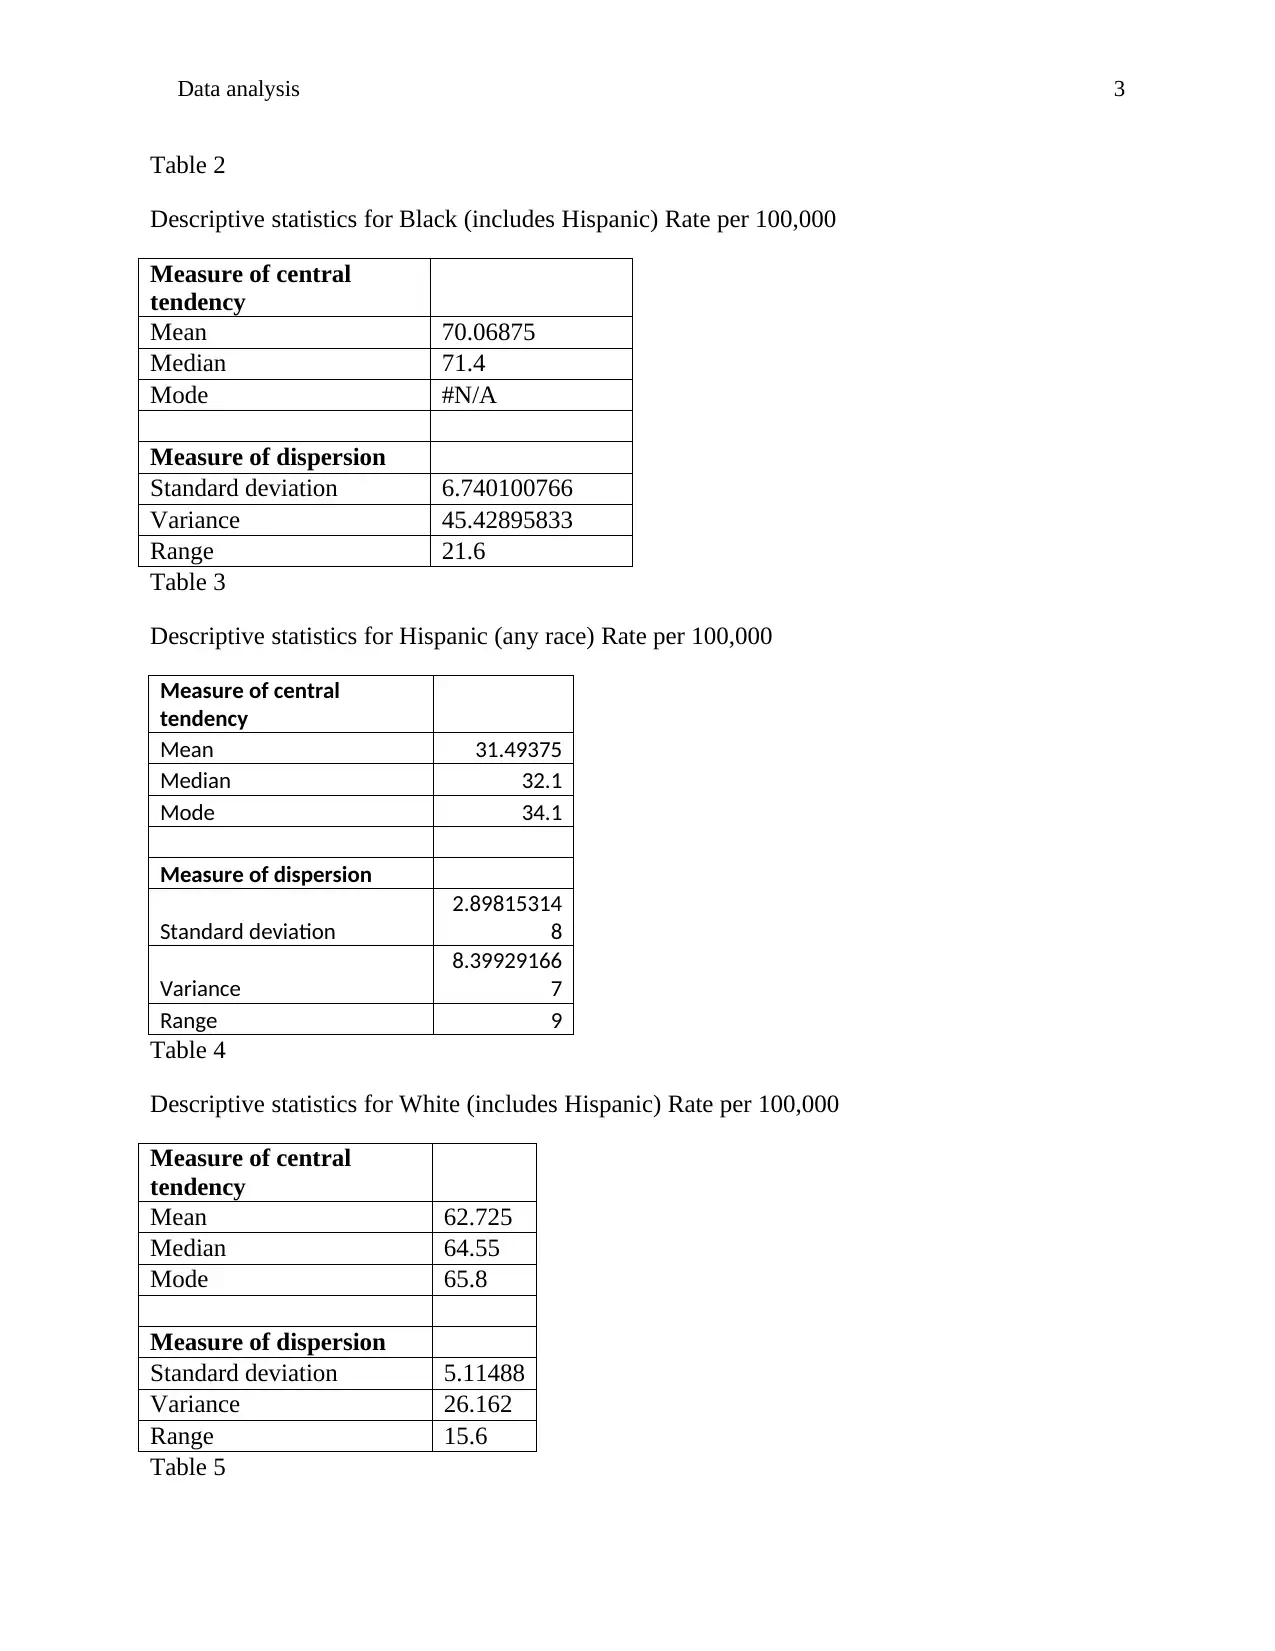
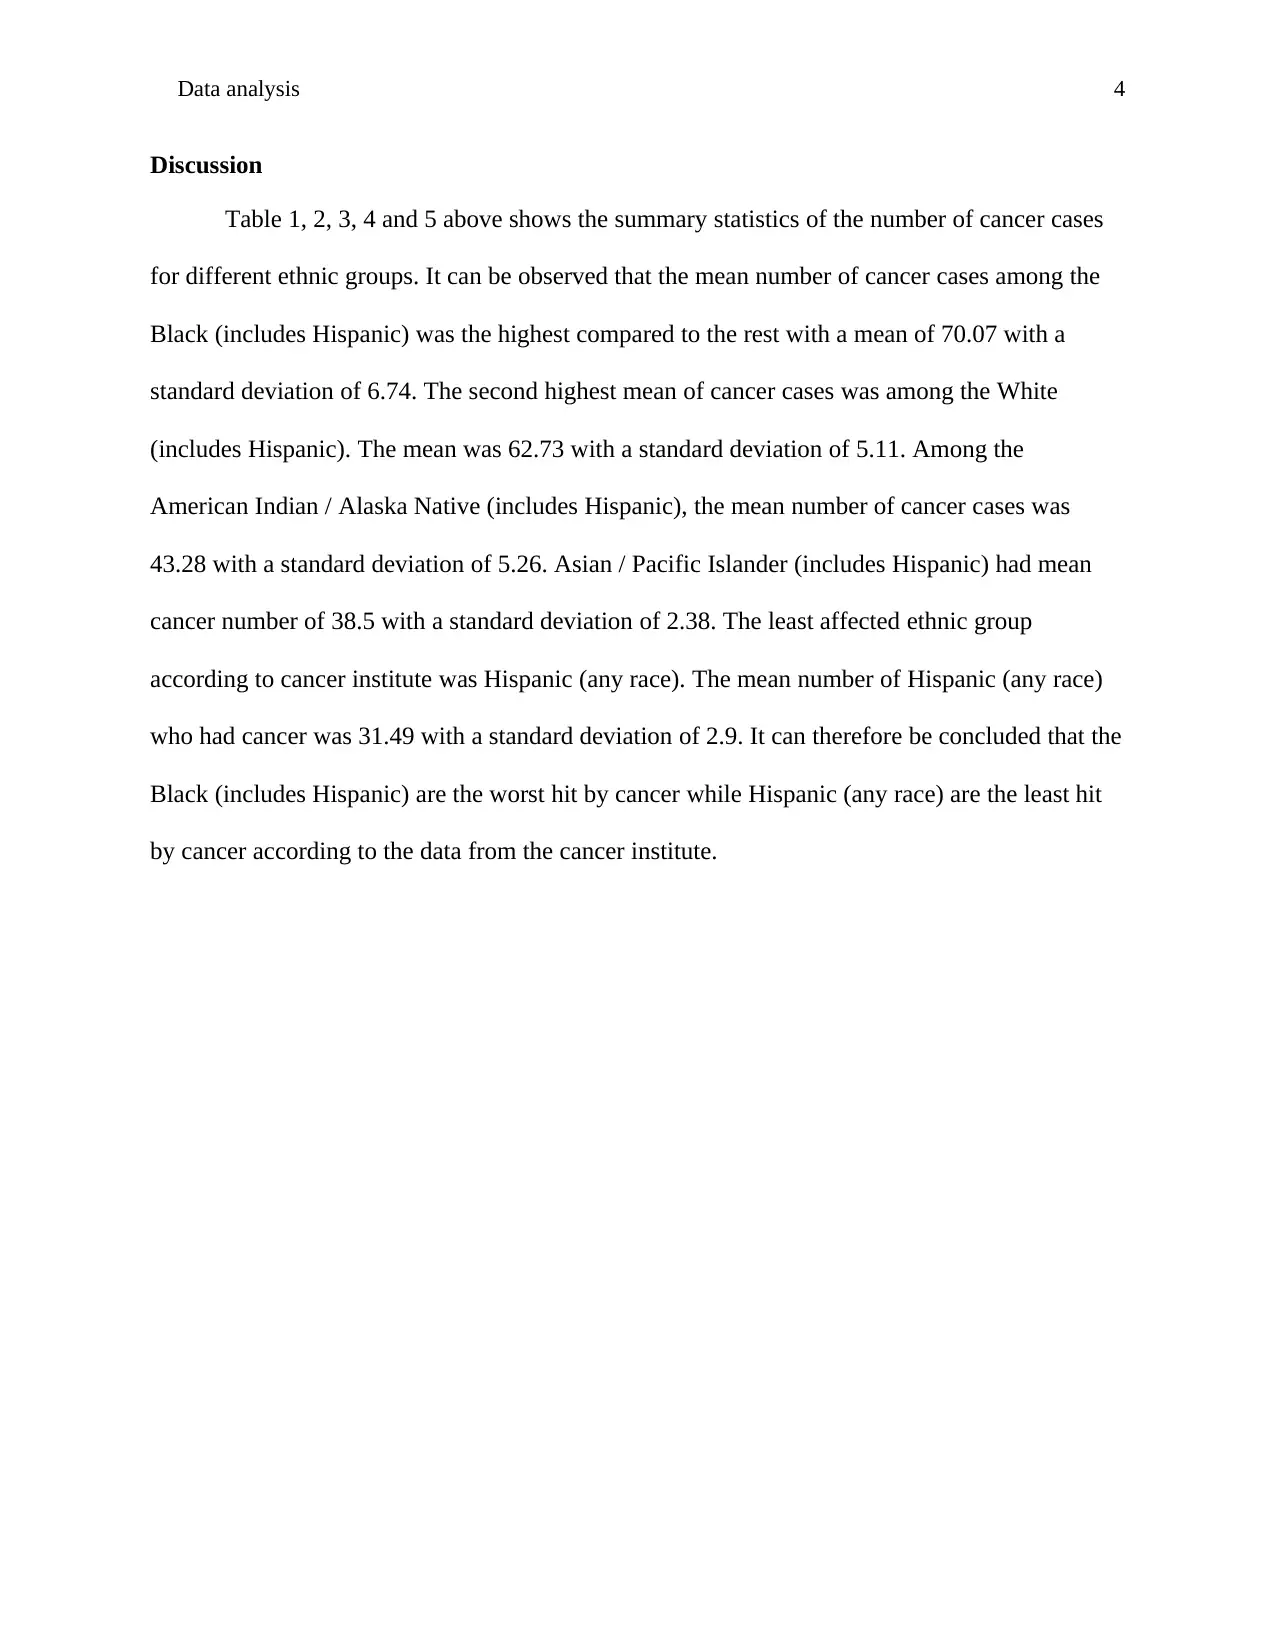
This assignment presents a data analysis of cancer cases across different ethnic groups, utilizing descriptive statistics to interpret the data. The analysis includes data from the National Cancer Institute, providing a breakdown of cancer rates per 100,000 for various ethnic categories: American Indian/Alaska Native, Asian/Pacific Islander, Black, Hispanic, and White. The assignment calculates and presents key descriptive statistics such as mean, median, mode, standard deviation, variance, and range for each group. The discussion section highlights the differences in cancer incidence among the groups, concluding that the Black (includes Hispanic) population has the highest mean number of cancer cases, while the Hispanic (any race) population has the lowest, based on the data provided. This analysis offers insights into cancer prevalence across different ethnic demographics, using statistical measures to draw comparisons and conclusions.

1 out of 4
Related Documents


Your All-in-One AI-Powered Toolkit for Academic Success.
+13062052269
info@desklib.com
Available 24*7 on WhatsApp / Email
![[object Object]](/_next/static/media/star-bottom.7253800d.svg)
Copyright © 2020–2026 A2Z Services. All Rights Reserved. Developed and managed by ZUCOL.