Numeracy and Data Analysis Report: Central Tendency & Forecasting
VerifiedAdded on 2023/06/13
|9
|1365
|497
Report
AI Summary
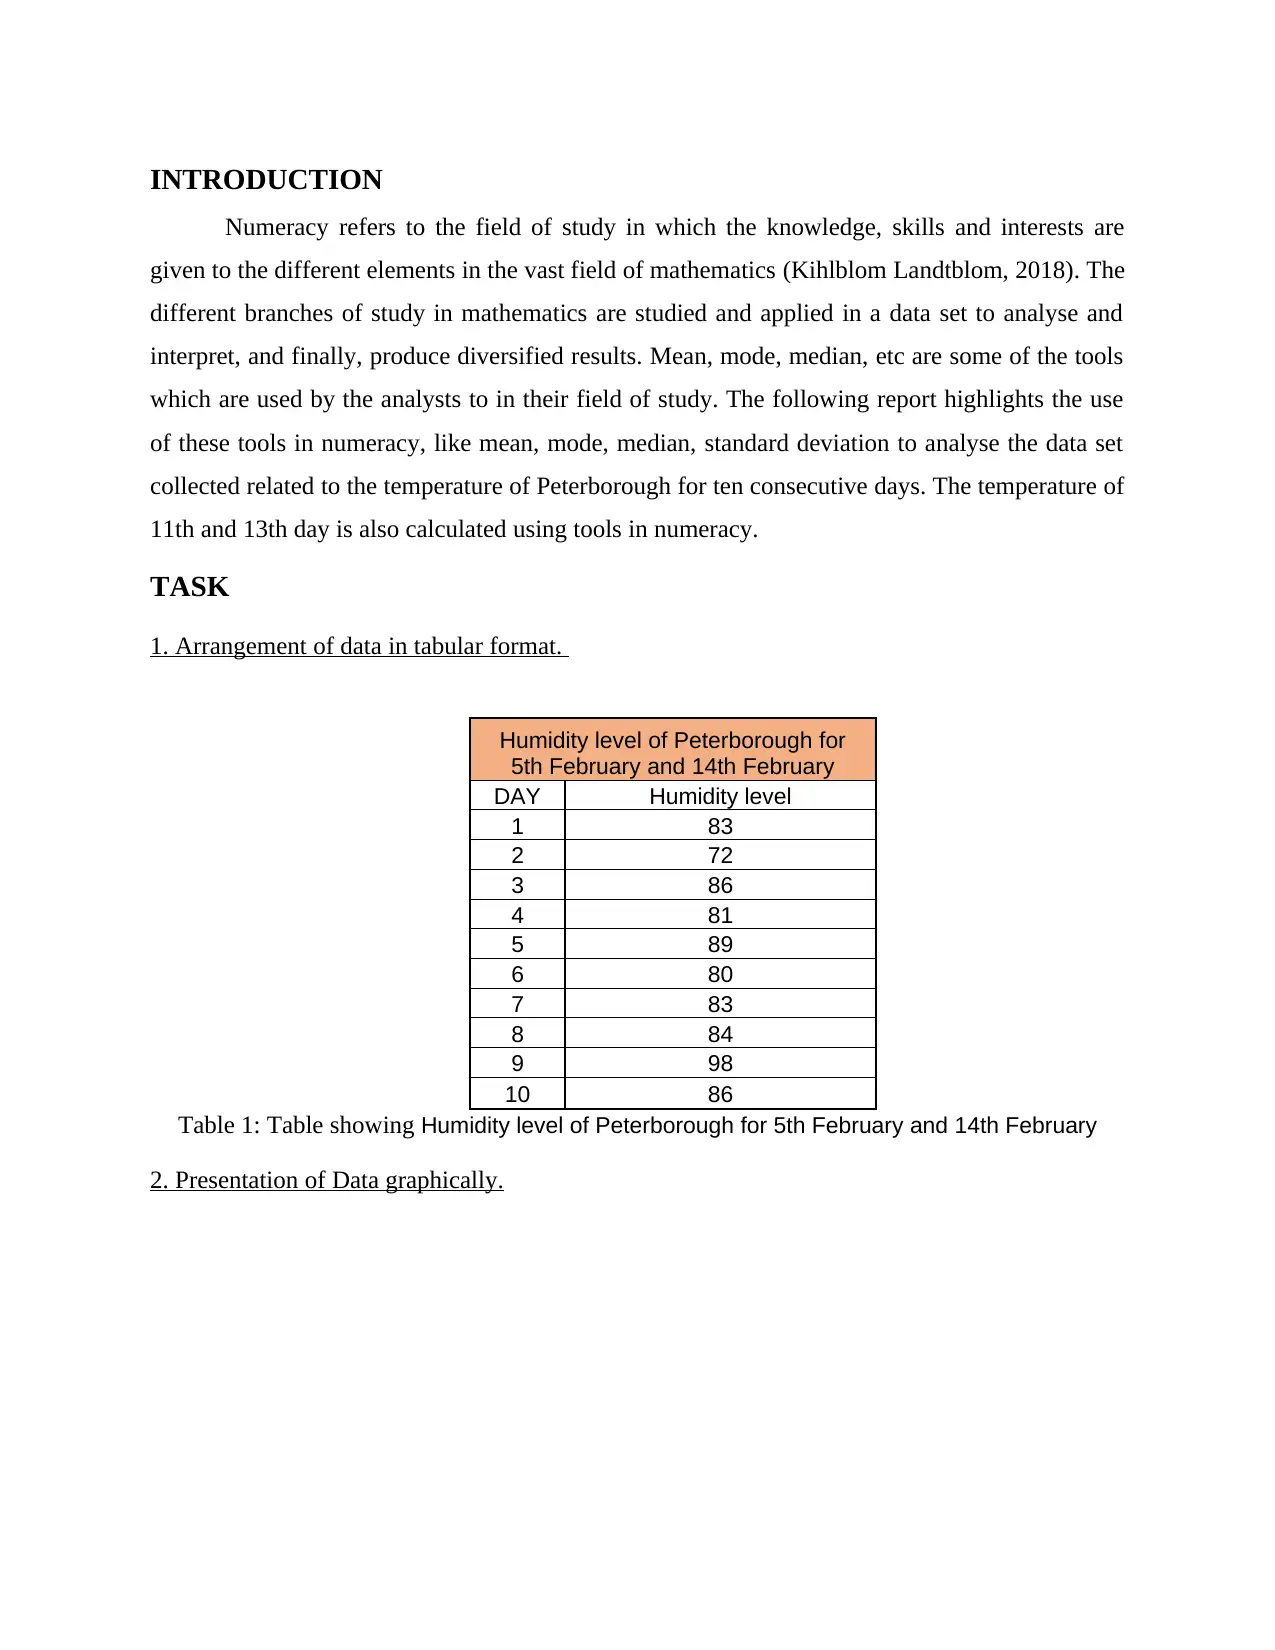
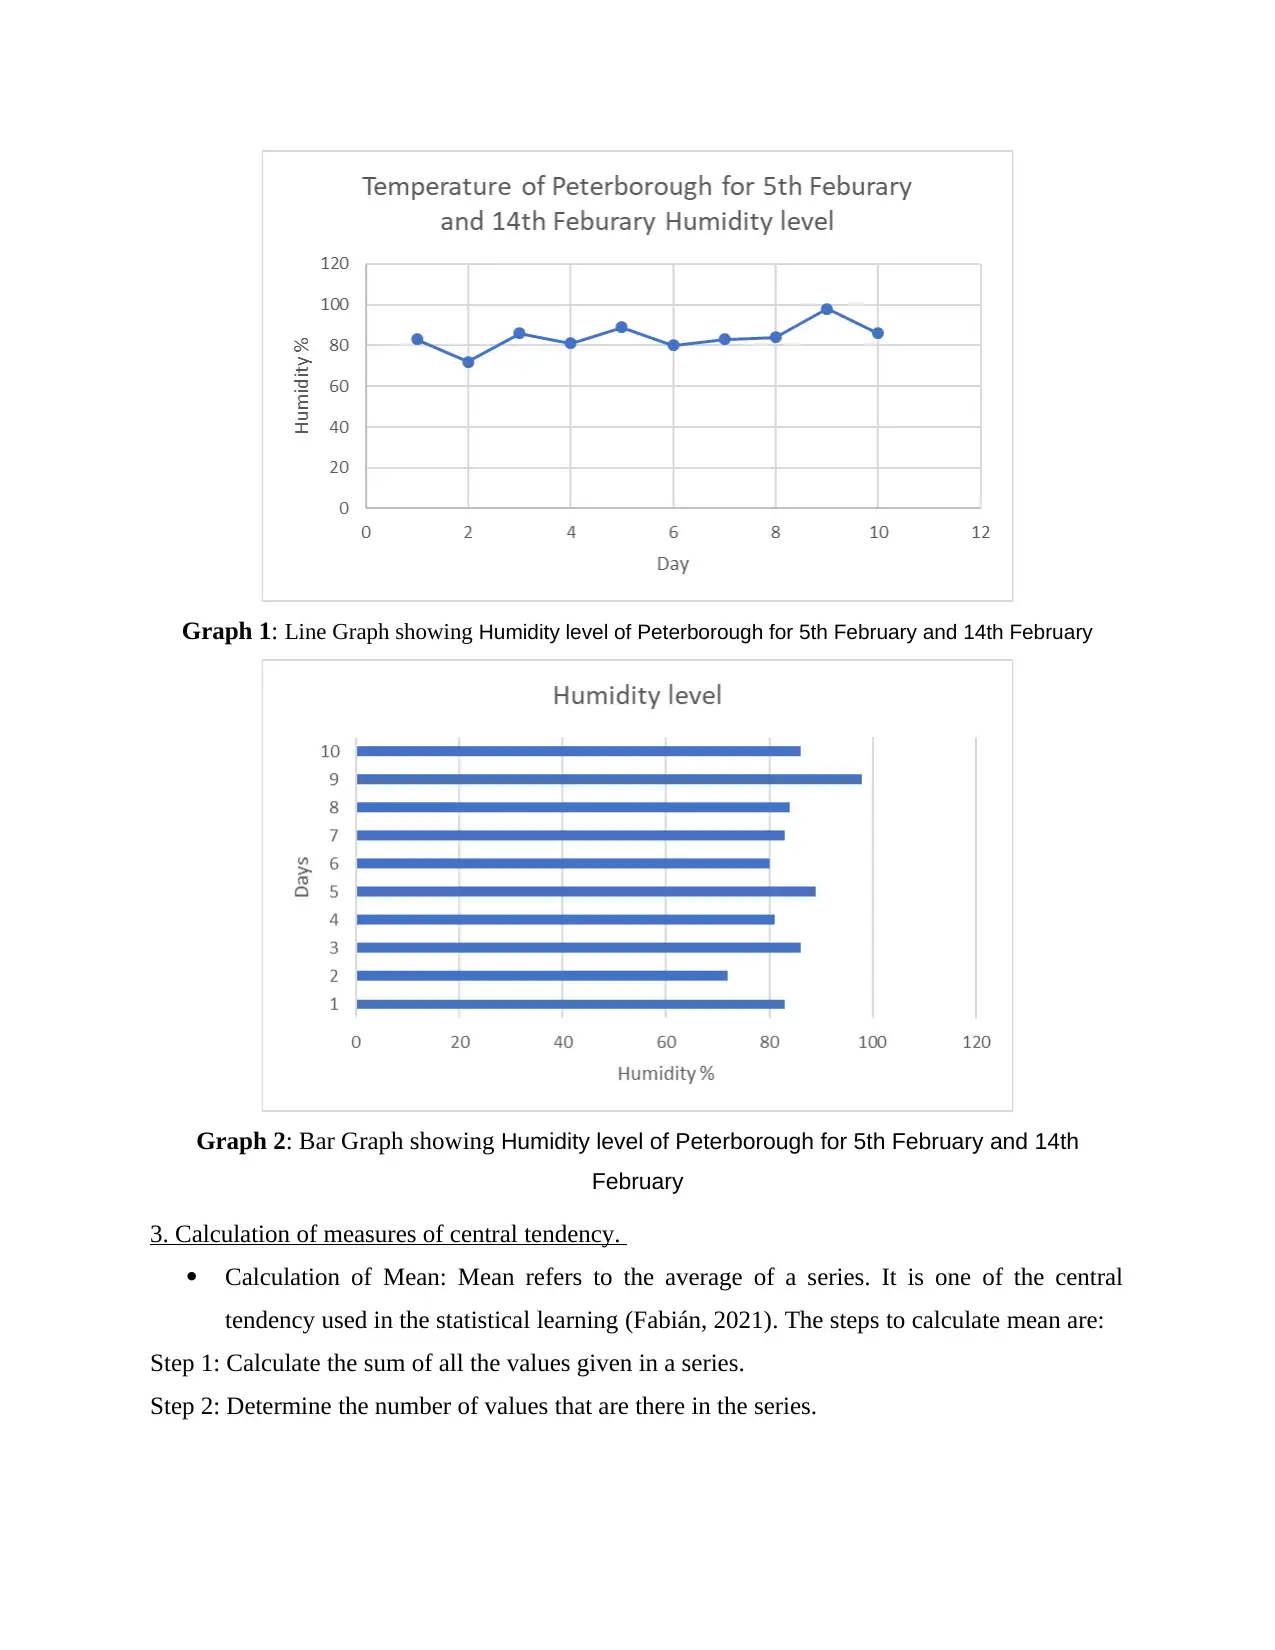
This report delves into numeracy and data analysis, focusing on the application of central tendency measures such as mean, median, mode, range, and standard deviation to a dataset representing the humidity levels of Peterborough over ten consecutive days. It details the arrangement of data in tabular and graphical formats, including line and bar graphs, and provides step-by-step calculations for each measure of central tendency. Furthermore, the report employs a linear forecasting model to predict the humidity levels for the 11th and 13th days, showcasing the practical application of these statistical tools in forecasting. The conclusion emphasizes the importance of these analytical methods in various fields, including business, for interpreting data and predicting future trends. Desklib offers this and many other solved assignments and past papers for students.

Numeracy and Data
Analysis
Analysis
Paraphrase This Document
Need a fresh take? Get an instant paraphrase of this document with our AI Paraphraser

Table of Contents
INTRODUCTION ..........................................................................................................................3
TASK...............................................................................................................................................3
1. Arrangement of data in tabular format. .............................................................................3
2. Presentation of Data graphically........................................................................................3
3. Calculation of measures of central tendency. ....................................................................4
4. Usage of Linear Forecasting Model and calculation of temperature of 11th and 13th day. . .6
CONCLUSION ...............................................................................................................................8
REFERENCES................................................................................................................................9

INTRODUCTION
Numeracy refers to the field of study in which the knowledge, skills and interests are
given to the different elements in the vast field of mathematics (Kihlblom Landtblom, 2018). The
different branches of study in mathematics are studied and applied in a data set to analyse and
interpret, and finally, produce diversified results. Mean, mode, median, etc are some of the tools
which are used by the analysts to in their field of study. The following report highlights the use
of these tools in numeracy, like mean, mode, median, standard deviation to analyse the data set
collected related to the temperature of Peterborough for ten consecutive days. The temperature of
11th and 13th day is also calculated using tools in numeracy.
TASK
1. Arrangement of data in tabular format.
Humidity level of Peterborough for
5th February and 14th February
DAY Humidity level
1 83
2 72
3 86
4 81
5 89
6 80
7 83
8 84
9 98
10 86
Table 1: Table showing Humidity level of Peterborough for 5th February and 14th February
2. Presentation of Data graphically.
⊘ This is a preview!⊘
Do you want full access?
Subscribe today to unlock all pages.

Trusted by 1+ million students worldwide

Graph 1: Line Graph showing Humidity level of Peterborough for 5th February and 14th February
Graph 2: Bar Graph showing Humidity level of Peterborough for 5th February and 14th
February
3. Calculation of measures of central tendency.
Calculation of Mean: Mean refers to the average of a series. It is one of the central
tendency used in the statistical learning (Fabián, 2021). The steps to calculate mean are:
Step 1: Calculate the sum of all the values given in a series.
Step 2: Determine the number of values that are there in the series.
Paraphrase This Document
Need a fresh take? Get an instant paraphrase of this document with our AI Paraphraser

Step 3: Using the formula given below, divide the value calculated in Step 1 with value
calculated in Step 2.
Mean = Sum of observations / Number of observations
= 842 / 10
= 84.2
Calculation of Median: It refers to the value which is coming in th exact between the
series. It also refers to the mid value of any series. The formula of median is determined
on the basis of the series, that they have odd number of observations or even. Following
are the steps which can be used in to calculate median:
Step 1: Sort the observations in ascending order.
Step 2: If the number of observation is in even number then the middle value will be the median.
Step 3: If the number of observation is odd, then the following formula will be used to calculate
the median.
72 , 80 , 81 , 83 , 83 , 84 , 86 , 86 , 89 , 98
Median = 5th term + 6th term / 2
= 83 + 84 / 2
= 167 / 2
= 83.5
Calculation of Mode: Mode refers to that value in the series which is occuring at the
most. In the series, if there is single mode it is known as Bimodal whereas if there are two
or more than two modes it is called multimodal (Khan, and et.al., 2019).
Step -1: Firstly, observe the given humidity level of ten days.
Step -2: In the given series, there is single value which is occuring two times.
Step -3: Therfore, it can be analysed that 86 is the most repeated value.
Series- 83 , 72 , 86 , 81 , 89 , 80 , 83 , 84 , 98 , 86
The mode for the above series is 86 which is bi-modal.
Calculation of Range: It is a measure of dispersion which helps to find the extreme values
in the given range. It can be calculated by taking the difference of highest and lowest
values from the given numbers.
Steps for computing range can be described as given below -
Step-1: Arrange the series in ascending to descending order.

Step -2: Inspect the humidity level of Peterborough.
Step -3: In the given data of ten days the highest value is 98 and lowest is 72.
Step-4: Deduct lowest value from the highest value.
Series- 83 , 72 , 86 , 81 , 89 , 80 , 83 , 84 , 98 , 86
Range= Highest value- lowest value
= 98 – 72
= 26
Calculation of Standard Deviation:
Standard deviation – It is another measure of dispersion which calculate the dispersion of
calculated value from the actual mean (Rakshit, and Das, 2018).
The Step by step procedure to calculate Standard devaition are as given below-
Step -1: Sum the values of humidity level
Step-2: Find the square of difference of mean and x values.
Step -3: divide the step 3 by number of observations.
SD = √ (xi – μ) 2 / N
= 611.2 / 10
= 61.12
4. Usage of Linear Forecasting Model and calculation of temperature of 11th and 13th day.
I. Calculation of ‘m’ value with steps
x = Total of days
y =Humidity level
N = Number of observations
= (10* 4729 – 55 * 842) / (10 * 385 – 385)
= 47,290 - 46,310 / 3,850 – 385
⊘ This is a preview!⊘
Do you want full access?
Subscribe today to unlock all pages.

Trusted by 1+ million students worldwide

= 980 / 3,465
= 0.28
II. Determining ‘c’ value and its steps
= 842 - (0.28) 55 / 10
= 842 - 15.4 / 10
= 826.6 / 10
= 82.66
III. Finding day 11 and day 13 humidity level by using formula
Day 11:
y = mx + c
= 0.28 * 11 + 82.66
= 3.08 + 82.66
= 85.74
Humidity for the 11th Day will be 85.75
Day 13:
y = mx + c
= 0.28 * 13 + 82.66
= 3.64 + 82.66
= 86.3
Humidity for the 13th Day will be 86.3
CONCLUSION
From the above report, it can be concluded that using the measures of central tendency and
dispersion helps to interpret the several situations in the business and various other instutions.
Paraphrase This Document
Need a fresh take? Get an instant paraphrase of this document with our AI Paraphraser

The application of linear forecasting models assists in knowing the future performance and other
predictive factors.
predictive factors.

REFERENCES
Books and Journals
Kihlblom Landtblom, K., 2018. Prospective Teachers’ Conceptions of the Concepts Mean,
Median and Mode: Selected Papers from the 22nd MAVI Conference.
Fabián, Z., 2021. Mean, mode or median? The score mean. Communications in Statistics-Theory
and Methods, 50(10), pp.2360-2370.
Khan, M.Y.A., and et.al., 2019. Artificial neural network simulation for prediction of suspended
sediment concentration in the River Ramganga, Ganges Basin, India. International
journal of sediment research, 34(2), pp.95-107.
Rakshit, M. and Das, S., 2018. An efficient ECG denoising methodology using empirical mode
decomposition and adaptive switching mean filter. Biomedical signal processing and
control, 40, pp.140-148.
Gouskir, M., Zyad, M.A. and Boutalline, M., 2020, April. Automatic Analysis of Brain Tumor
from Magnetic Resonance Images based on Geometric Median Shift. In 2020 IEEE 6th
International Conference on Optimization and Applications (ICOA) (pp. 1-7). IEEE.
⊘ This is a preview!⊘
Do you want full access?
Subscribe today to unlock all pages.

Trusted by 1+ million students worldwide
1 out of 9