Comprehensive Data Analysis and Forecasting of Chartham Station Usage

Verified

Added on  2020/11/12

|10
|1424
|347
Report
AI Summary
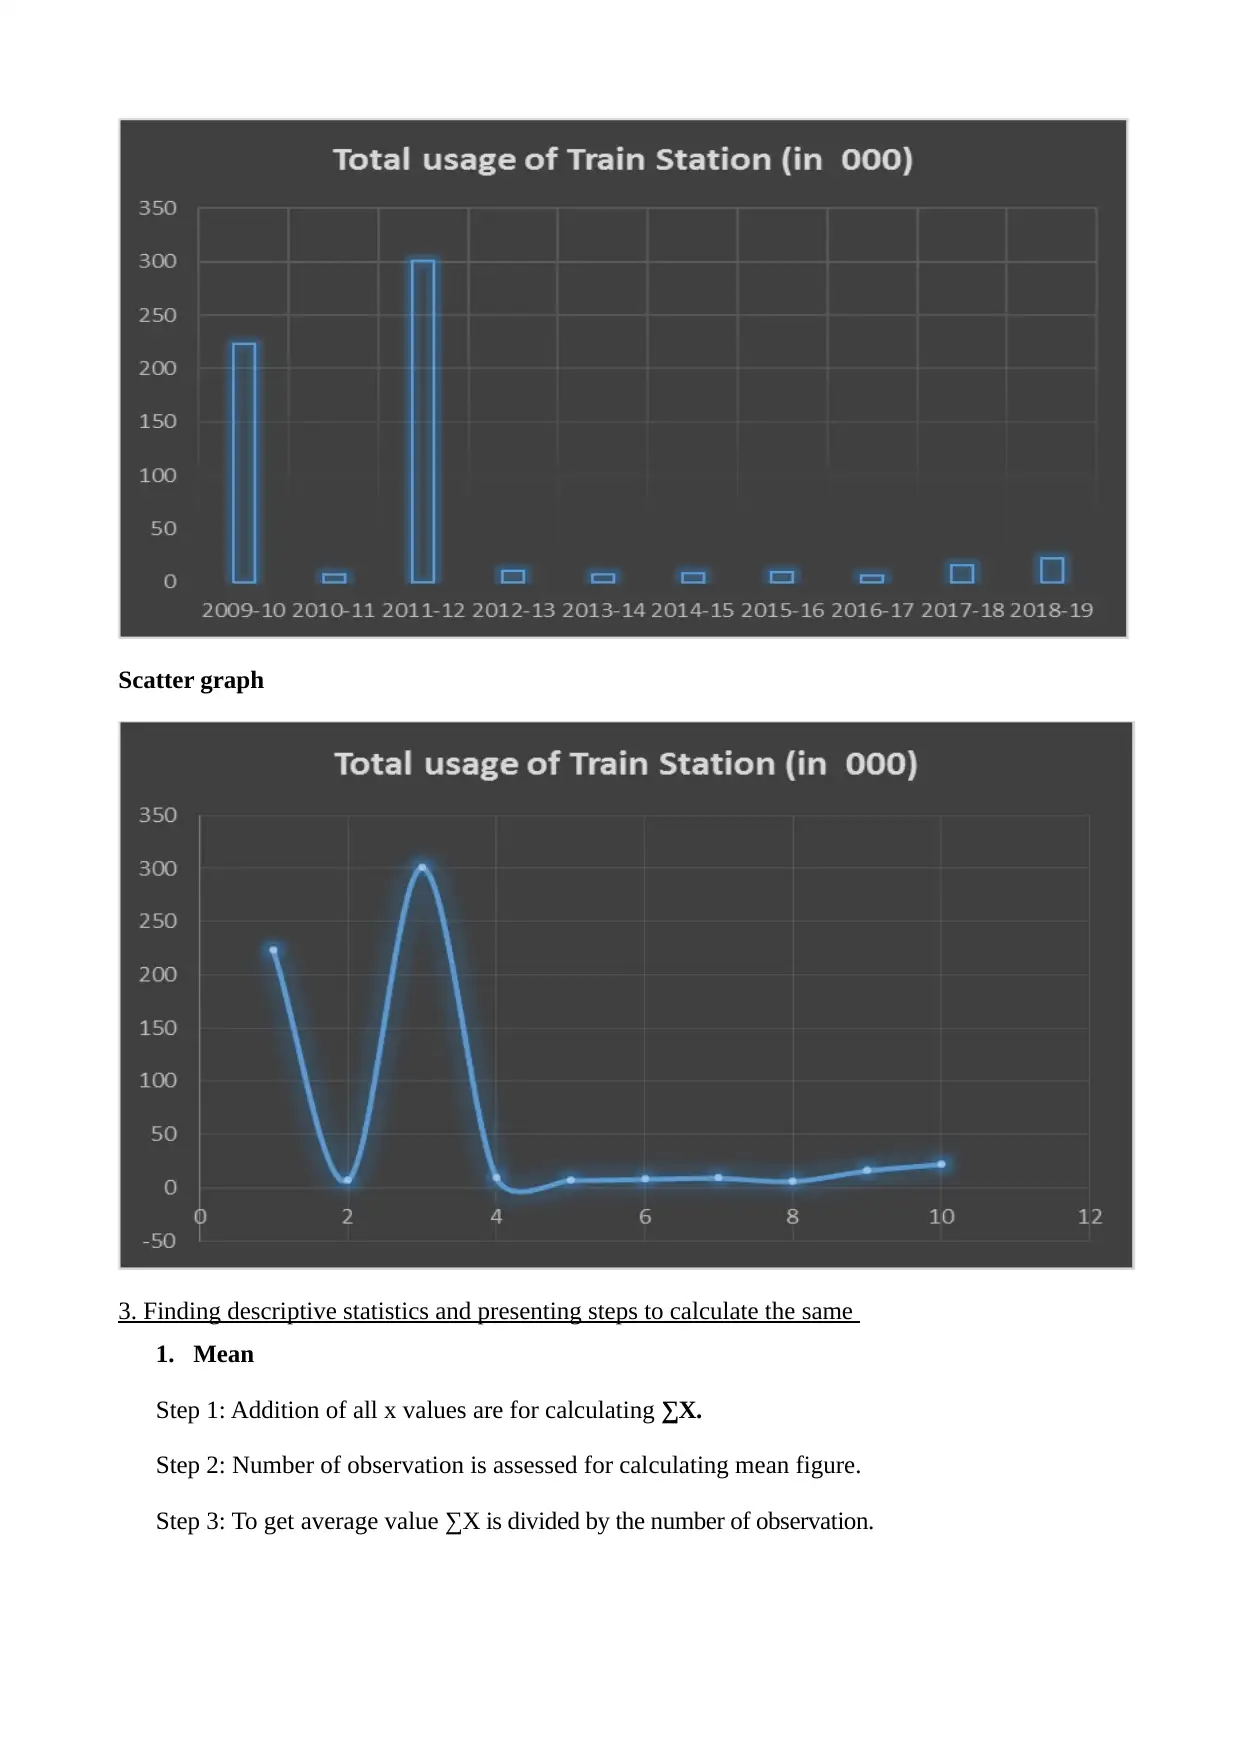
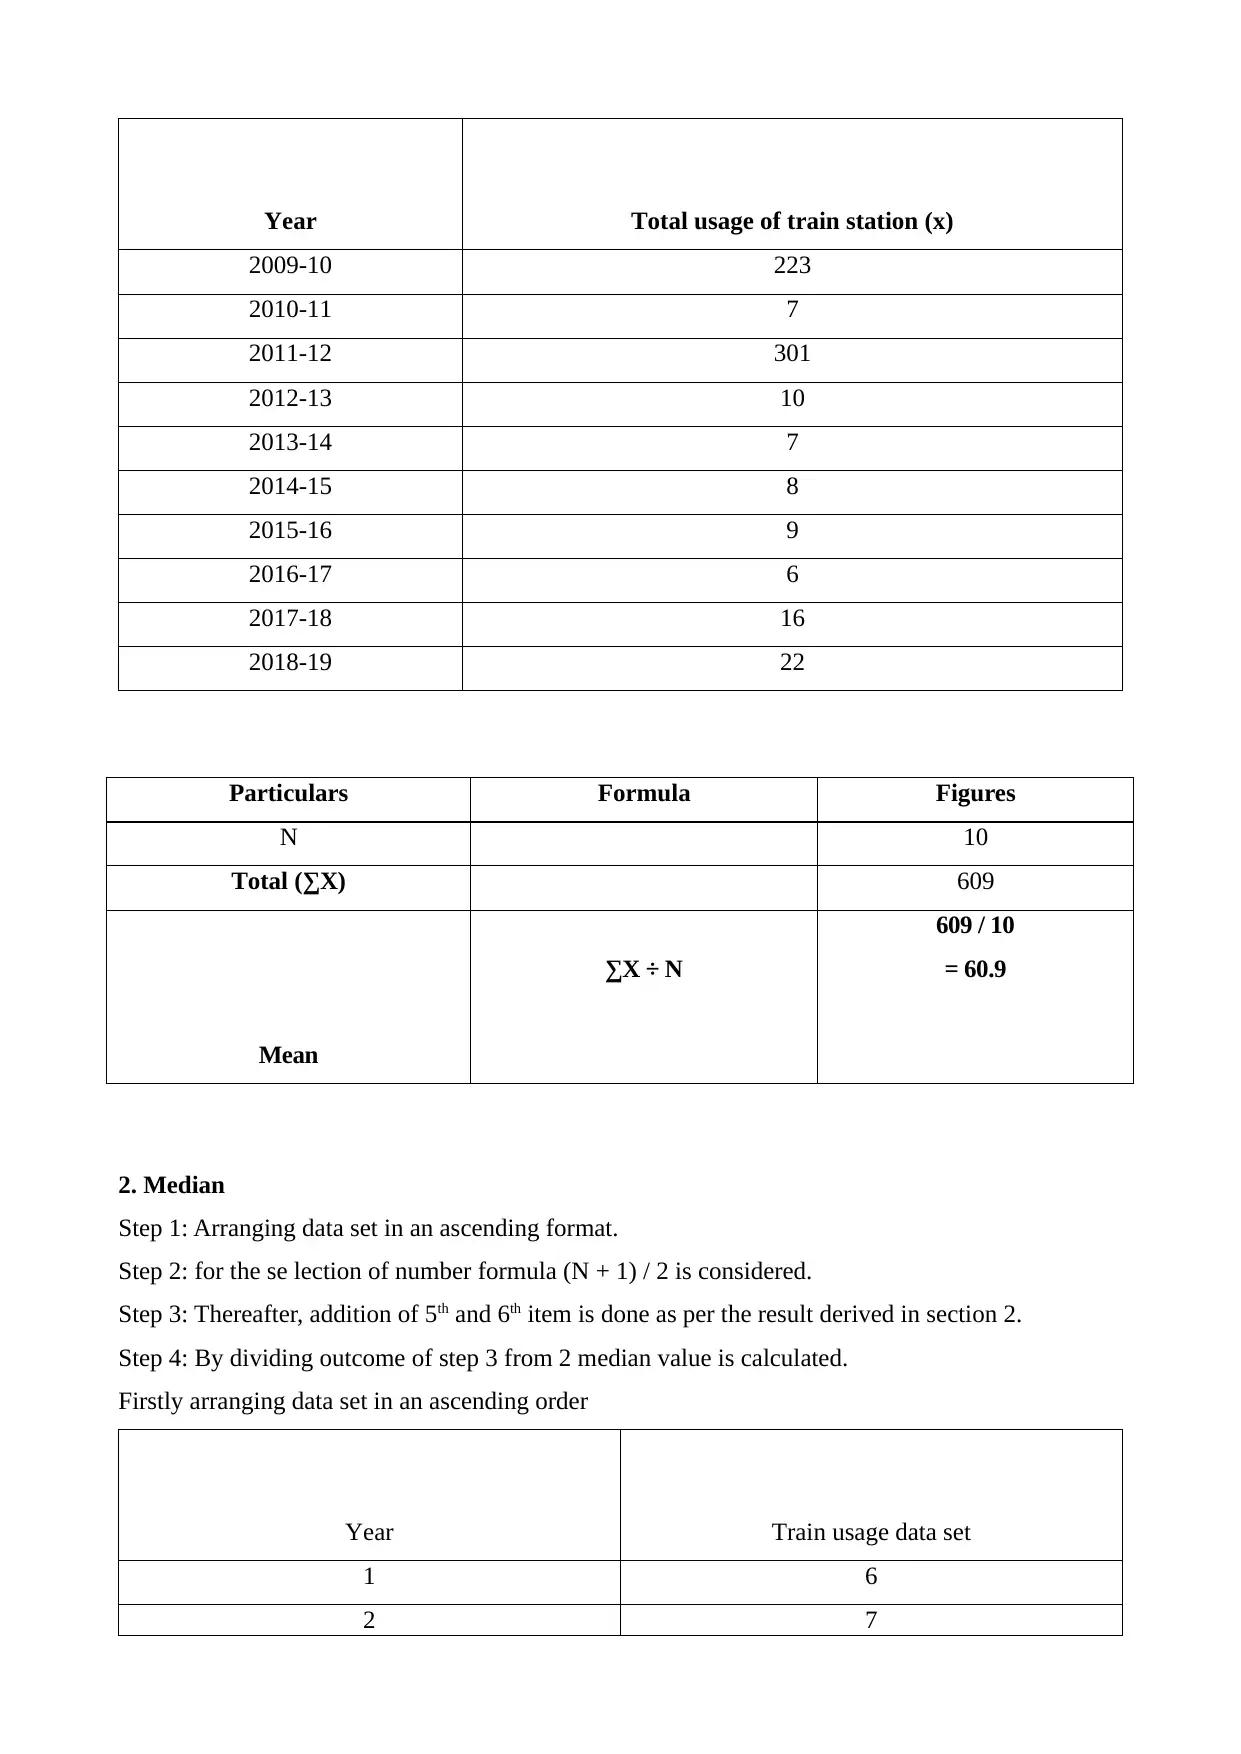
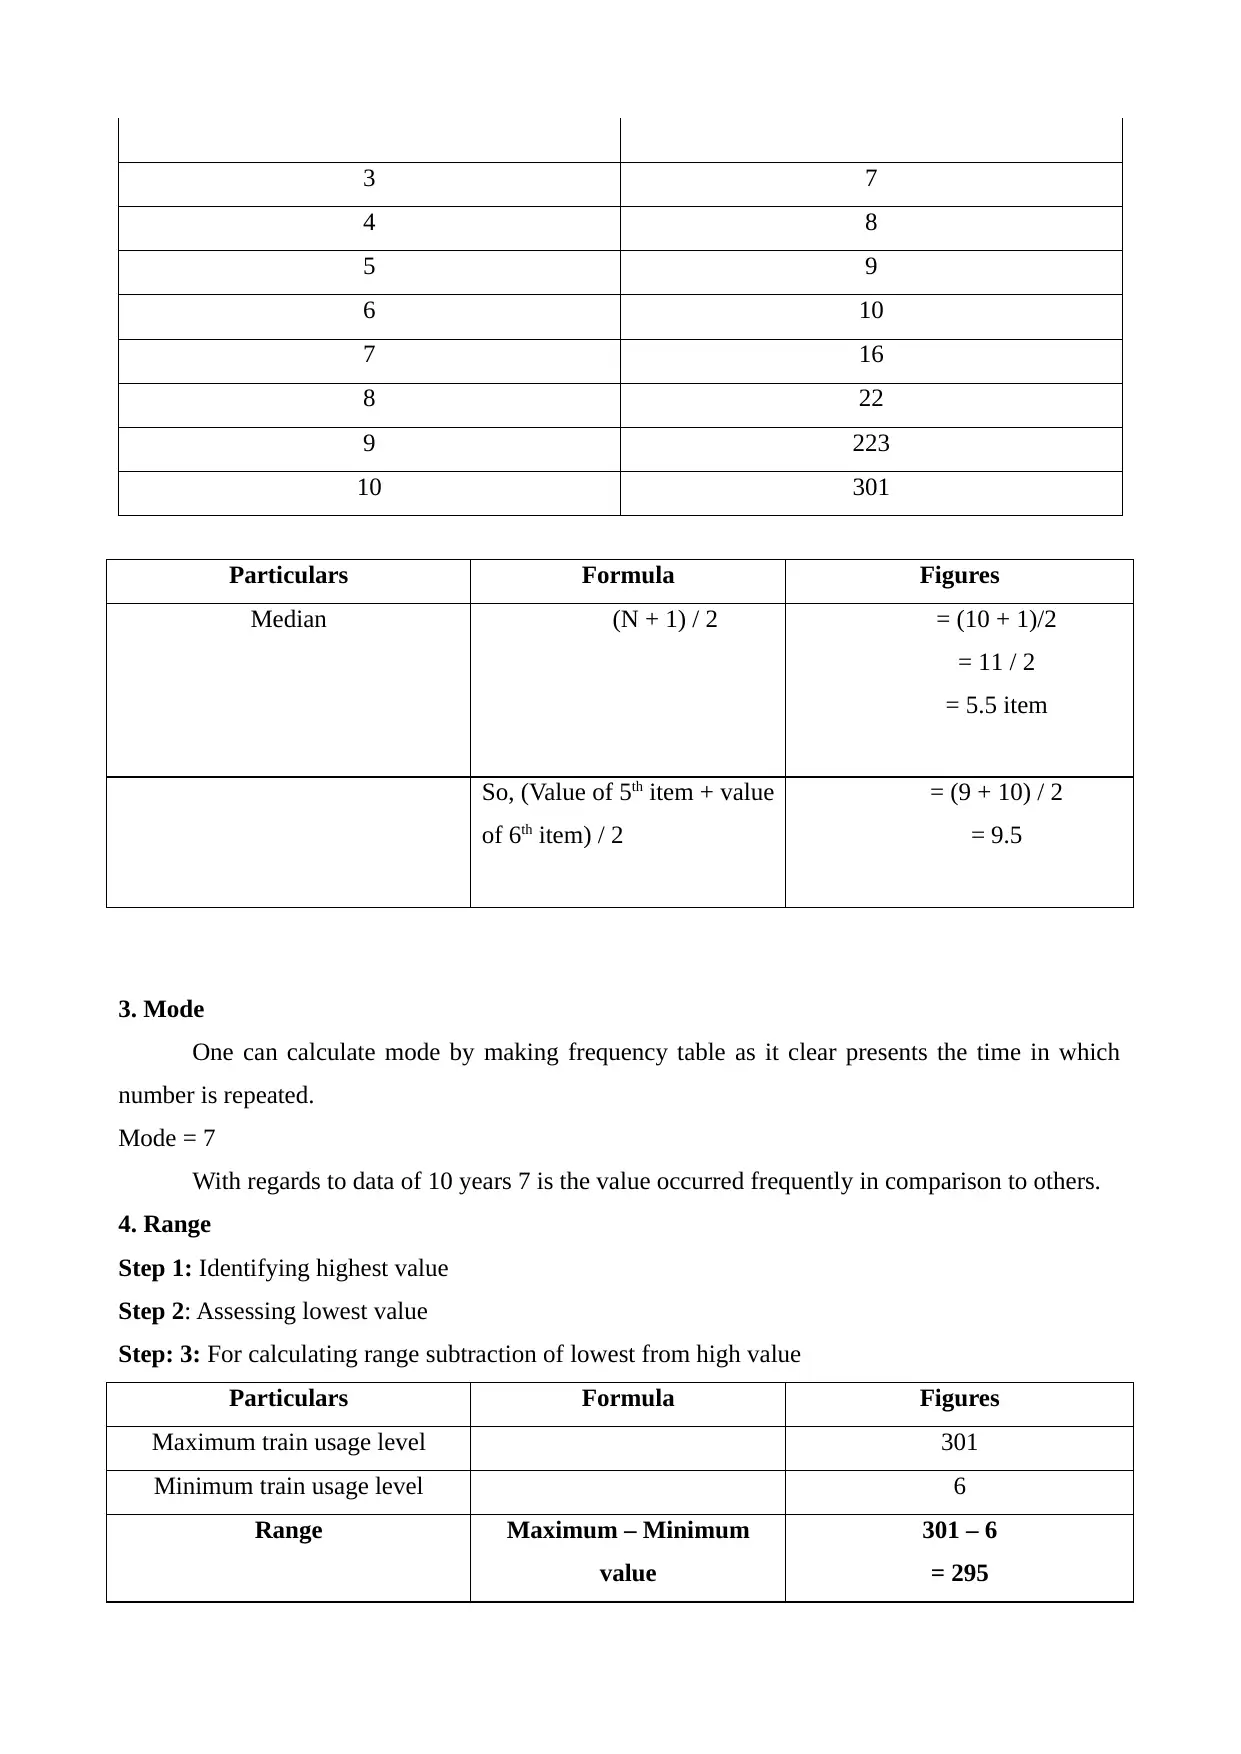
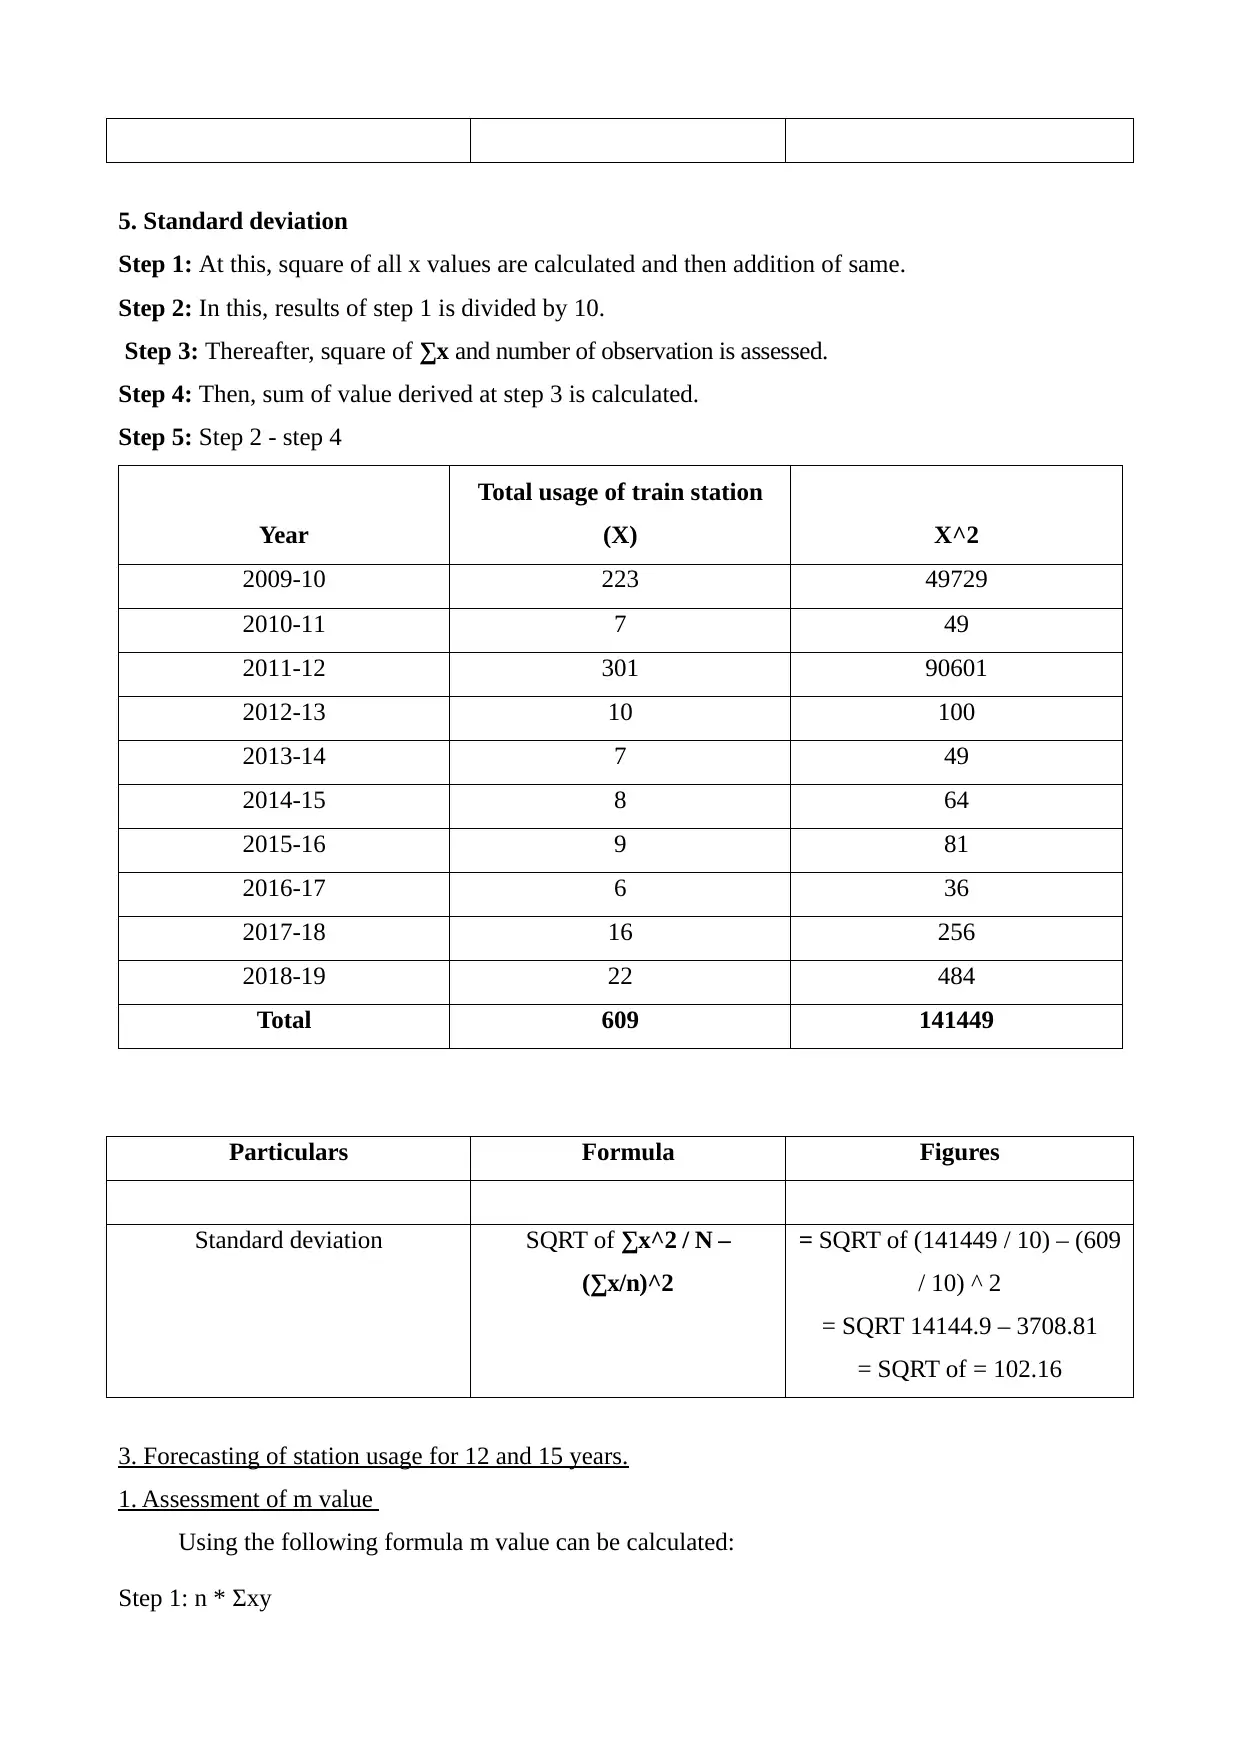
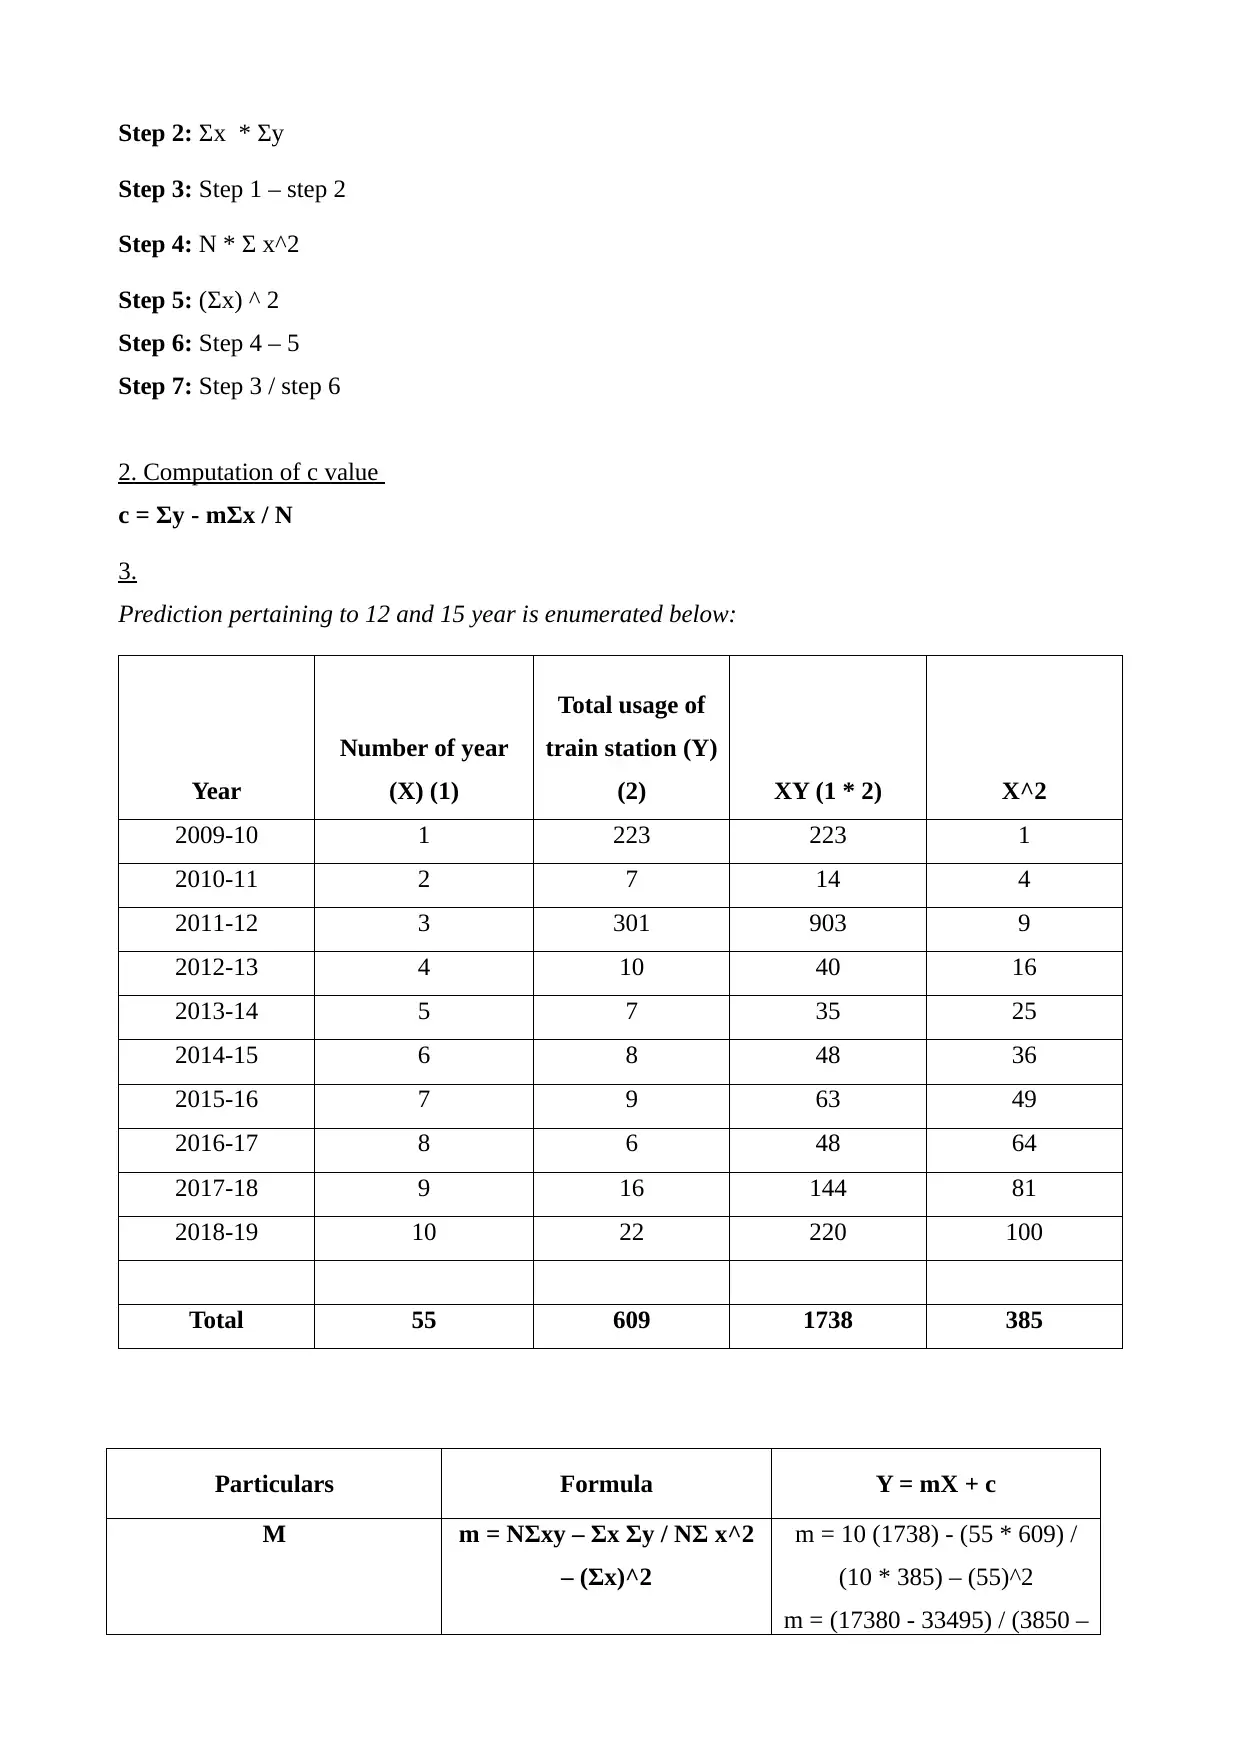
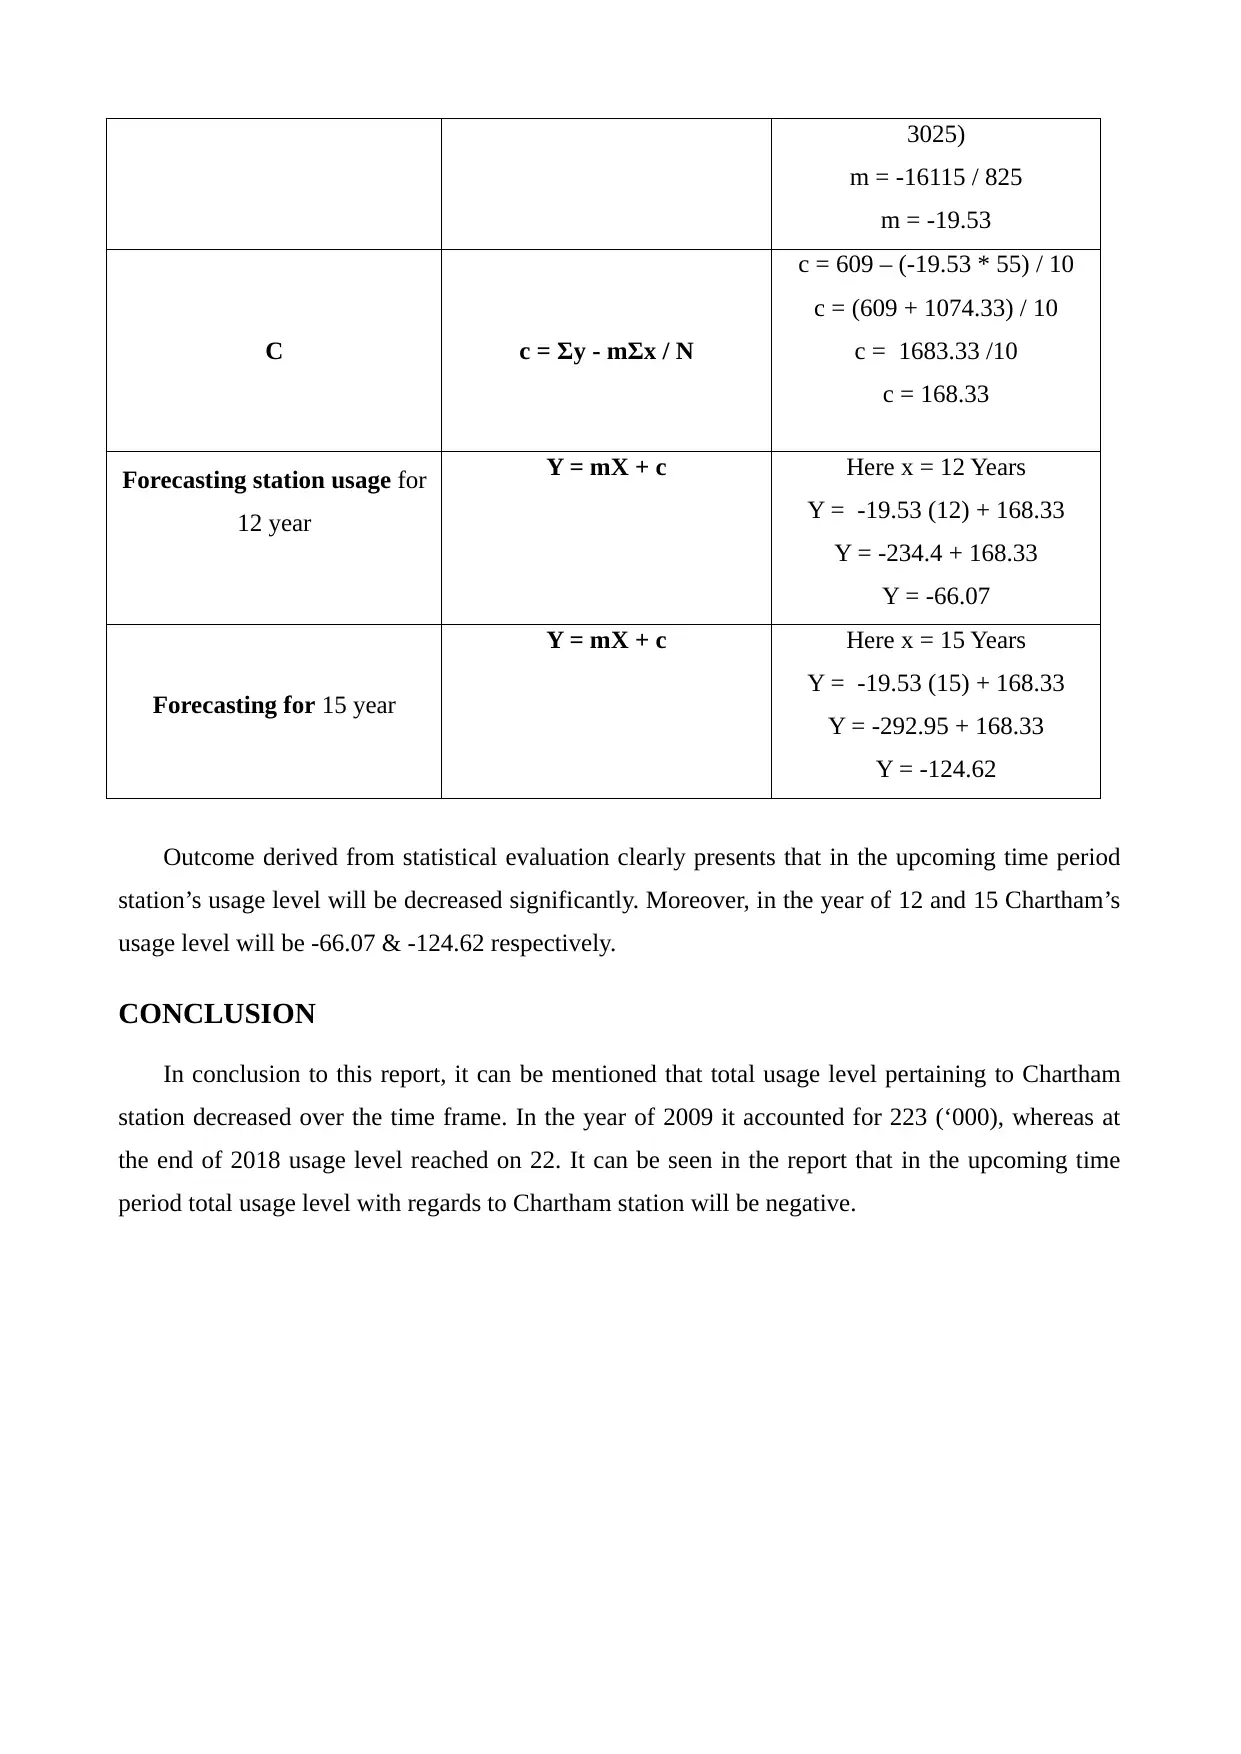
This report presents a comprehensive data analysis of train usage at Chartham station. It begins with an introduction to statistical data analysis and its application to the provided dataset. The main body of the report includes the data on train usage from 2009-10 to 2018-19, followed by graphical representations of the data. The report then details the calculation of descriptive statistics such as mean, median, mode, range, and standard deviation. Formulas and step-by-step calculations are provided for each statistic. Furthermore, the report includes forecasting of station usage for 12 and 15 years using linear regression, with detailed calculations of the 'm' and 'c' values. The conclusion summarizes the findings, highlighting the decreasing trend in station usage and the forecasted negative usage levels. The report references the source of the data used for the analysis.
Document Page
Numeracy and Data Analysis
tabler-icon-diamond-filled.svg

Paraphrase This Document

Need a fresh take? Get an instant paraphrase of this document with our AI Paraphraser
Document Page
TABLE OF CONTENTS
INTRODUCTION................................................................................................................................3
MAIN BODY.......................................................................................................................................3
1. Data with regards to train usage level of Chartham station.........................................................3
2. Graphical presentation.................................................................................................................3
3. Finding descriptive statistics and presenting steps to calculate the same....................................4
3. Forecasting of station usage for 12 and 15 years.........................................................................7
CONCLUSION....................................................................................................................................9
REFERENCES...................................................................................................................................10
Document Page
INTRODUCTION
Statistical data analysis may be served as a process which helps in making assessment of
quantitative variables effectually. By taking into account statistical tools detailed data set can be
analysed prominently and thereby provide framework for decision making. For this project,
Chartham station has been selected which make focus on analysing and evaluation data in relation
to train usage level. Further, report will also shed light on the mean, median and mode of data set. It
also depicts total usage of concerned stations in the year of 12 & 15.
MAIN BODY
1. Data with regards to train usage level of Chartham station
Year Total usage of Train Station (in
000)
2009-10 223
2010-11 7
2011-12 301
2012-13 10
2013-14 7
2014-15 8
2015-16 9
2016-17 6
2017-18 16
2018-19 22
(Source: Total usage level of Chartham station, 2019)
2. Graphical presentation
Column graph
Document Page
Scatter graph
3. Finding descriptive statistics and presenting steps to calculate the same
1. Mean
Step 1: Addition of all x values are for calculating ∑X.
Step 2: Number of observation is assessed for calculating mean figure.
Step 3: To get average value ∑X is divided by the number of observation.
tabler-icon-diamond-filled.svg

Paraphrase This Document

Need a fresh take? Get an instant paraphrase of this document with our AI Paraphraser
Document Page
Year Total usage of train station (x)
2009-10 223
2010-11 7
2011-12 301
2012-13 10
2013-14 7
2014-15 8
2015-16 9
2016-17 6
2017-18 16
2018-19 22
Particulars Formula Figures
N 10
Total (∑X) 609
Mean
∑X ÷ N
609 / 10
= 60.9
2. Median
Step 1: Arranging data set in an ascending format.
Step 2: for the se lection of number formula (N + 1) / 2 is considered.
Step 3: Thereafter, addition of 5th and 6th item is done as per the result derived in section 2.
Step 4: By dividing outcome of step 3 from 2 median value is calculated.
Firstly arranging data set in an ascending order
Year Train usage data set
1 6
2 7
Document Page
3 7
4 8
5 9
6 10
7 16
8 22
9 223
10 301
Particulars Formula Figures
Median (N + 1) / 2 = (10 + 1)/2
= 11 / 2
= 5.5 item
So, (Value of 5th item + value
of 6th item) / 2
= (9 + 10) / 2
= 9.5
3. Mode
One can calculate mode by making frequency table as it clear presents the time in which
number is repeated.
Mode = 7
With regards to data of 10 years 7 is the value occurred frequently in comparison to others.
4. Range
Step 1: Identifying highest value
Step 2: Assessing lowest value
Step: 3: For calculating range subtraction of lowest from high value
Particulars Formula Figures
Maximum train usage level 301
Minimum train usage level 6
Range Maximum – Minimum
value
301 – 6
= 295
Document Page
5. Standard deviation
Step 1: At this, square of all x values are calculated and then addition of same.
Step 2: In this, results of step 1 is divided by 10.
Step 3: Thereafter, square of ∑x and number of observation is assessed.
Step 4: Then, sum of value derived at step 3 is calculated.
Step 5: Step 2 - step 4
Year
Total usage of train station
(X) X^2
2009-10 223 49729
2010-11 7 49
2011-12 301 90601
2012-13 10 100
2013-14 7 49
2014-15 8 64
2015-16 9 81
2016-17 6 36
2017-18 16 256
2018-19 22 484
Total 609 141449
Particulars Formula Figures
Standard deviation SQRT of ∑x^2 / N –
(∑x/n)^2
= SQRT of (141449 / 10) – (609
/ 10) ^ 2
= SQRT 14144.9 – 3708.81
= SQRT of = 102.16
3. Forecasting of station usage for 12 and 15 years.
1. Assessment of m value
Using the following formula m value can be calculated:
Step 1: n * Σxy
tabler-icon-diamond-filled.svg

Paraphrase This Document

Need a fresh take? Get an instant paraphrase of this document with our AI Paraphraser
Document Page
Step 2: Σx * Σy
Step 3: Step 1 – step 2
Step 4: N * Σ x^2
Step 5: (Σx) ^ 2
Step 6: Step 4 – 5
Step 7: Step 3 / step 6
2. Computation of c value
c = Σy - mΣx / N
3.
Prediction pertaining to 12 and 15 year is enumerated below:
Year
Number of year
(X) (1)
Total usage of
train station (Y)
(2) XY (1 * 2) X^2
2009-10 1 223 223 1
2010-11 2 7 14 4
2011-12 3 301 903 9
2012-13 4 10 40 16
2013-14 5 7 35 25
2014-15 6 8 48 36
2015-16 7 9 63 49
2016-17 8 6 48 64
2017-18 9 16 144 81
2018-19 10 22 220 100
Total 55 609 1738 385
Particulars Formula Y = mX + c
M m = NΣxy – Σx Σy / NΣ x^2
– (Σx)^2
m = 10 (1738) - (55 * 609) /
(10 * 385) – (55)^2
m = (17380 - 33495) / (3850 –
Document Page
3025)
m = -16115 / 825
m = -19.53
C c = Σy - mΣx / N
c = 609 – (-19.53 * 55) / 10
c = (609 + 1074.33) / 10
c = 1683.33 /10
c = 168.33
Forecasting station usage for
12 year
Y = mX + c Here x = 12 Years
Y = -19.53 (12) + 168.33
Y = -234.4 + 168.33
Y = -66.07
Forecasting for 15 year
Y = mX + c Here x = 15 Years
Y = -19.53 (15) + 168.33
Y = -292.95 + 168.33
Y = -124.62
Outcome derived from statistical evaluation clearly presents that in the upcoming time period
station’s usage level will be decreased significantly. Moreover, in the year of 12 and 15 Chartham’s
usage level will be -66.07 & -124.62 respectively.
CONCLUSION
In conclusion to this report, it can be mentioned that total usage level pertaining to Chartham
station decreased over the time frame. In the year of 2009 it accounted for 223 (‘000), whereas at
the end of 2018 usage level reached on 22. It can be seen in the report that in the upcoming time
period total usage level with regards to Chartham station will be negative.
Document Page
chevron_up_icon
1 out of 10
circle_padding
hide_on_mobile
zoom_out_icon
[object Object]