Climate Change and Organizational Structure: A Data Analysis
VerifiedAdded on  2021/06/14
|8
|1681
|100
Report
AI Summary
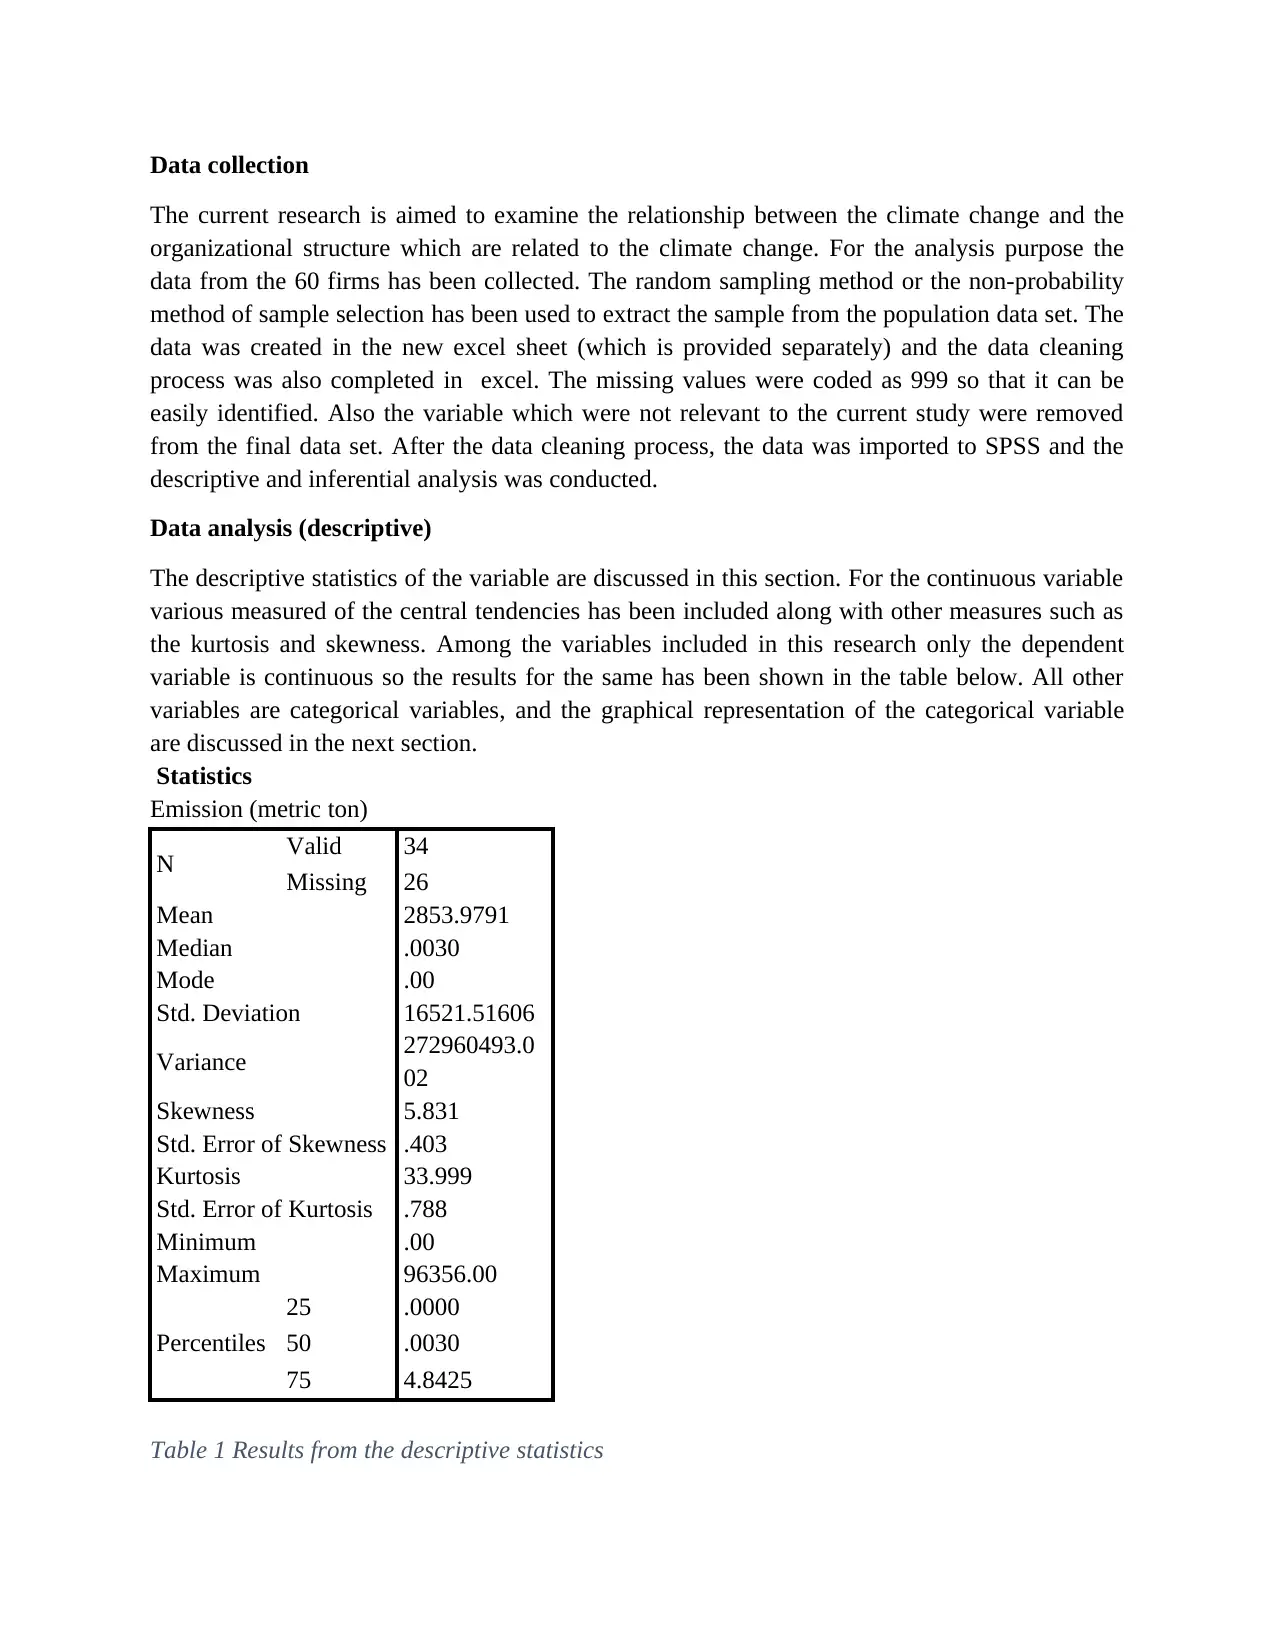
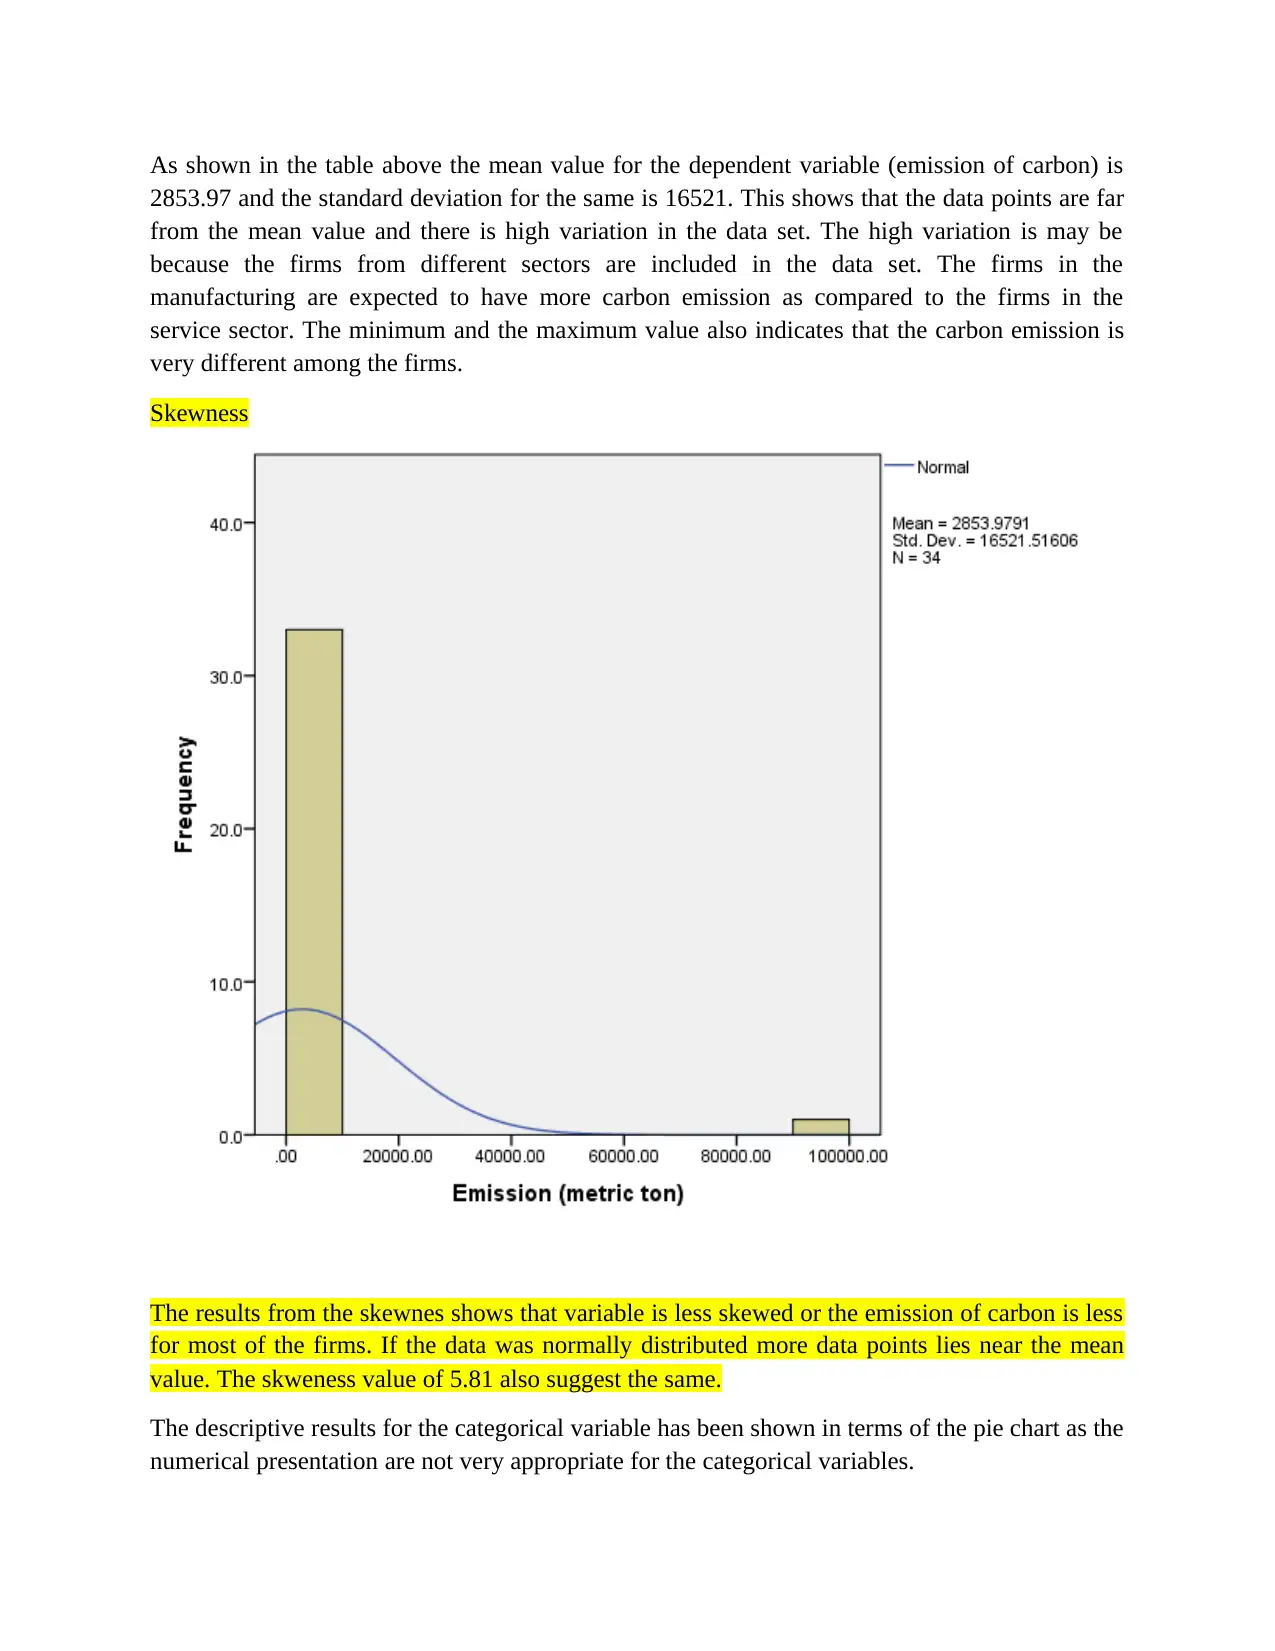
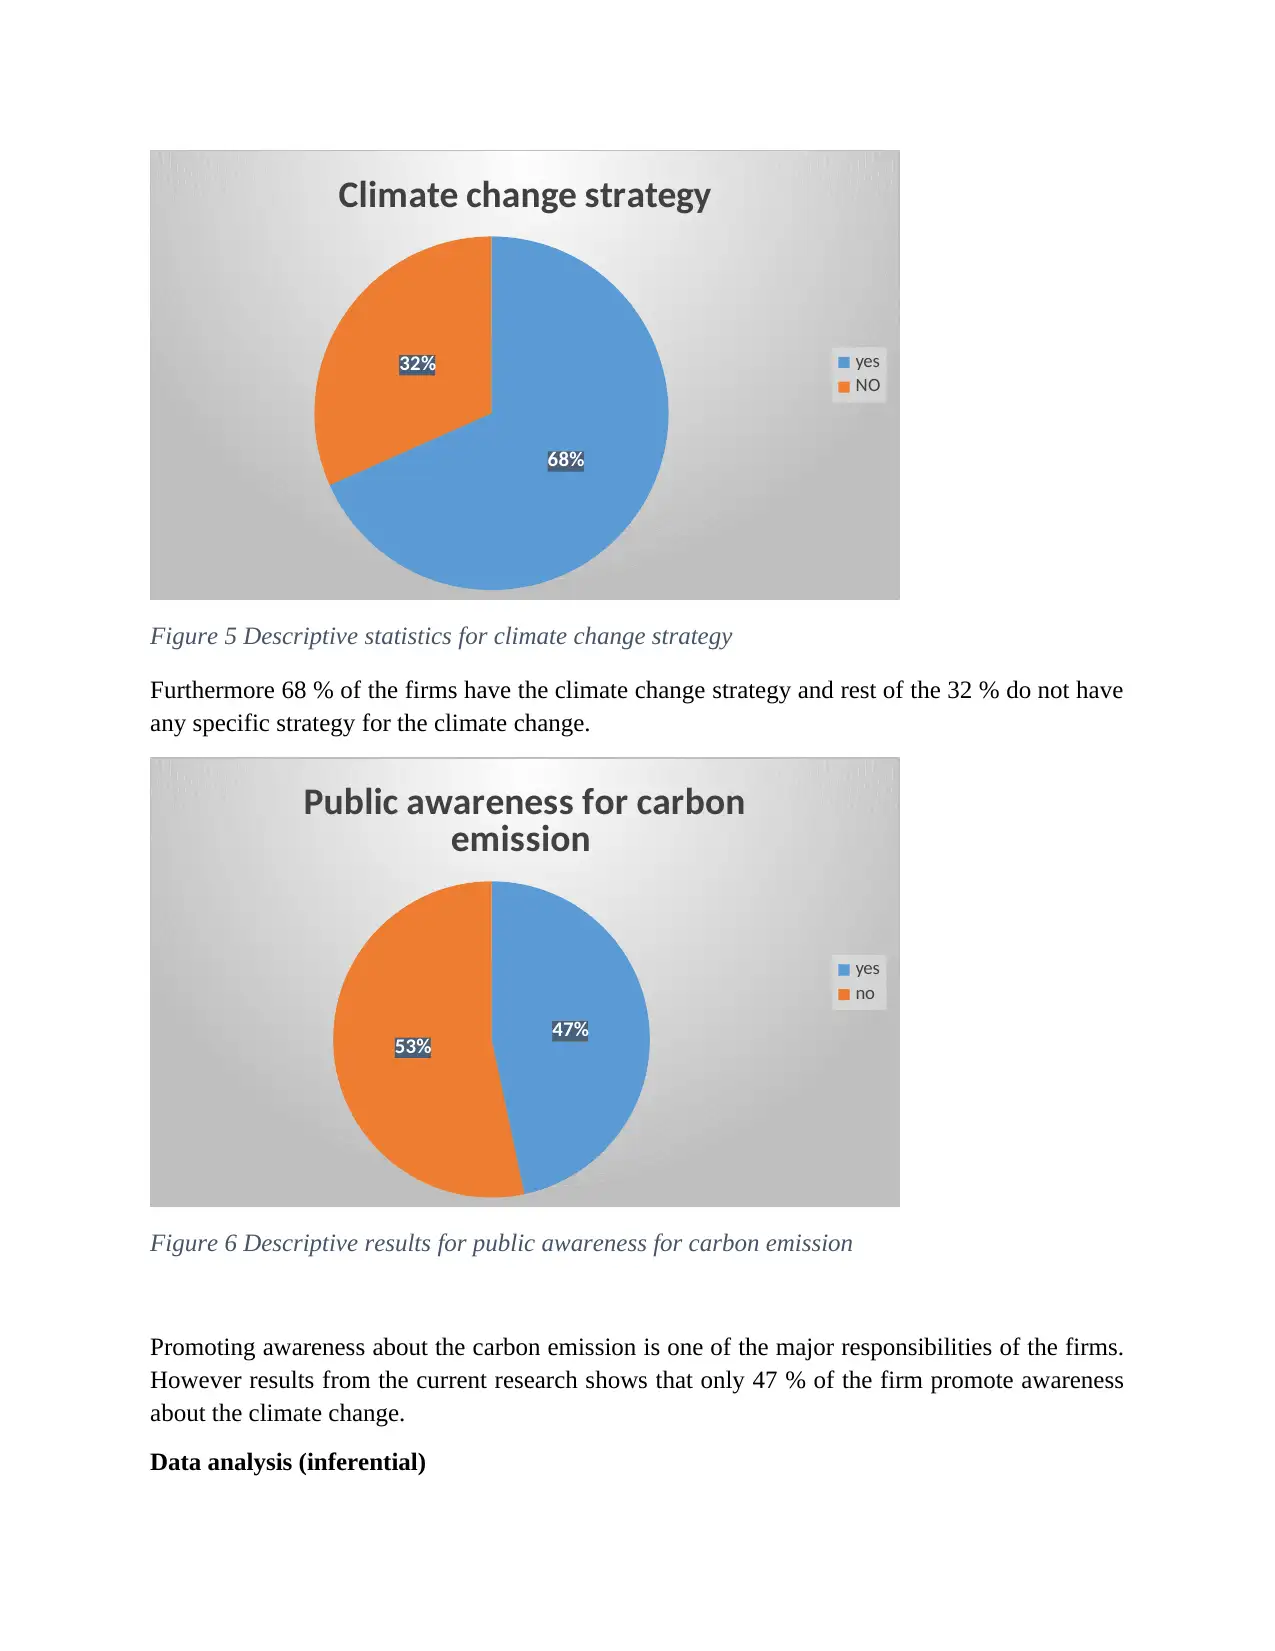
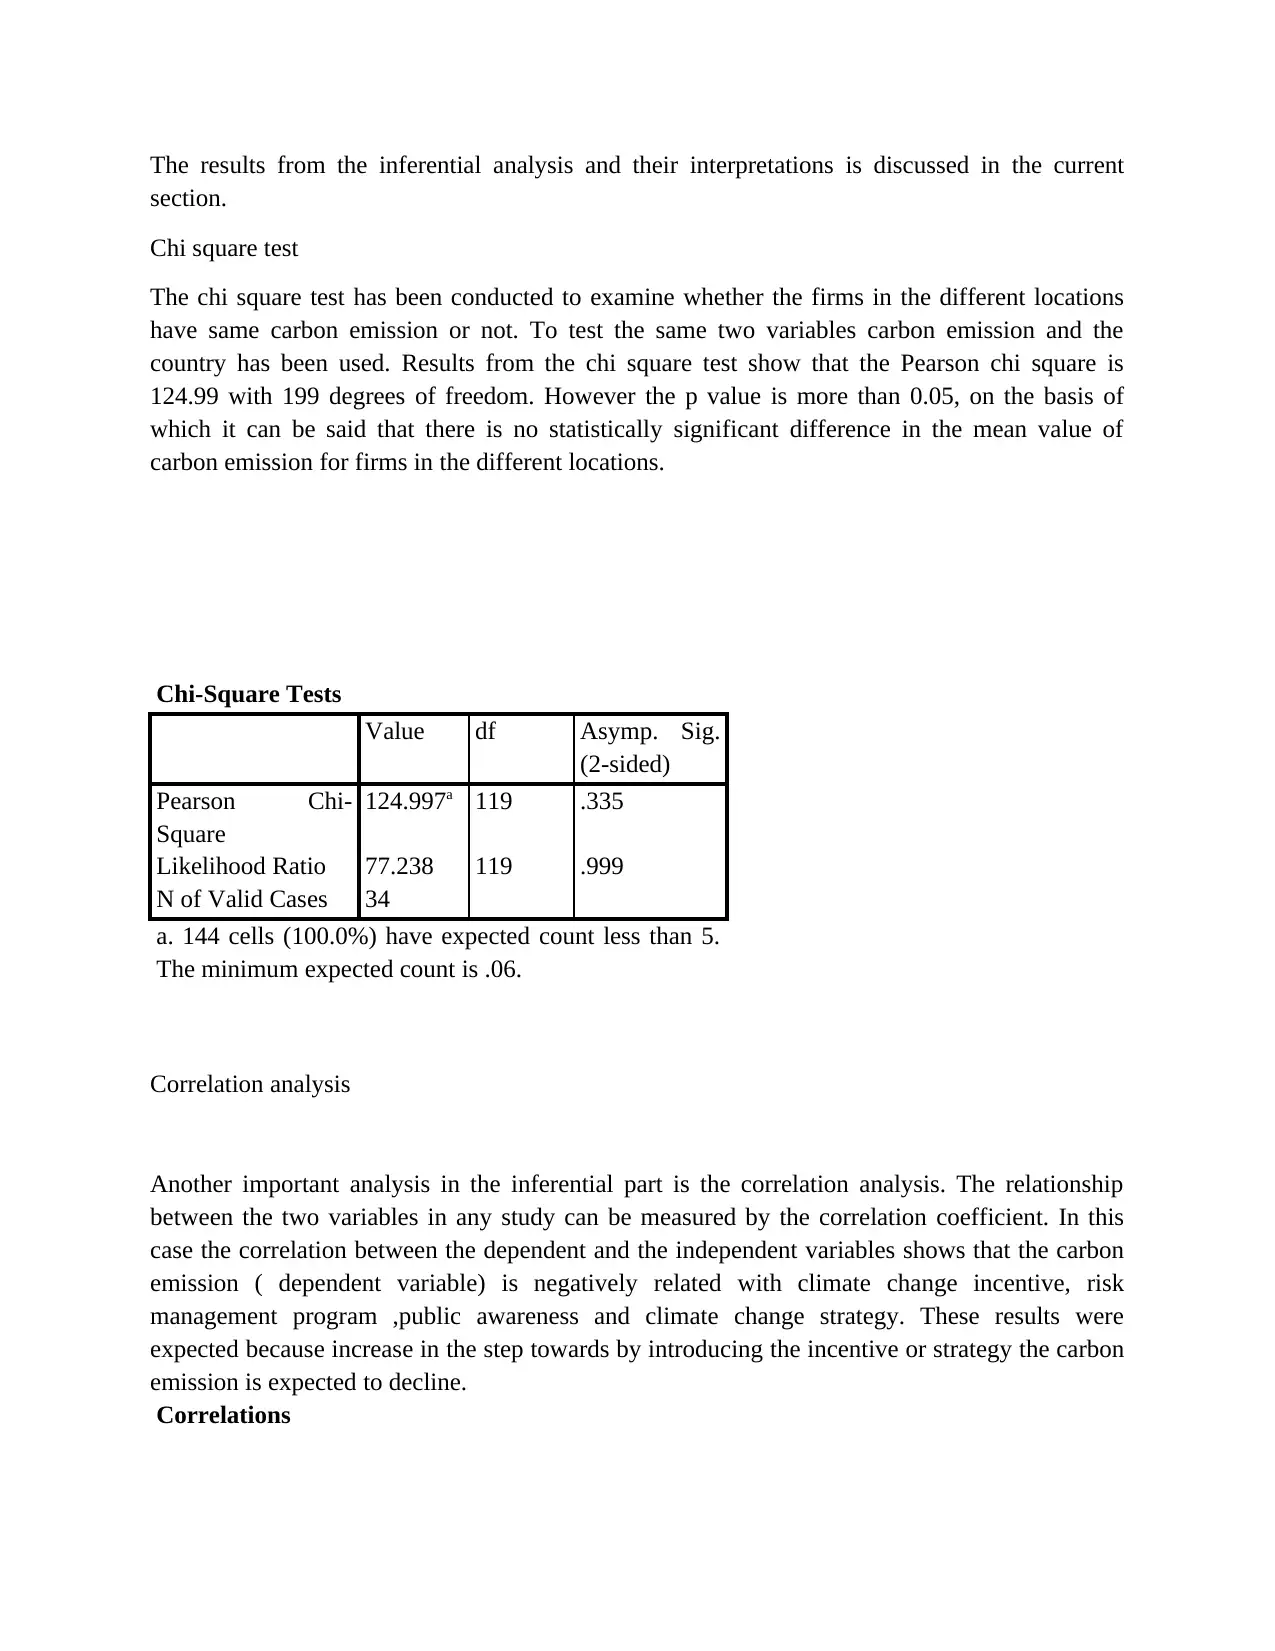
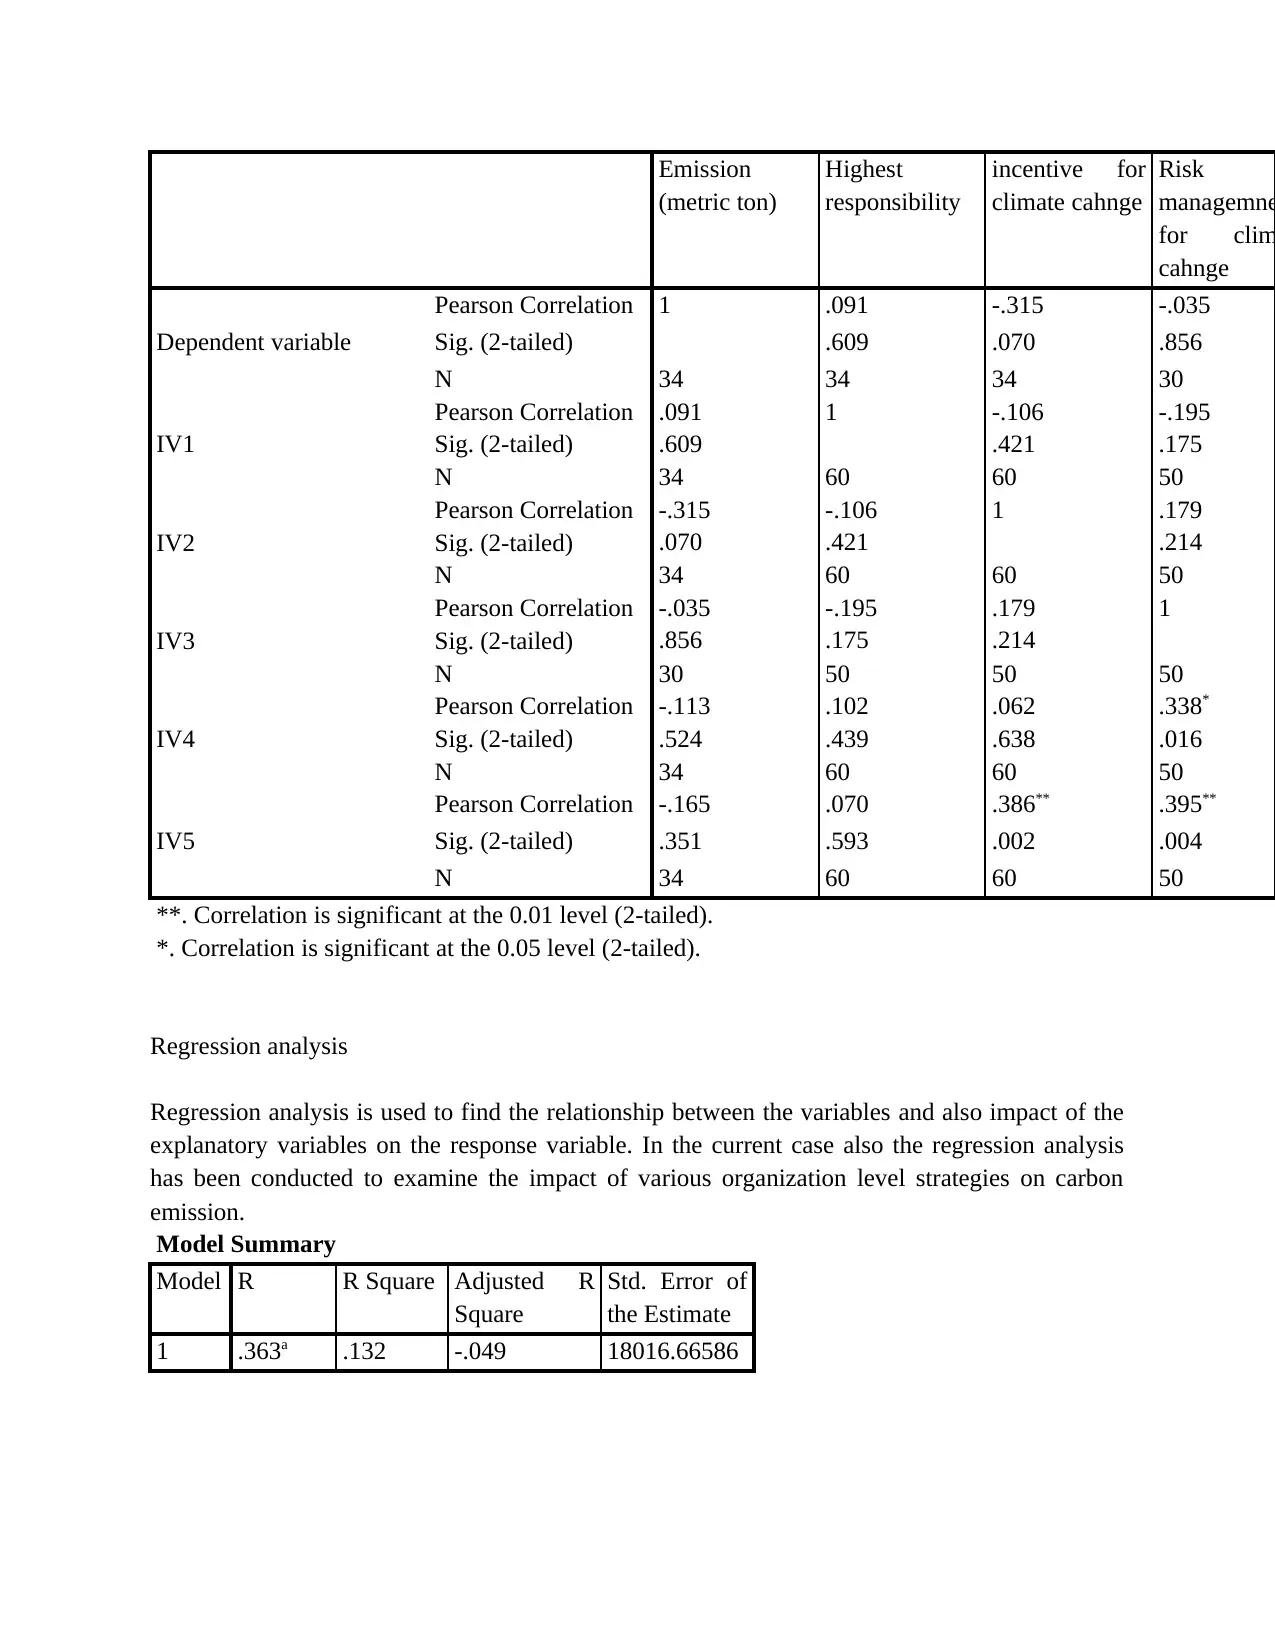
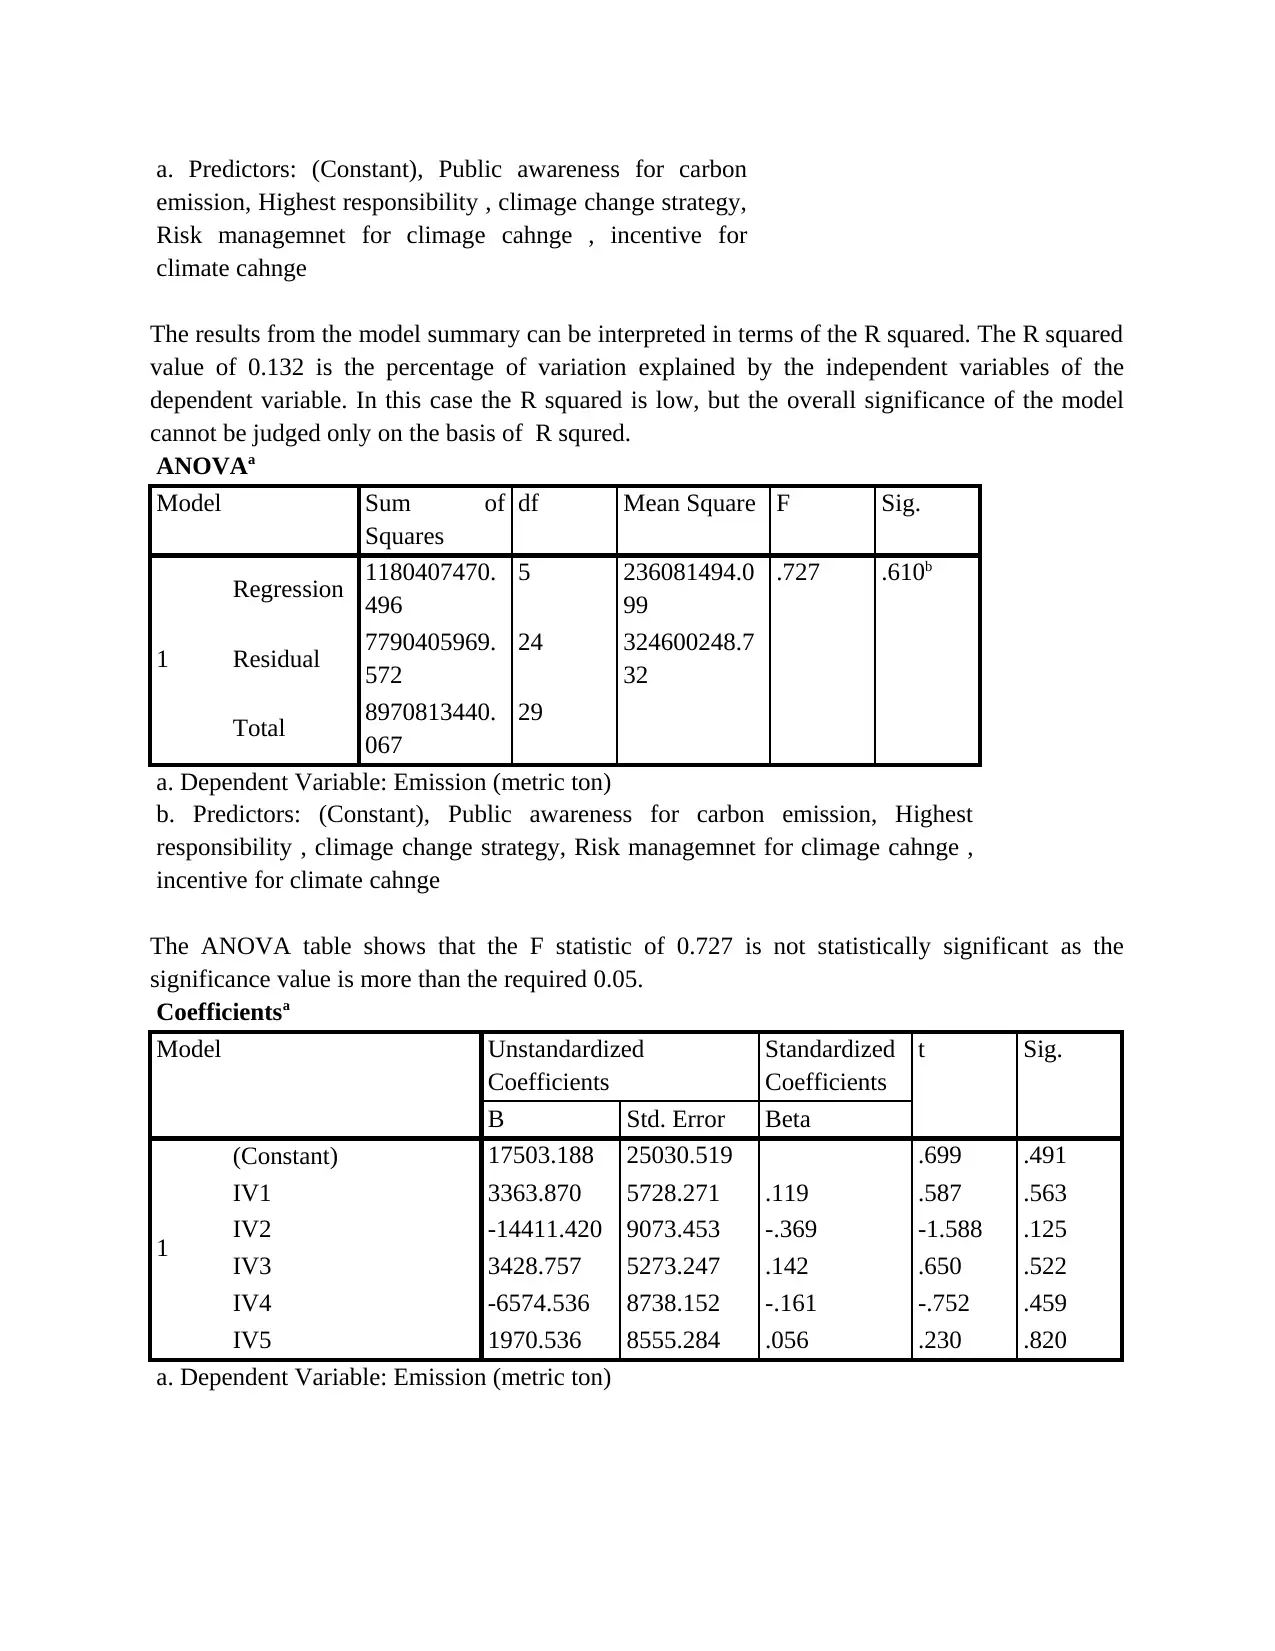
This report presents a data-driven analysis of the relationship between climate change and organizational structure, utilizing data collected from 60 firms through random sampling. The data, initially cleaned in Excel, was then imported into SPSS for descriptive and inferential statistical analysis. Descriptive statistics highlight the variation in carbon emissions among firms, while inferential analysis, including chi-square tests and correlation analysis, explores the impact of organizational strategies on carbon emissions. The results suggest a negative correlation between climate change incentives, risk management programs, public awareness, and climate change strategies with carbon emissions, though statistical significance was not consistently observed in the regression analysis. The report concludes by discussing the implications of these findings for organizational approaches to climate change mitigation.

Data collection
The current research is aimed to examine the relationship between the climate change and the
organizational structure which are related to the climate change. For the analysis purpose the
data from the 60 firms has been collected. The random sampling method or the non-probability
method of sample selection has been used to extract the sample from the population data set. The
data was created in the new excel sheet (which is provided separately) and the data cleaning
process was also completed in excel. The missing values were coded as 999 so that it can be
easily identified. Also the variable which were not relevant to the current study were removed
from the final data set. After the data cleaning process, the data was imported to SPSS and the
descriptive and inferential analysis was conducted.
Data analysis (descriptive)
The descriptive statistics of the variable are discussed in this section. For the continuous variable
various measured of the central tendencies has been included along with other measures such as
the kurtosis and skewness. Among the variables included in this research only the dependent
variable is continuous so the results for the same has been shown in the table below. All other
variables are categorical variables, and the graphical representation of the categorical variable
are discussed in the next section.
Statistics
Emission (metric ton)
N Valid 34
Missing 26
Mean 2853.9791
Median .0030
Mode .00
Std. Deviation 16521.51606
Variance 272960493.0
02
Skewness 5.831
Std. Error of Skewness .403
Kurtosis 33.999
Std. Error of Kurtosis .788
Minimum .00
Maximum 96356.00
Percentiles
25 .0000
50 .0030
75 4.8425
Table 1 Results from the descriptive statistics
Paraphrase This Document
Need a fresh take? Get an instant paraphrase of this document with our AI Paraphraser

As shown in the table above the mean value for the dependent variable (emission of carbon) is
2853.97 and the standard deviation for the same is 16521. This shows that the data points are far
from the mean value and there is high variation in the data set. The high variation is may be
because the firms from different sectors are included in the data set. The firms in the
manufacturing are expected to have more carbon emission as compared to the firms in the
service sector. The minimum and the maximum value also indicates that the carbon emission is
very different among the firms.
Skewness
The results from the skewnes shows that variable is less skewed or the emission of carbon is less
for most of the firms. If the data was normally distributed more data points lies near the mean
value. The skweness value of 5.81 also suggest the same.
The descriptive results for the categorical variable has been shown in terms of the pie chart as the
numerical presentation are not very appropriate for the categorical variables.

5% 7%
7%
7%
10%
13%25%
27%
Country
Argentina
Bermuda
Colombia
Israel
Mexico
New Zealand
Switzerland
other
Figure 1 Results from the descriptive statistics based on countries
The results from the country show that most of the firms are either developed or developing
countries. The highest proportion of countries are from Switzerland followed by the firms in
New Zealand.
5%
28%
55%
12%
Highest responsibility
other manager
Senior manager
Board
others
Figure 2 Results from the descriptive statistics for highest responsibility
Another important variable included in the data set is to examine who have the highest
responsibility of decision making on climate change in the selected firms. Results shows that for
most of the firm the board is responsible for all the decisions related to climate change in the
firm.
7%
7%
10%
13%25%
27%
Country
Argentina
Bermuda
Colombia
Israel
Mexico
New Zealand
Switzerland
other
Figure 1 Results from the descriptive statistics based on countries
The results from the country show that most of the firms are either developed or developing
countries. The highest proportion of countries are from Switzerland followed by the firms in
New Zealand.
5%
28%
55%
12%
Highest responsibility
other manager
Senior manager
Board
others
Figure 2 Results from the descriptive statistics for highest responsibility
Another important variable included in the data set is to examine who have the highest
responsibility of decision making on climate change in the selected firms. Results shows that for
most of the firm the board is responsible for all the decisions related to climate change in the
firm.
⊘ This is a preview!⊘
Do you want full access?
Subscribe today to unlock all pages.

Trusted by 1+ million students worldwide

25%
75%
Incentive for climate change
Yes
No
Figure 3 Descriptive statistics for the incentive for climate change
Similarly the results also shows that in 75 % of the firms there is incentive for climate change. In
other words the firm provide some kinds of incentive to the employees and organisations who
promote climate change or follow the eco friendly procedure.
12%
50%
38%
Risk managerment for climate
change
specific program
Integrated with
multidisciplnary program
No documente process
Figure 4 Descriptive statistics for risk management for climate change
When asked about whether the firm has the special risk management process for climate change,
50 % of the firms responds that they have the plan but are integrated with other multidisciplinary
programs of the firm. Only 12 % of the firms have specific program to deal with the climate
change.
Paraphrase This Document
Need a fresh take? Get an instant paraphrase of this document with our AI Paraphraser

68%
32%
Climate change strategy
yes
NO
Figure 5 Descriptive statistics for climate change strategy
Furthermore 68 % of the firms have the climate change strategy and rest of the 32 % do not have
any specific strategy for the climate change.
47%
53%
Public awareness for carbon
emission
yes
no
Figure 6 Descriptive results for public awareness for carbon emission
Promoting awareness about the carbon emission is one of the major responsibilities of the firms.
However results from the current research shows that only 47 % of the firm promote awareness
about the climate change.
Data analysis (inferential)

The results from the inferential analysis and their interpretations is discussed in the current
section.
Chi square test
The chi square test has been conducted to examine whether the firms in the different locations
have same carbon emission or not. To test the same two variables carbon emission and the
country has been used. Results from the chi square test show that the Pearson chi square is
124.99 with 199 degrees of freedom. However the p value is more than 0.05, on the basis of
which it can be said that there is no statistically significant difference in the mean value of
carbon emission for firms in the different locations.
Chi-Square Tests
Value df Asymp. Sig.
(2-sided)
Pearson Chi-
Square
124.997a 119 .335
Likelihood Ratio 77.238 119 .999
N of Valid Cases 34
a. 144 cells (100.0%) have expected count less than 5.
The minimum expected count is .06.
Correlation analysis
Another important analysis in the inferential part is the correlation analysis. The relationship
between the two variables in any study can be measured by the correlation coefficient. In this
case the correlation between the dependent and the independent variables shows that the carbon
emission ( dependent variable) is negatively related with climate change incentive, risk
management program ,public awareness and climate change strategy. These results were
expected because increase in the step towards by introducing the incentive or strategy the carbon
emission is expected to decline.
Correlations
⊘ This is a preview!⊘
Do you want full access?
Subscribe today to unlock all pages.

Trusted by 1+ million students worldwide

Emission
(metric ton)
Highest
responsibility
incentive for
climate cahnge
Risk
managemne
for clim
cahnge
Dependent variable
Pearson Correlation 1 .091 -.315 -.035
Sig. (2-tailed) .609 .070 .856
N 34 34 34 30
IV1
Pearson Correlation .091 1 -.106 -.195
Sig. (2-tailed) .609 .421 .175
N 34 60 60 50
IV2
Pearson Correlation -.315 -.106 1 .179
Sig. (2-tailed) .070 .421 .214
N 34 60 60 50
IV3
Pearson Correlation -.035 -.195 .179 1
Sig. (2-tailed) .856 .175 .214
N 30 50 50 50
IV4
Pearson Correlation -.113 .102 .062 .338*
Sig. (2-tailed) .524 .439 .638 .016
N 34 60 60 50
IV5
Pearson Correlation -.165 .070 .386** .395**
Sig. (2-tailed) .351 .593 .002 .004
N 34 60 60 50
**. Correlation is significant at the 0.01 level (2-tailed).
*. Correlation is significant at the 0.05 level (2-tailed).
Regression analysis
Regression analysis is used to find the relationship between the variables and also impact of the
explanatory variables on the response variable. In the current case also the regression analysis
has been conducted to examine the impact of various organization level strategies on carbon
emission.
Model Summary
Model R R Square Adjusted R
Square
Std. Error of
the Estimate
1 .363a .132 -.049 18016.66586
Paraphrase This Document
Need a fresh take? Get an instant paraphrase of this document with our AI Paraphraser

a. Predictors: (Constant), Public awareness for carbon
emission, Highest responsibility , climage change strategy,
Risk managemnet for climage cahnge , incentive for
climate cahnge
The results from the model summary can be interpreted in terms of the R squared. The R squared
value of 0.132 is the percentage of variation explained by the independent variables of the
dependent variable. In this case the R squared is low, but the overall significance of the model
cannot be judged only on the basis of R squred.
ANOVAa
Model Sum of
Squares
df Mean Square F Sig.
1
Regression 1180407470.
496
5 236081494.0
99
.727 .610b
Residual 7790405969.
572
24 324600248.7
32
Total 8970813440.
067
29
a. Dependent Variable: Emission (metric ton)
b. Predictors: (Constant), Public awareness for carbon emission, Highest
responsibility , climage change strategy, Risk managemnet for climage cahnge ,
incentive for climate cahnge
The ANOVA table shows that the F statistic of 0.727 is not statistically significant as the
significance value is more than the required 0.05.
Coefficientsa
Model Unstandardized
Coefficients
Standardized
Coefficients
t Sig.
B Std. Error Beta
1
(Constant) 17503.188 25030.519 .699 .491
IV1 3363.870 5728.271 .119 .587 .563
IV2 -14411.420 9073.453 -.369 -1.588 .125
IV3 3428.757 5273.247 .142 .650 .522
IV4 -6574.536 8738.152 -.161 -.752 .459
IV5 1970.536 8555.284 .056 .230 .820
a. Dependent Variable: Emission (metric ton)
1 out of 8
Related Documents

Your All-in-One AI-Powered Toolkit for Academic Success.
 +13062052269
info@desklib.com
Available 24*7 on WhatsApp / Email
Unlock your academic potential
Copyright © 2020–2025 A2Z Services. All Rights Reserved. Developed and managed by ZUCOL.