Data Analysis Report on Age-Adjusted Death Rate and Life Expectancy
VerifiedAdded on 2023/06/05
|31
|5888
|496
Report
AI Summary
This report presents a data analysis of age-adjusted death rates and average life expectancy in the United States, exploring trends from 1900 to 2015. The analysis examines two datasets, one focusing on disease-specific mortality across states and the other on life expectancy and death rates by race and gender. The study employs quantitative research methods, utilizing Weka and Microsoft Excel for statistical analysis, including descriptive statistics, regression analysis, and hypothesis testing. Key findings highlight disparities in life expectancy and death rates based on race and gender, revealing that white females have the highest life expectancy, while black males have the lowest. The report delves into the skewness of the data and provides detailed descriptive statistics, including means, medians, and standard deviations. The analysis aims to assess the impact of demographic factors on health outcomes and inform potential healthcare reforms, with detailed results and graphical representations included in the appendix.
First Name: 1
Data Analysis: Age-adjusted Death Rate and Average Life Expectancy
Type of Academic Paper
Date
Word Count
Student's Name
Affiliation/University Name
Data Analysis: Age-adjusted Death Rate and Average Life Expectancy
Type of Academic Paper
Date
Word Count
Student's Name
Affiliation/University Name
Paraphrase This Document
Need a fresh take? Get an instant paraphrase of this document with our AI Paraphraser
First Name: 2
Table of Content
Background and Motivation........................................................................................................................3
Material for Analysis...................................................................................................................................4
Analysis Approach......................................................................................................................................5
Findings.......................................................................................................................................................7
Dataset 1..................................................................................................................................................7
Dataset 2................................................................................................................................................19
Interpretation.............................................................................................................................................24
Recommendations.....................................................................................................................................27
Reference List...........................................................................................................................................28
Appendix...................................................................................................................................................29
First Name: 3
Data Analysis: Age-adjusted Death Rate and Average Life Expectancy
Background and Motivation
In the assessment of population health and overall well-being in a given country, there
are several factors to consider; such as, the prevalence of diseases, life expectancy, and average
death rate with regards to region, age, year, and race. The information obtained from these
assessment tests will aid with the determination of whether or not the country being evaluated
has an effective healthcare system and the government has put in place the proper regulations
and incentives to boost food availability, nutrition, and disease control1. For instance health data
collected from all States across the United States of America over the last five decades will aid in
understanding whether or not the quality of life for Americans has improved in the last ten years.
In the same way, race centric data can be used to assess inequalities of healthcare services with
regard to race. For instance, more white people could be accessing quality healthcare services
compared to black individuals with the same income per capita. Moreover, examination of data
with regard to regions and states helps with the recognition of correlation between different
variables in the diverse categories. According to most medical professionals, women are more
likely to solicit healthcare service compared to men suffering from the same physical and mental
ailment. This situation has led physicians to believe that men have a lower life expectancy
compared to women; and in addition, they are more at risk of succumbing to death as a result of
failure to secure medical treatment at the proper time2.
1 Rajendar Kumar, Research Methodology (New Delhi: APH Publishing, 2008), 34–120.
2 George A. F. Seber, and Alan J. Lee, Linear Regression Analysis (Hoboken: John Wiley &
Sons, 2012), 1–582.
⊘ This is a preview!⊘
Do you want full access?
Subscribe today to unlock all pages.
Trusted by 1+ million students worldwide
First Name: 4
In the United States of America, organizations like the Centers for Disease Control and
Prevention (CDC) collect, compile, analysis, and present data related to difference medical
conditions. These data is then made accessible to all individuals, groups, and agencies for the
purposes of their own independent research studies. The data is normally archived in a
chronological manner to ensure that trend analysis can be easily performed to identify whether or
not advancements in healthcare delivery have positively impacted the medical profession. As
such, the study of data relating to diseases is aimed at providing a realistic scope over the current
and past healthcare trends. Once this information is obtained it can be used by the proper
stakeholders to ensure that people of all races and gender are provided with quality healthcare
across all States in future. The formulation process for an effective healthcare reform plan
normally takes into account the opinions and suggestions of medical professionals, government
agencies, NGO representatives, and given members of society. In conclusion, the data will be
analyzed with the primary objective of assessing the impact of gender, and demographic on the
life expectancy and death rate in the United States of America3.
Material for Analysis
There are two sets of possess both quantitative and qualitative data that need to be
analyzed. One data set is centered on the evaluation of different disease causation, and deaths
across all 52 States over the past 16 years. The data is classified under six categories: year, 113
cause name, cause name, state, deaths, and age-adjusted death rate. There are over 15 disease
causes that are presented with regard to the 52 states. The figures for deaths and age adjusted
death rate associated with each disease are provided in a chronological manner starting from the
3 George A. F. Seber, and Alan J. Lee, Linear Regression Analysis (Hoboken: John Wiley &
Sons, 2012), 1–582.
Paraphrase This Document
Need a fresh take? Get an instant paraphrase of this document with our AI Paraphraser
First Name: 5
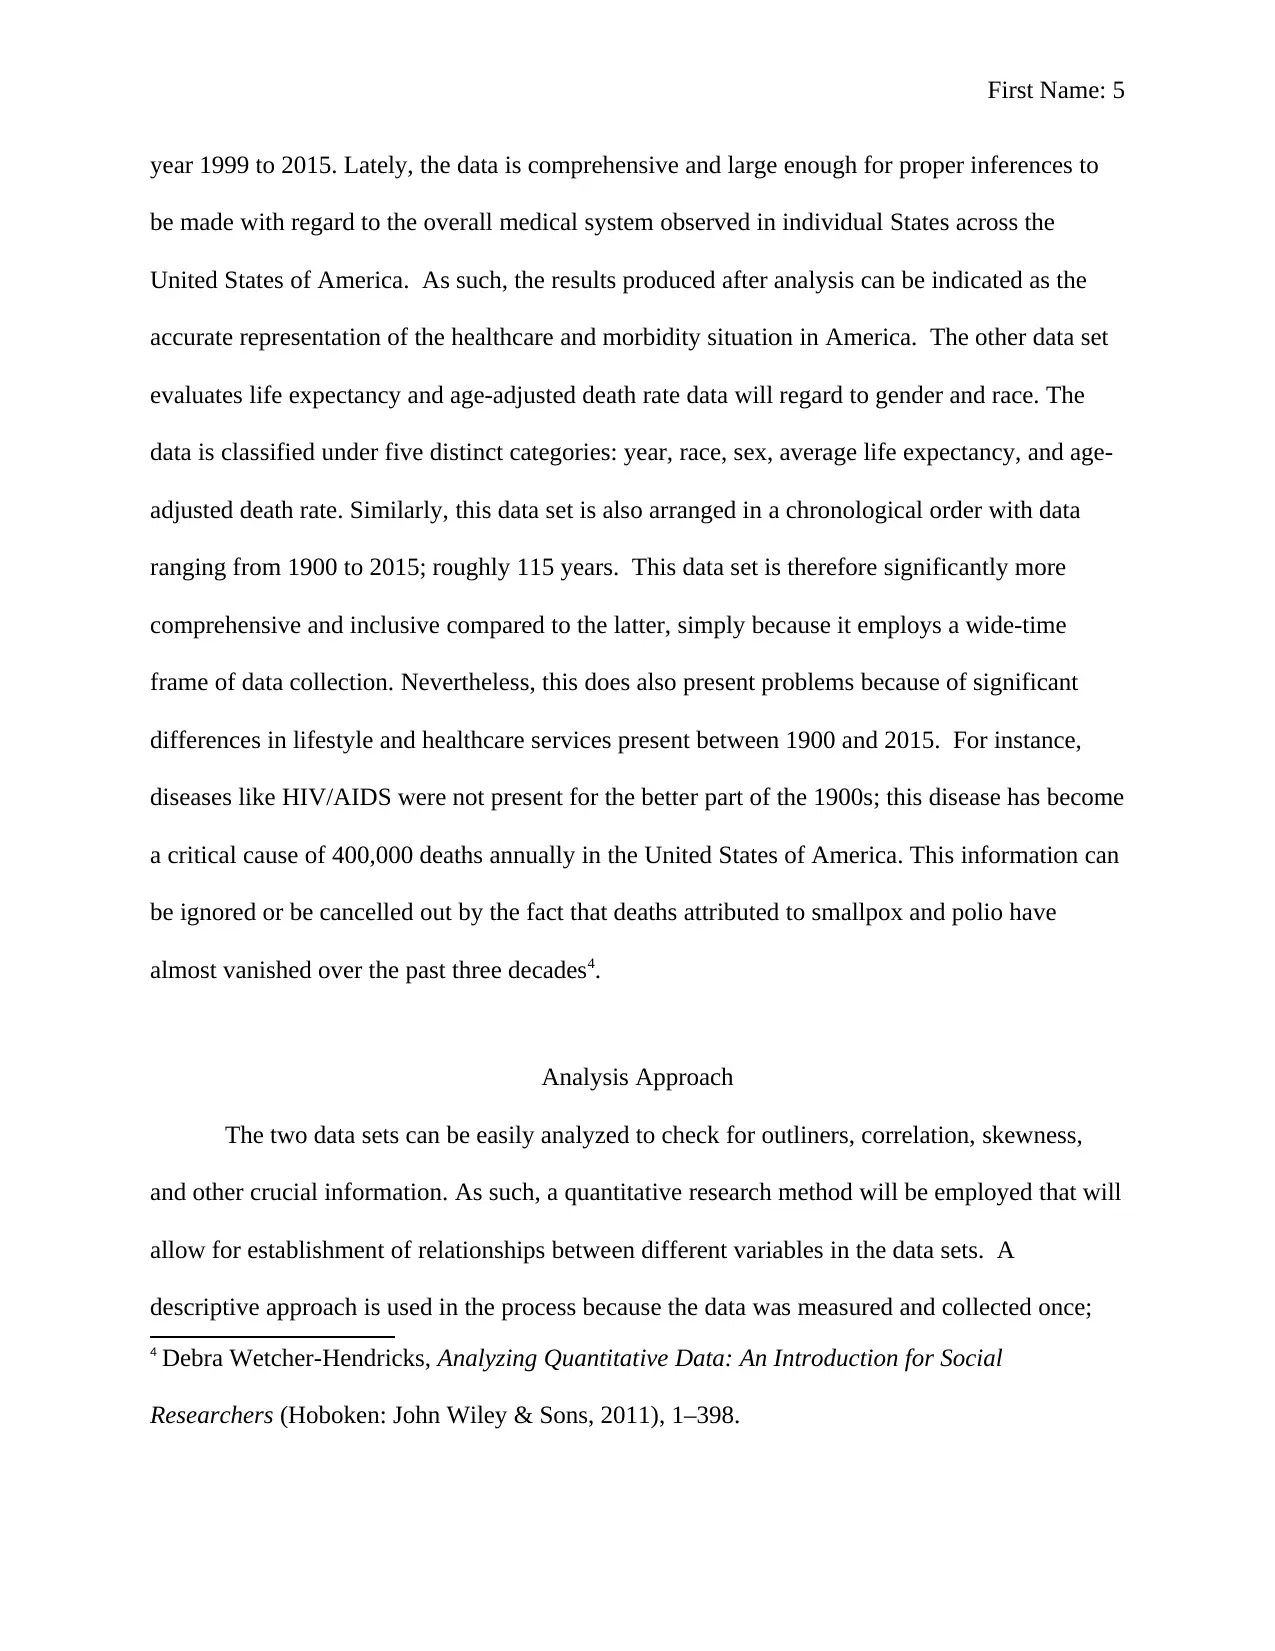
year 1999 to 2015. Lately, the data is comprehensive and large enough for proper inferences to
be made with regard to the overall medical system observed in individual States across the
United States of America. As such, the results produced after analysis can be indicated as the
accurate representation of the healthcare and morbidity situation in America. The other data set
evaluates life expectancy and age-adjusted death rate data will regard to gender and race. The
data is classified under five distinct categories: year, race, sex, average life expectancy, and age-
adjusted death rate. Similarly, this data set is also arranged in a chronological order with data
ranging from 1900 to 2015; roughly 115 years. This data set is therefore significantly more
comprehensive and inclusive compared to the latter, simply because it employs a wide-time
frame of data collection. Nevertheless, this does also present problems because of significant
differences in lifestyle and healthcare services present between 1900 and 2015. For instance,
diseases like HIV/AIDS were not present for the better part of the 1900s; this disease has become
a critical cause of 400,000 deaths annually in the United States of America. This information can
be ignored or be cancelled out by the fact that deaths attributed to smallpox and polio have
almost vanished over the past three decades4.
Analysis Approach
The two data sets can be easily analyzed to check for outliners, correlation, skewness,
and other crucial information. As such, a quantitative research method will be employed that will
allow for establishment of relationships between different variables in the data sets. A
descriptive approach is used in the process because the data was measured and collected once;
4 Debra Wetcher-Hendricks, Analyzing Quantitative Data: An Introduction for Social
Researchers (Hoboken: John Wiley & Sons, 2011), 1–398.
First Name: 6
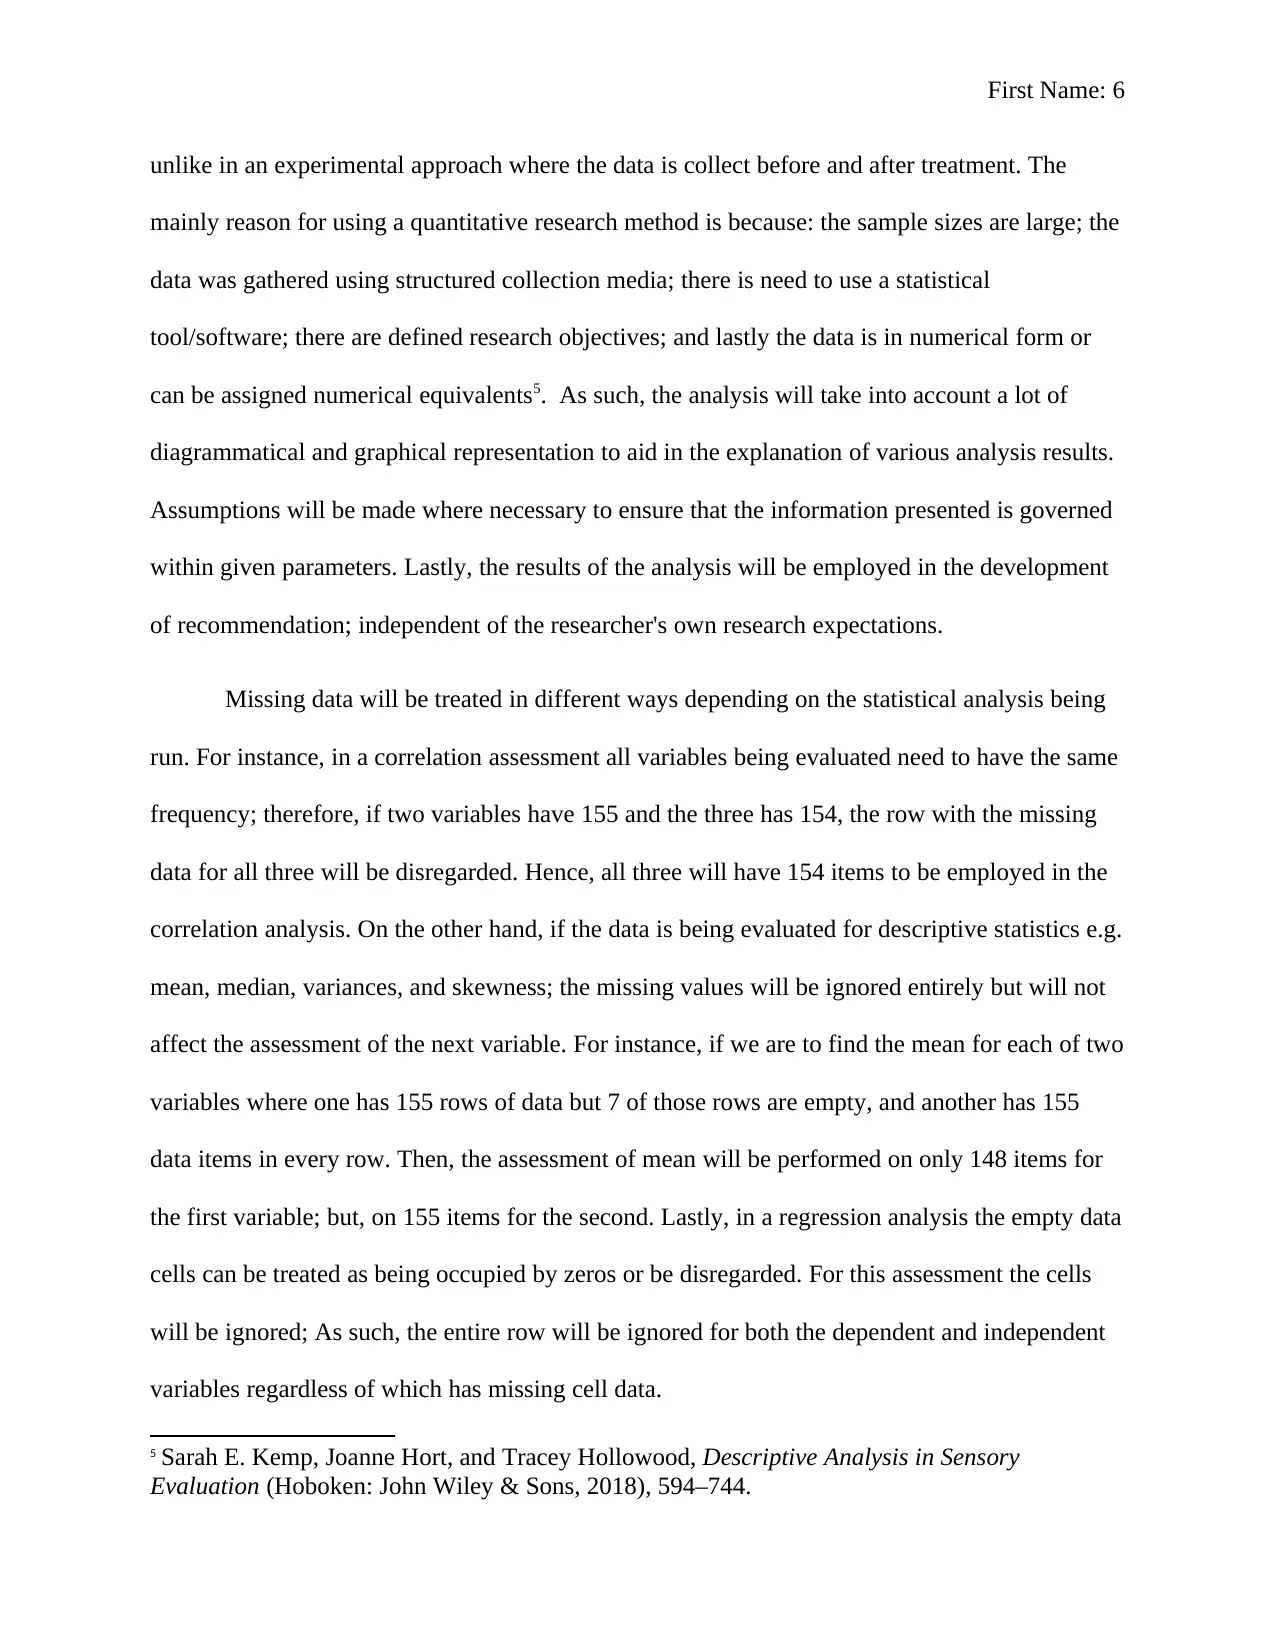
unlike in an experimental approach where the data is collect before and after treatment. The
mainly reason for using a quantitative research method is because: the sample sizes are large; the
data was gathered using structured collection media; there is need to use a statistical
tool/software; there are defined research objectives; and lastly the data is in numerical form or
can be assigned numerical equivalents5. As such, the analysis will take into account a lot of
diagrammatical and graphical representation to aid in the explanation of various analysis results.
Assumptions will be made where necessary to ensure that the information presented is governed
within given parameters. Lastly, the results of the analysis will be employed in the development
of recommendation; independent of the researcher's own research expectations.
Missing data will be treated in different ways depending on the statistical analysis being
run. For instance, in a correlation assessment all variables being evaluated need to have the same
frequency; therefore, if two variables have 155 and the three has 154, the row with the missing
data for all three will be disregarded. Hence, all three will have 154 items to be employed in the
correlation analysis. On the other hand, if the data is being evaluated for descriptive statistics e.g.
mean, median, variances, and skewness; the missing values will be ignored entirely but will not
affect the assessment of the next variable. For instance, if we are to find the mean for each of two
variables where one has 155 rows of data but 7 of those rows are empty, and another has 155
data items in every row. Then, the assessment of mean will be performed on only 148 items for
the first variable; but, on 155 items for the second. Lastly, in a regression analysis the empty data
cells can be treated as being occupied by zeros or be disregarded. For this assessment the cells
will be ignored; As such, the entire row will be ignored for both the dependent and independent
variables regardless of which has missing cell data.
5 Sarah E. Kemp, Joanne Hort, and Tracey Hollowood, Descriptive Analysis in Sensory
Evaluation (Hoboken: John Wiley & Sons, 2018), 594–744.
⊘ This is a preview!⊘
Do you want full access?
Subscribe today to unlock all pages.
Trusted by 1+ million students worldwide
First Name: 7
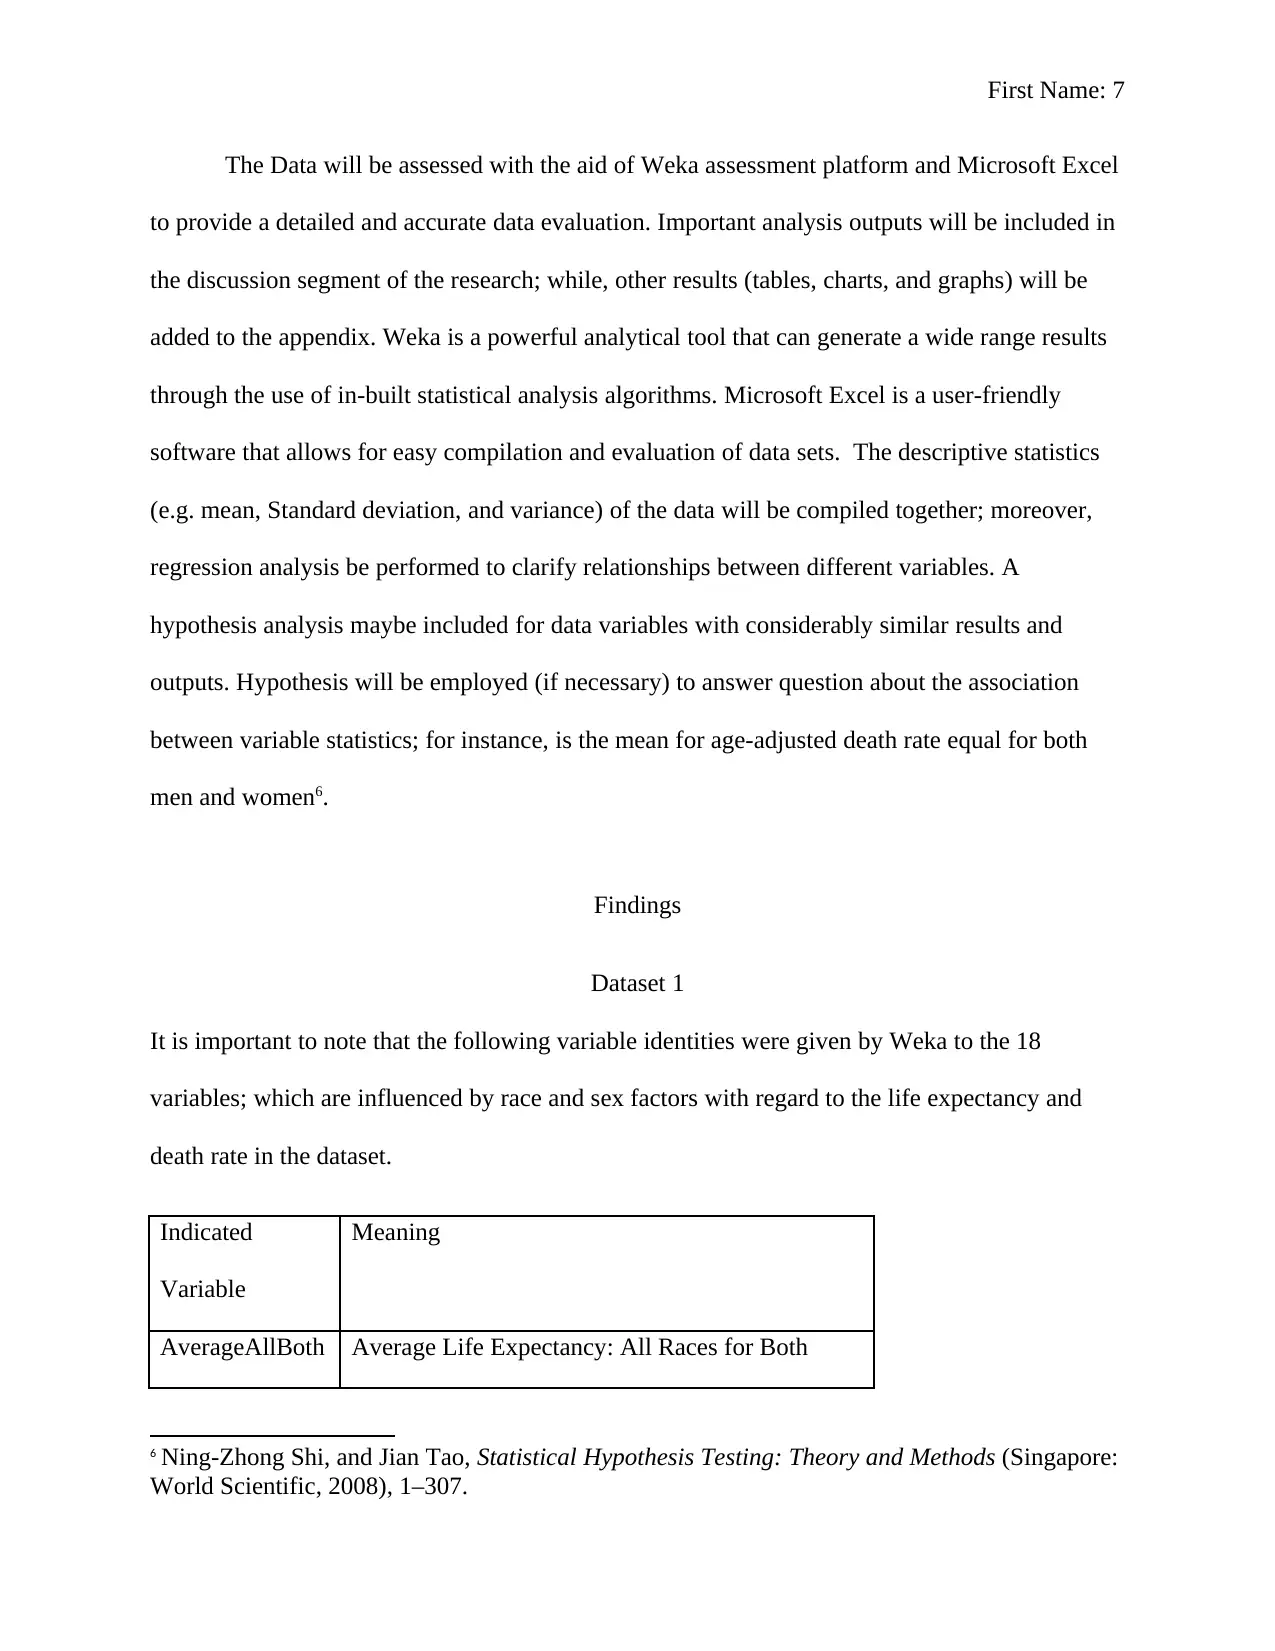
The Data will be assessed with the aid of Weka assessment platform and Microsoft Excel
to provide a detailed and accurate data evaluation. Important analysis outputs will be included in
the discussion segment of the research; while, other results (tables, charts, and graphs) will be
added to the appendix. Weka is a powerful analytical tool that can generate a wide range results
through the use of in-built statistical analysis algorithms. Microsoft Excel is a user-friendly
software that allows for easy compilation and evaluation of data sets. The descriptive statistics
(e.g. mean, Standard deviation, and variance) of the data will be compiled together; moreover,
regression analysis be performed to clarify relationships between different variables. A
hypothesis analysis maybe included for data variables with considerably similar results and
outputs. Hypothesis will be employed (if necessary) to answer question about the association
between variable statistics; for instance, is the mean for age-adjusted death rate equal for both
men and women6.
Findings
Dataset 1
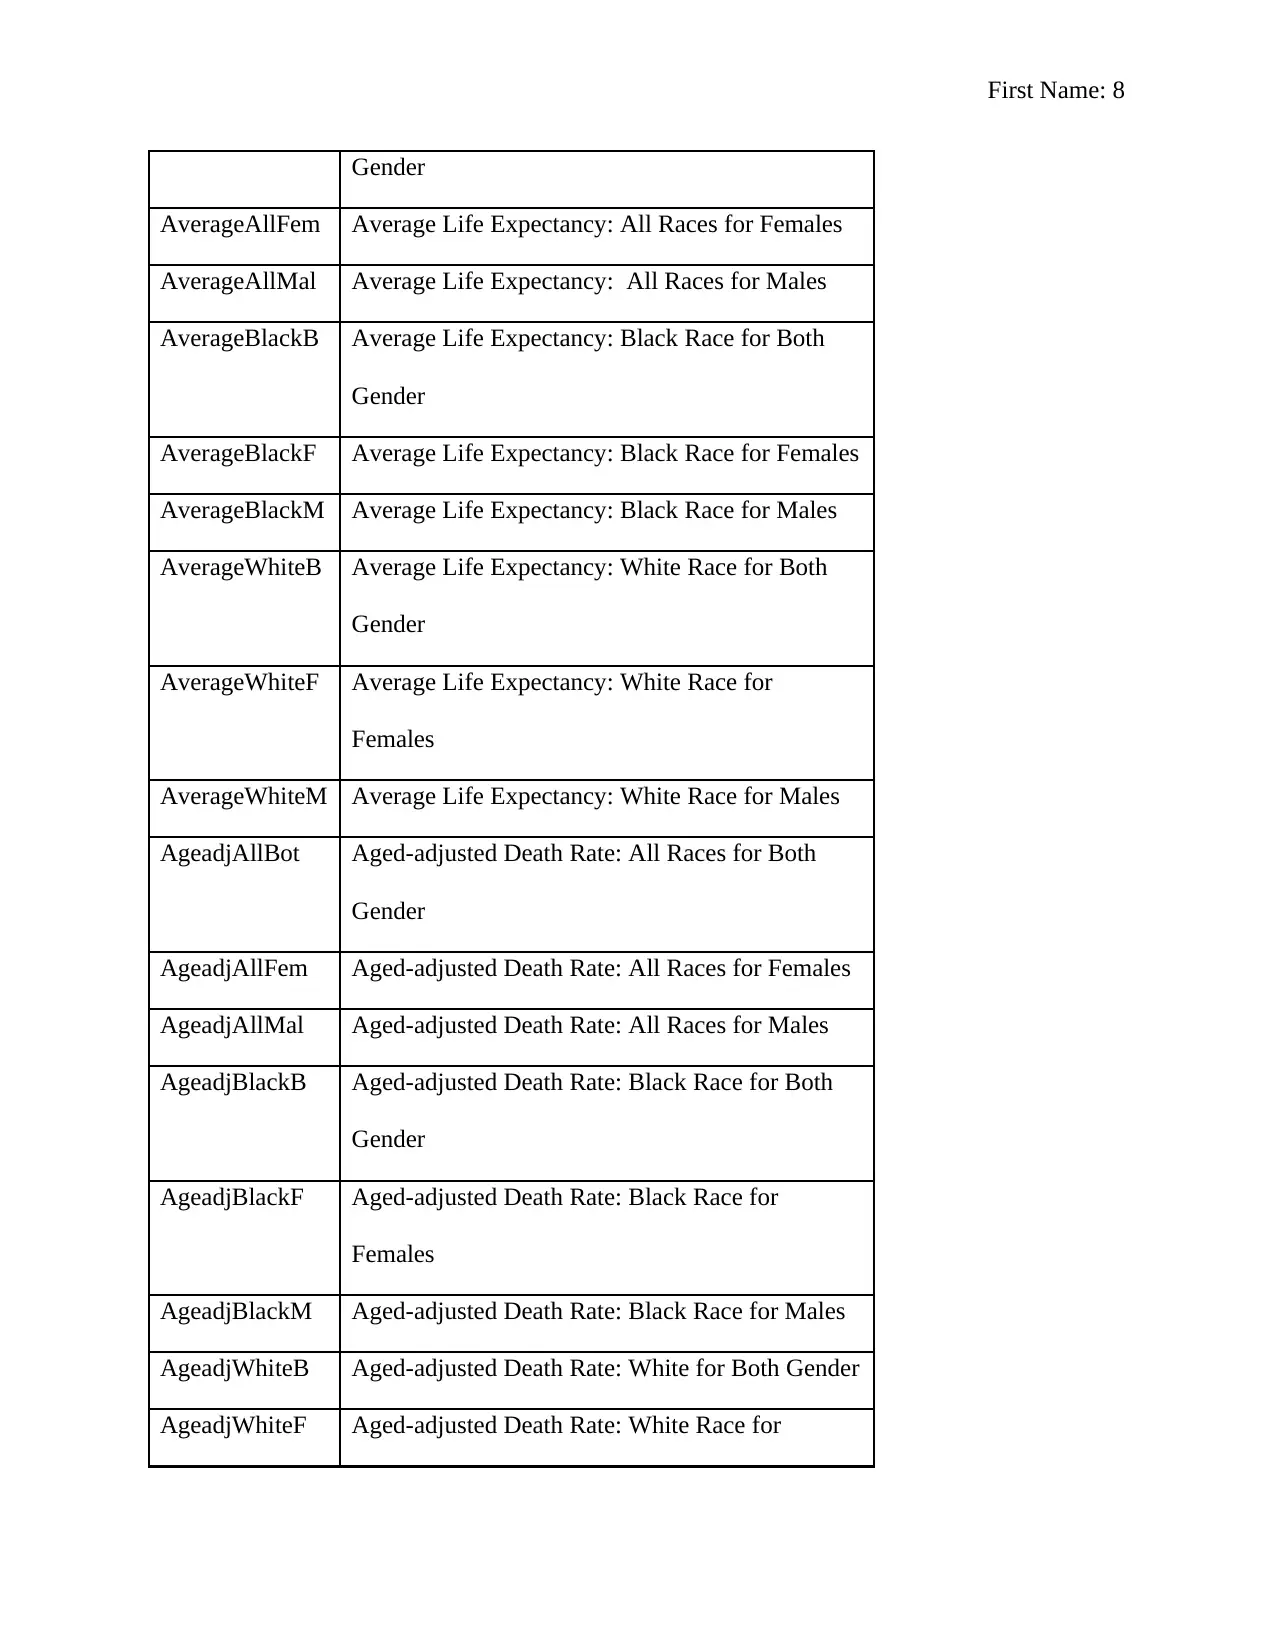
It is important to note that the following variable identities were given by Weka to the 18
variables; which are influenced by race and sex factors with regard to the life expectancy and
death rate in the dataset.
Indicated
Variable
Meaning
AverageAllBoth Average Life Expectancy: All Races for Both
6 Ning-Zhong Shi, and Jian Tao, Statistical Hypothesis Testing: Theory and Methods (Singapore:
World Scientific, 2008), 1–307.
The Data will be assessed with the aid of Weka assessment platform and Microsoft Excel
to provide a detailed and accurate data evaluation. Important analysis outputs will be included in
the discussion segment of the research; while, other results (tables, charts, and graphs) will be
added to the appendix. Weka is a powerful analytical tool that can generate a wide range results
through the use of in-built statistical analysis algorithms. Microsoft Excel is a user-friendly
software that allows for easy compilation and evaluation of data sets. The descriptive statistics
(e.g. mean, Standard deviation, and variance) of the data will be compiled together; moreover,
regression analysis be performed to clarify relationships between different variables. A
hypothesis analysis maybe included for data variables with considerably similar results and
outputs. Hypothesis will be employed (if necessary) to answer question about the association
between variable statistics; for instance, is the mean for age-adjusted death rate equal for both
men and women6.
Findings
Dataset 1
It is important to note that the following variable identities were given by Weka to the 18
variables; which are influenced by race and sex factors with regard to the life expectancy and
death rate in the dataset.
Indicated
Variable
Meaning
AverageAllBoth Average Life Expectancy: All Races for Both
6 Ning-Zhong Shi, and Jian Tao, Statistical Hypothesis Testing: Theory and Methods (Singapore:
World Scientific, 2008), 1–307.
Paraphrase This Document
Need a fresh take? Get an instant paraphrase of this document with our AI Paraphraser
First Name: 8
Gender
AverageAllFem Average Life Expectancy: All Races for Females
AverageAllMal Average Life Expectancy: All Races for Males
AverageBlackB Average Life Expectancy: Black Race for Both
Gender
AverageBlackF Average Life Expectancy: Black Race for Females
AverageBlackM Average Life Expectancy: Black Race for Males
AverageWhiteB Average Life Expectancy: White Race for Both
Gender
AverageWhiteF Average Life Expectancy: White Race for
Females
AverageWhiteM Average Life Expectancy: White Race for Males
AgeadjAllBot Aged-adjusted Death Rate: All Races for Both
Gender
AgeadjAllFem Aged-adjusted Death Rate: All Races for Females
AgeadjAllMal Aged-adjusted Death Rate: All Races for Males
AgeadjBlackB Aged-adjusted Death Rate: Black Race for Both
Gender
AgeadjBlackF Aged-adjusted Death Rate: Black Race for
Females
AgeadjBlackM Aged-adjusted Death Rate: Black Race for Males
AgeadjWhiteB Aged-adjusted Death Rate: White for Both Gender
AgeadjWhiteF Aged-adjusted Death Rate: White Race for
Gender
AverageAllFem Average Life Expectancy: All Races for Females
AverageAllMal Average Life Expectancy: All Races for Males
AverageBlackB Average Life Expectancy: Black Race for Both
Gender
AverageBlackF Average Life Expectancy: Black Race for Females
AverageBlackM Average Life Expectancy: Black Race for Males
AverageWhiteB Average Life Expectancy: White Race for Both
Gender
AverageWhiteF Average Life Expectancy: White Race for
Females
AverageWhiteM Average Life Expectancy: White Race for Males
AgeadjAllBot Aged-adjusted Death Rate: All Races for Both
Gender
AgeadjAllFem Aged-adjusted Death Rate: All Races for Females
AgeadjAllMal Aged-adjusted Death Rate: All Races for Males
AgeadjBlackB Aged-adjusted Death Rate: Black Race for Both
Gender
AgeadjBlackF Aged-adjusted Death Rate: Black Race for
Females
AgeadjBlackM Aged-adjusted Death Rate: Black Race for Males
AgeadjWhiteB Aged-adjusted Death Rate: White for Both Gender
AgeadjWhiteF Aged-adjusted Death Rate: White Race for
First Name: 9
Females
AgeadjWhiteM Aged-adjusted Death Rate: White Race for Males
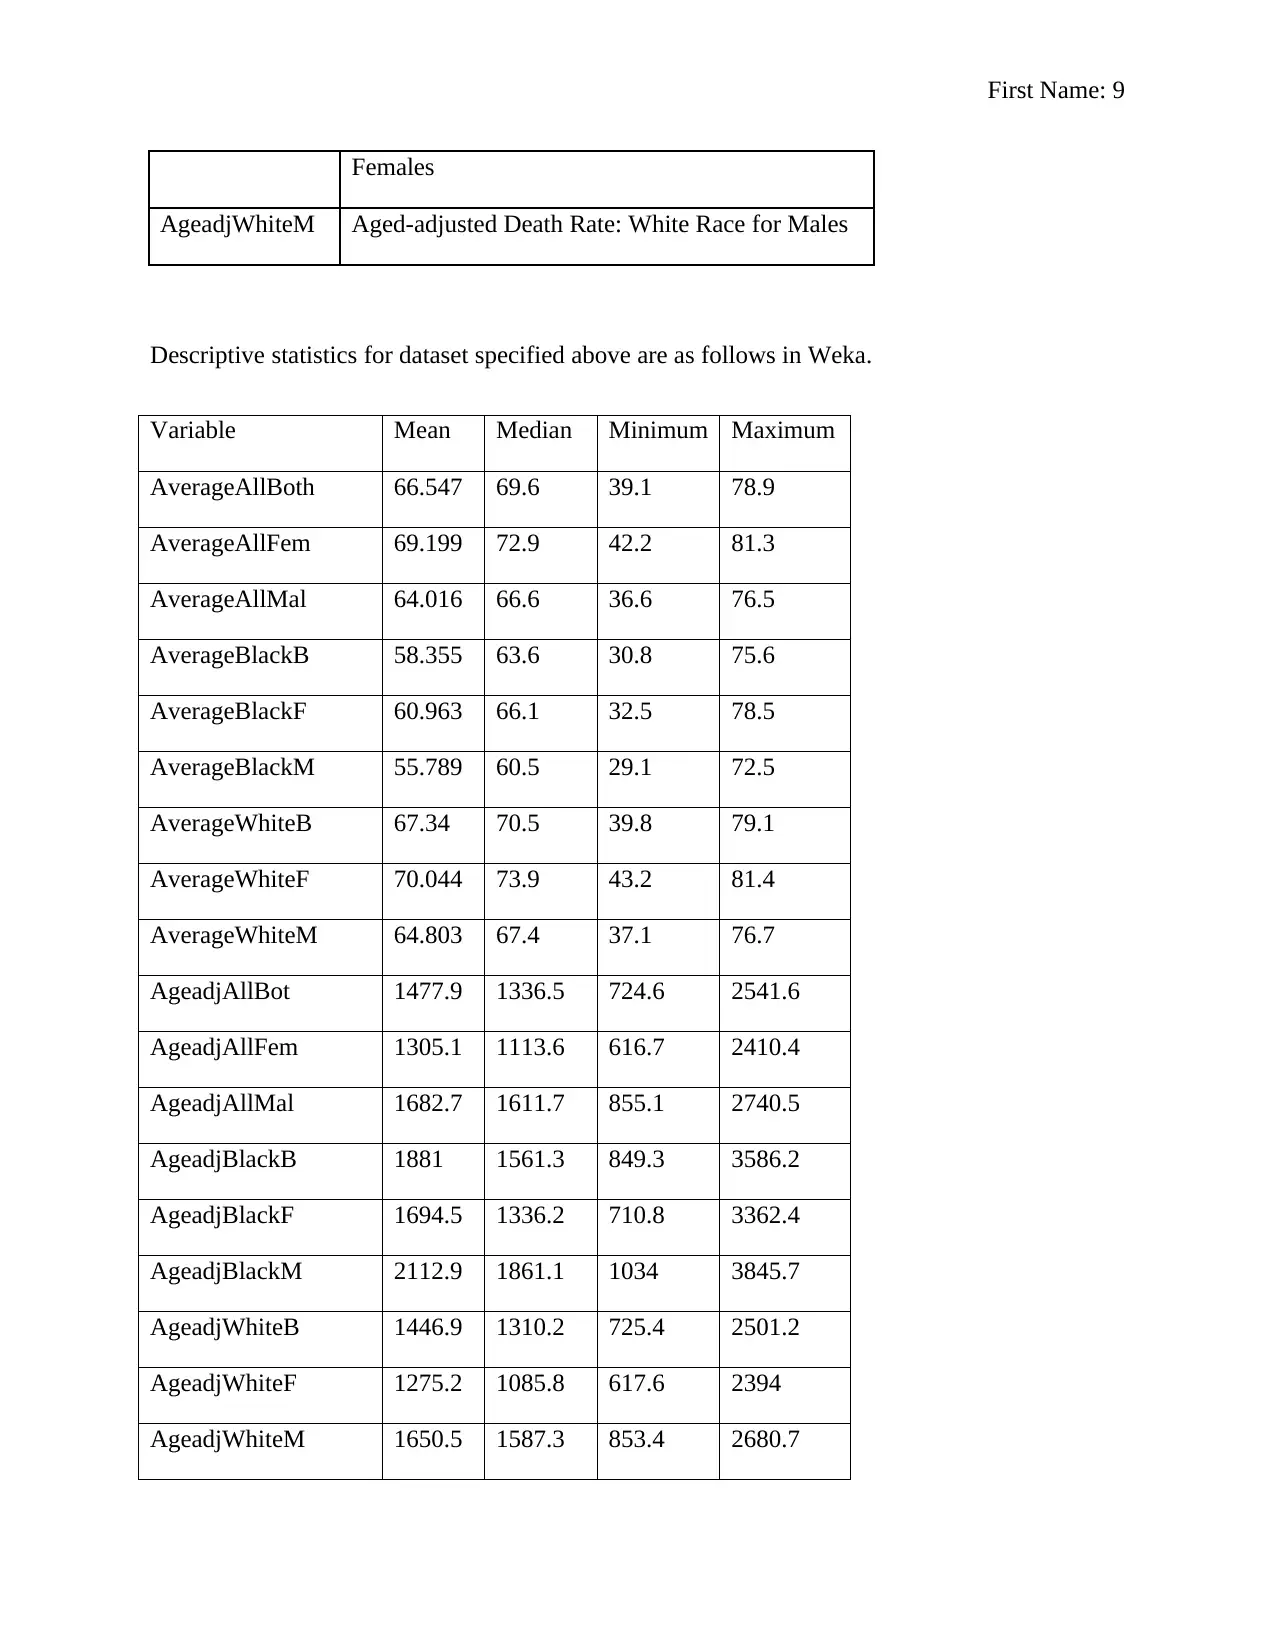
Descriptive statistics for dataset specified above are as follows in Weka.
Variable Mean Median Minimum Maximum
AverageAllBoth 66.547 69.6 39.1 78.9
AverageAllFem 69.199 72.9 42.2 81.3
AverageAllMal 64.016 66.6 36.6 76.5
AverageBlackB 58.355 63.6 30.8 75.6
AverageBlackF 60.963 66.1 32.5 78.5
AverageBlackM 55.789 60.5 29.1 72.5
AverageWhiteB 67.34 70.5 39.8 79.1
AverageWhiteF 70.044 73.9 43.2 81.4
AverageWhiteM 64.803 67.4 37.1 76.7
AgeadjAllBot 1477.9 1336.5 724.6 2541.6
AgeadjAllFem 1305.1 1113.6 616.7 2410.4
AgeadjAllMal 1682.7 1611.7 855.1 2740.5
AgeadjBlackB 1881 1561.3 849.3 3586.2
AgeadjBlackF 1694.5 1336.2 710.8 3362.4
AgeadjBlackM 2112.9 1861.1 1034 3845.7
AgeadjWhiteB 1446.9 1310.2 725.4 2501.2
AgeadjWhiteF 1275.2 1085.8 617.6 2394
AgeadjWhiteM 1650.5 1587.3 853.4 2680.7
Females
AgeadjWhiteM Aged-adjusted Death Rate: White Race for Males
Descriptive statistics for dataset specified above are as follows in Weka.
Variable Mean Median Minimum Maximum
AverageAllBoth 66.547 69.6 39.1 78.9
AverageAllFem 69.199 72.9 42.2 81.3
AverageAllMal 64.016 66.6 36.6 76.5
AverageBlackB 58.355 63.6 30.8 75.6
AverageBlackF 60.963 66.1 32.5 78.5
AverageBlackM 55.789 60.5 29.1 72.5
AverageWhiteB 67.34 70.5 39.8 79.1
AverageWhiteF 70.044 73.9 43.2 81.4
AverageWhiteM 64.803 67.4 37.1 76.7
AgeadjAllBot 1477.9 1336.5 724.6 2541.6
AgeadjAllFem 1305.1 1113.6 616.7 2410.4
AgeadjAllMal 1682.7 1611.7 855.1 2740.5
AgeadjBlackB 1881 1561.3 849.3 3586.2
AgeadjBlackF 1694.5 1336.2 710.8 3362.4
AgeadjBlackM 2112.9 1861.1 1034 3845.7
AgeadjWhiteB 1446.9 1310.2 725.4 2501.2
AgeadjWhiteF 1275.2 1085.8 617.6 2394
AgeadjWhiteM 1650.5 1587.3 853.4 2680.7
⊘ This is a preview!⊘
Do you want full access?
Subscribe today to unlock all pages.
Trusted by 1+ million students worldwide
First Name: 10
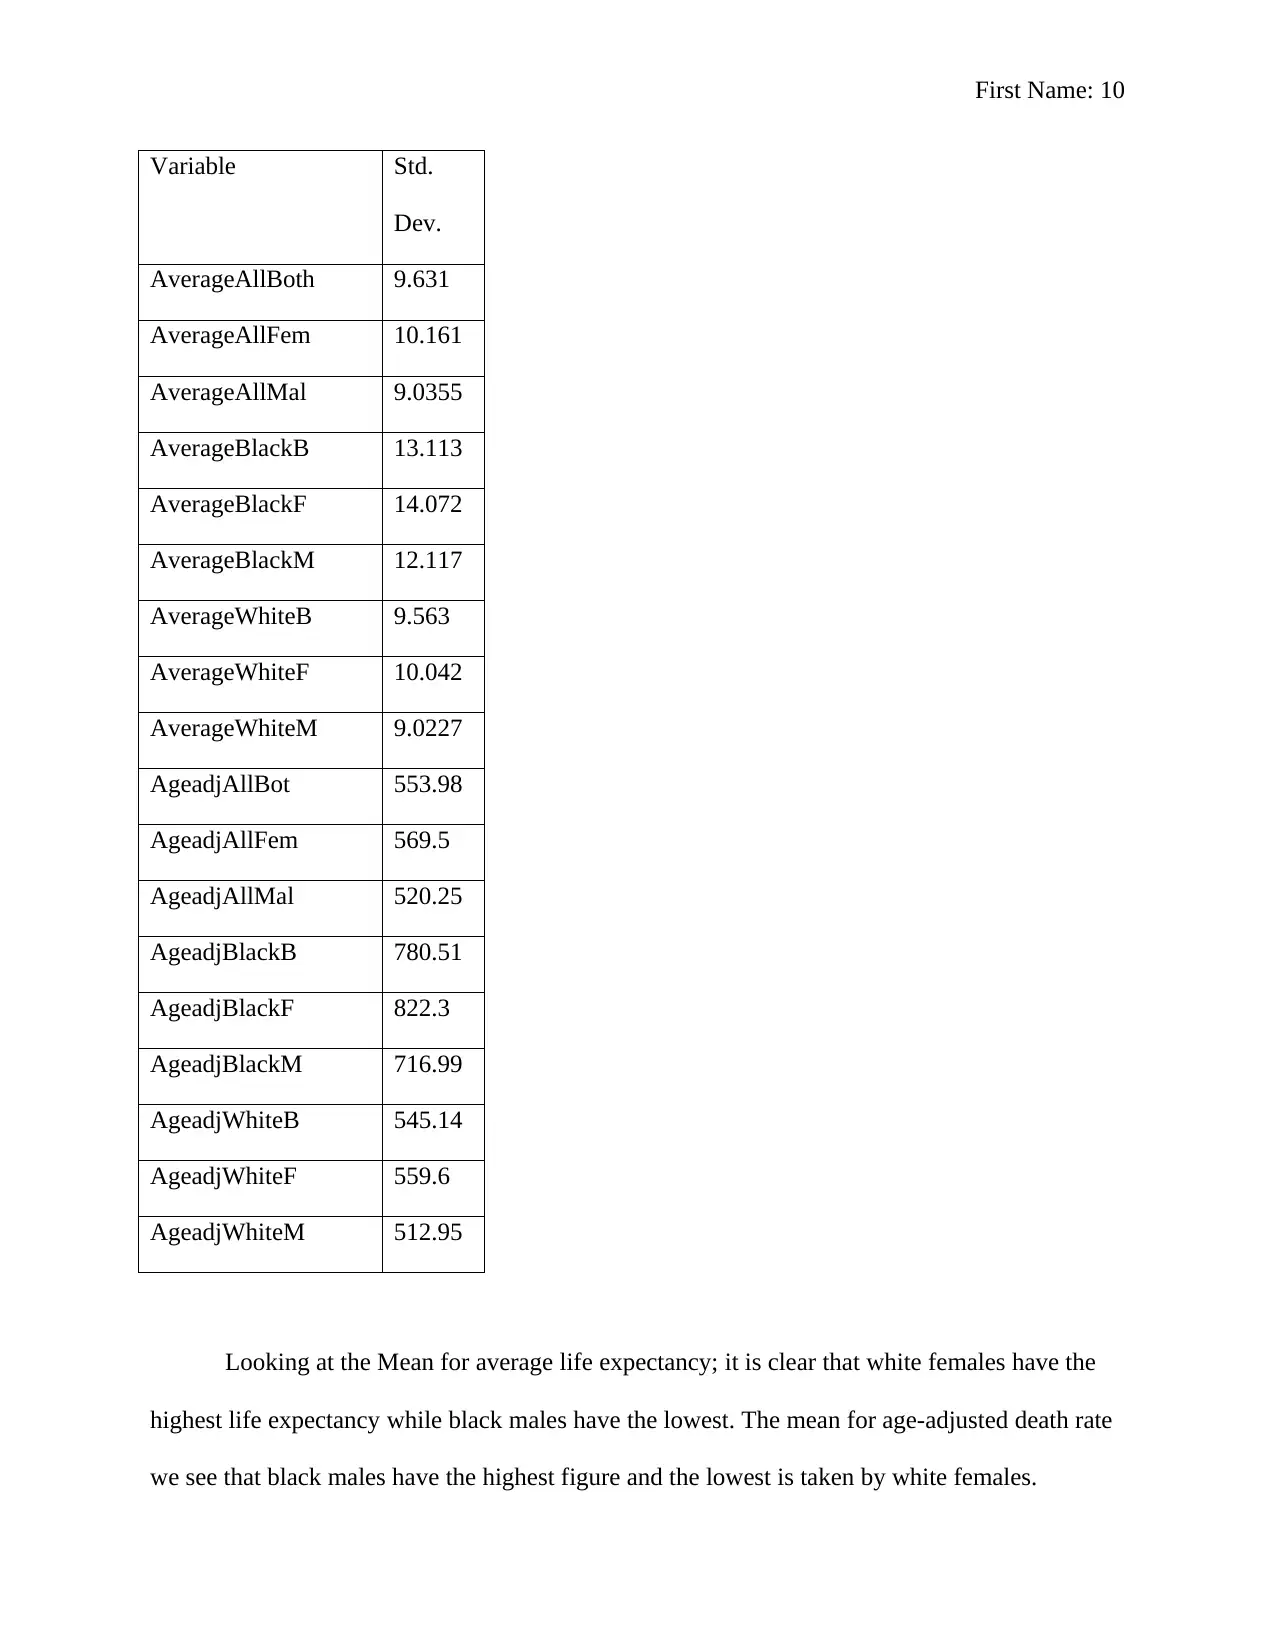
Variable Std.
Dev.
AverageAllBoth 9.631
AverageAllFem 10.161
AverageAllMal 9.0355
AverageBlackB 13.113
AverageBlackF 14.072
AverageBlackM 12.117
AverageWhiteB 9.563
AverageWhiteF 10.042
AverageWhiteM 9.0227
AgeadjAllBot 553.98
AgeadjAllFem 569.5
AgeadjAllMal 520.25
AgeadjBlackB 780.51
AgeadjBlackF 822.3
AgeadjBlackM 716.99
AgeadjWhiteB 545.14
AgeadjWhiteF 559.6
AgeadjWhiteM 512.95
Looking at the Mean for average life expectancy; it is clear that white females have the
highest life expectancy while black males have the lowest. The mean for age-adjusted death rate
we see that black males have the highest figure and the lowest is taken by white females.
Paraphrase This Document
Need a fresh take? Get an instant paraphrase of this document with our AI Paraphraser
First Name: 11
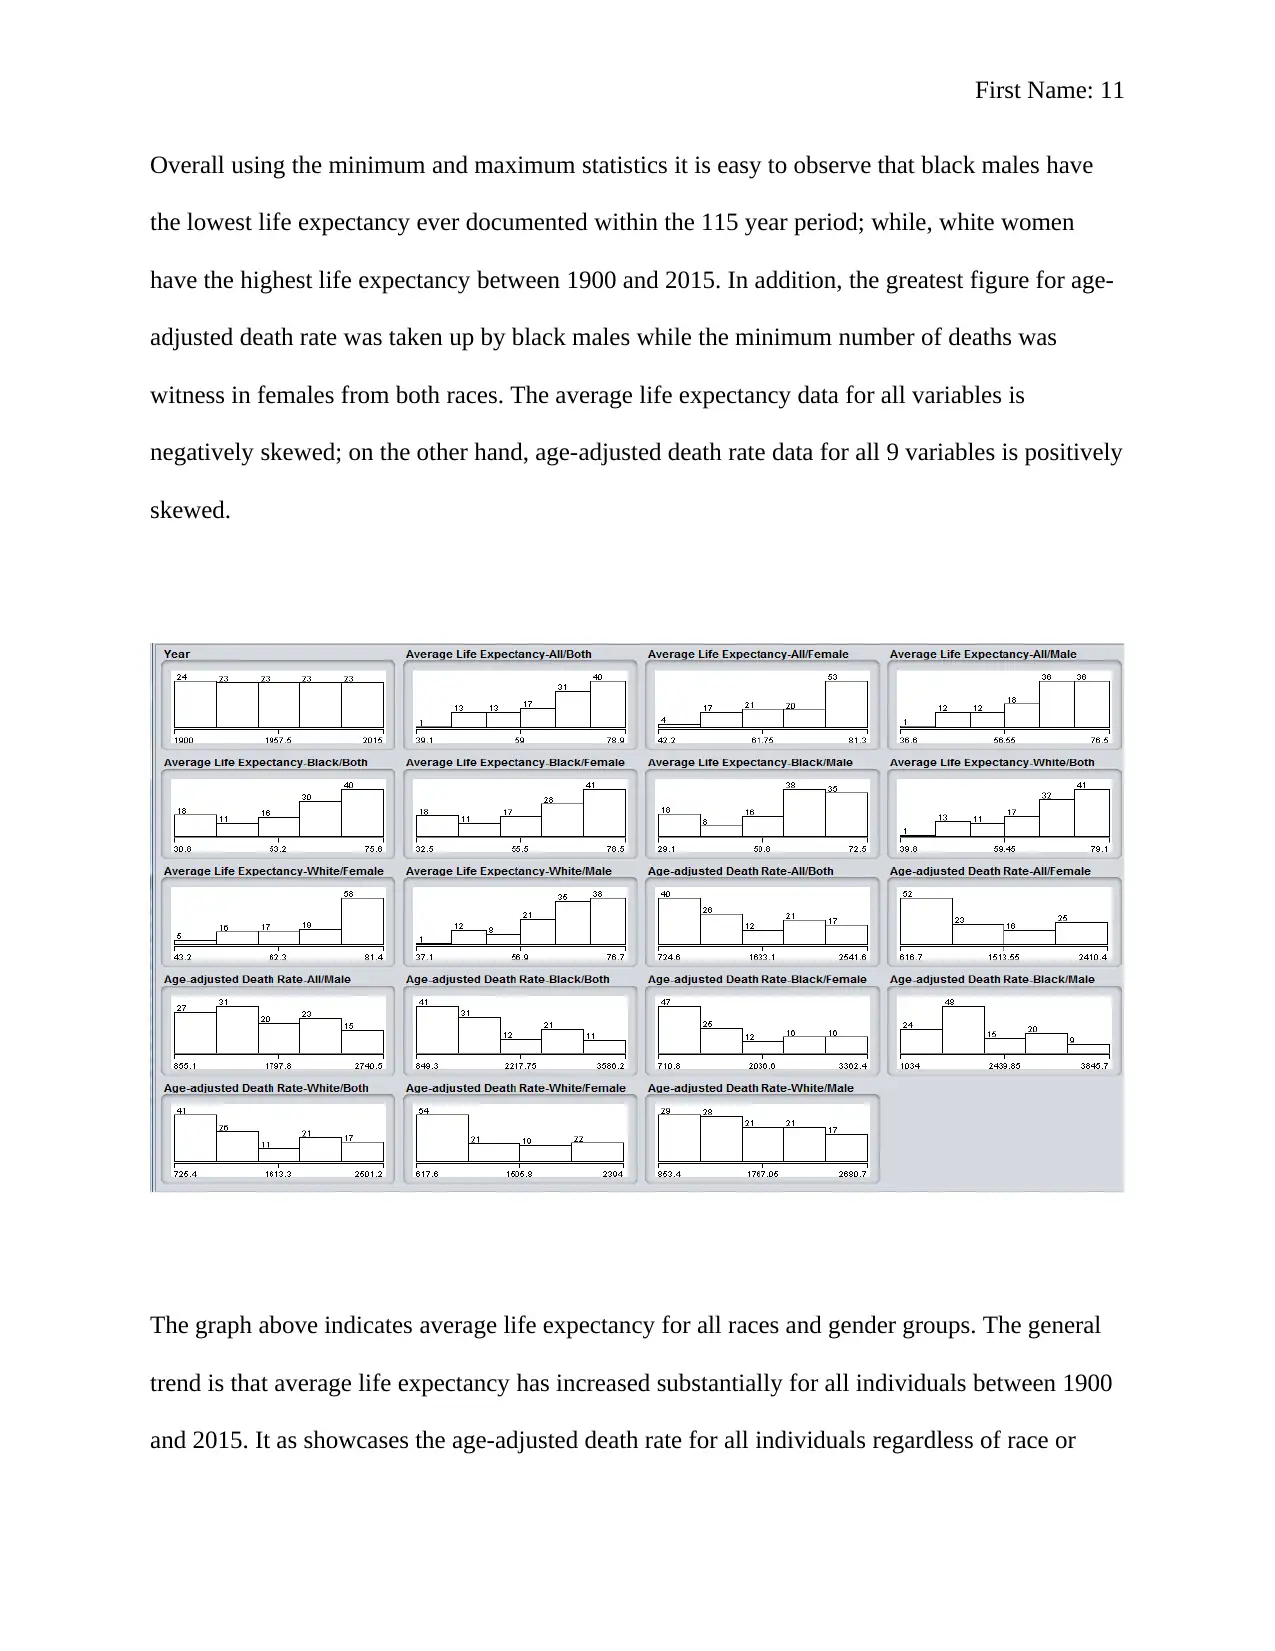
Overall using the minimum and maximum statistics it is easy to observe that black males have
the lowest life expectancy ever documented within the 115 year period; while, white women
have the highest life expectancy between 1900 and 2015. In addition, the greatest figure for age-
adjusted death rate was taken up by black males while the minimum number of deaths was
witness in females from both races. The average life expectancy data for all variables is
negatively skewed; on the other hand, age-adjusted death rate data for all 9 variables is positively
skewed.
The graph above indicates average life expectancy for all races and gender groups. The general
trend is that average life expectancy has increased substantially for all individuals between 1900
and 2015. It as showcases the age-adjusted death rate for all individuals regardless of race or
First Name: 12
gender. The overall feel in the movement of the lines indicates that age-adjusted death rate has
decrease significantly over the past 115 year for all race and both gender groups.
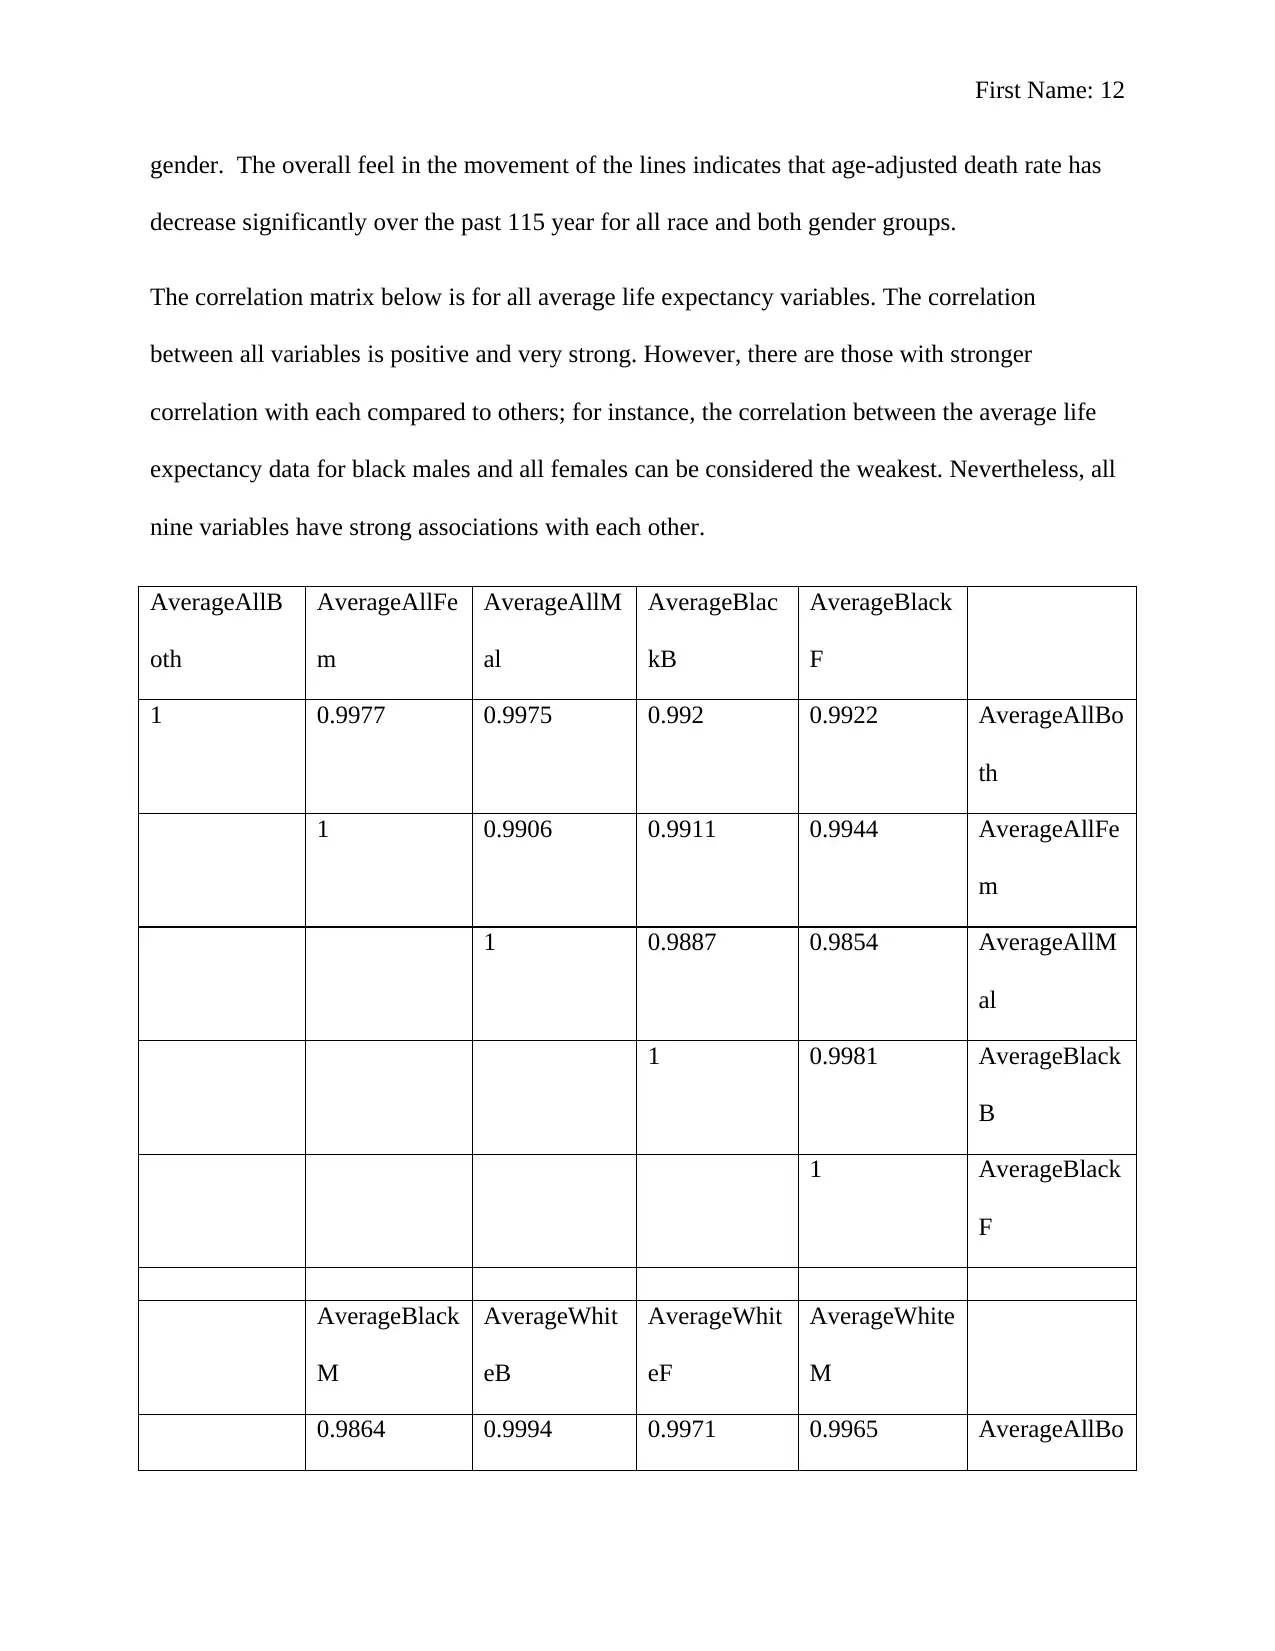
The correlation matrix below is for all average life expectancy variables. The correlation
between all variables is positive and very strong. However, there are those with stronger
correlation with each compared to others; for instance, the correlation between the average life
expectancy data for black males and all females can be considered the weakest. Nevertheless, all
nine variables have strong associations with each other.
AverageAllB
oth
AverageAllFe
m
AverageAllM
al
AverageBlac
kB
AverageBlack
F
1 0.9977 0.9975 0.992 0.9922 AverageAllBo
th
1 0.9906 0.9911 0.9944 AverageAllFe
m
1 0.9887 0.9854 AverageAllM
al
1 0.9981 AverageBlack
B
1 AverageBlack
F
AverageBlack
M
AverageWhit
eB
AverageWhit
eF
AverageWhite
M
0.9864 0.9994 0.9971 0.9965 AverageAllBo
gender. The overall feel in the movement of the lines indicates that age-adjusted death rate has
decrease significantly over the past 115 year for all race and both gender groups.
The correlation matrix below is for all average life expectancy variables. The correlation
between all variables is positive and very strong. However, there are those with stronger
correlation with each compared to others; for instance, the correlation between the average life
expectancy data for black males and all females can be considered the weakest. Nevertheless, all
nine variables have strong associations with each other.
AverageAllB
oth
AverageAllFe
m
AverageAllM
al
AverageBlac
kB
AverageBlack
F
1 0.9977 0.9975 0.992 0.9922 AverageAllBo
th
1 0.9906 0.9911 0.9944 AverageAllFe
m
1 0.9887 0.9854 AverageAllM
al
1 0.9981 AverageBlack
B
1 AverageBlack
F
AverageBlack
M
AverageWhit
eB
AverageWhit
eF
AverageWhite
M
0.9864 0.9994 0.9971 0.9965 AverageAllBo
⊘ This is a preview!⊘
Do you want full access?
Subscribe today to unlock all pages.
Trusted by 1+ million students worldwide
1 out of 31
Related Documents


Your All-in-One AI-Powered Toolkit for Academic Success.
+13062052269
info@desklib.com
Available 24*7 on WhatsApp / Email
![[object Object]](/_next/static/media/star-bottom.7253800d.svg)
Unlock your academic potential
Copyright © 2020–2026 A2Z Services. All Rights Reserved. Developed and managed by ZUCOL.