University Business Analytics: Data Analysis & Decision Making Lab 1
VerifiedAdded on 2023/04/21
|13
|800
|52
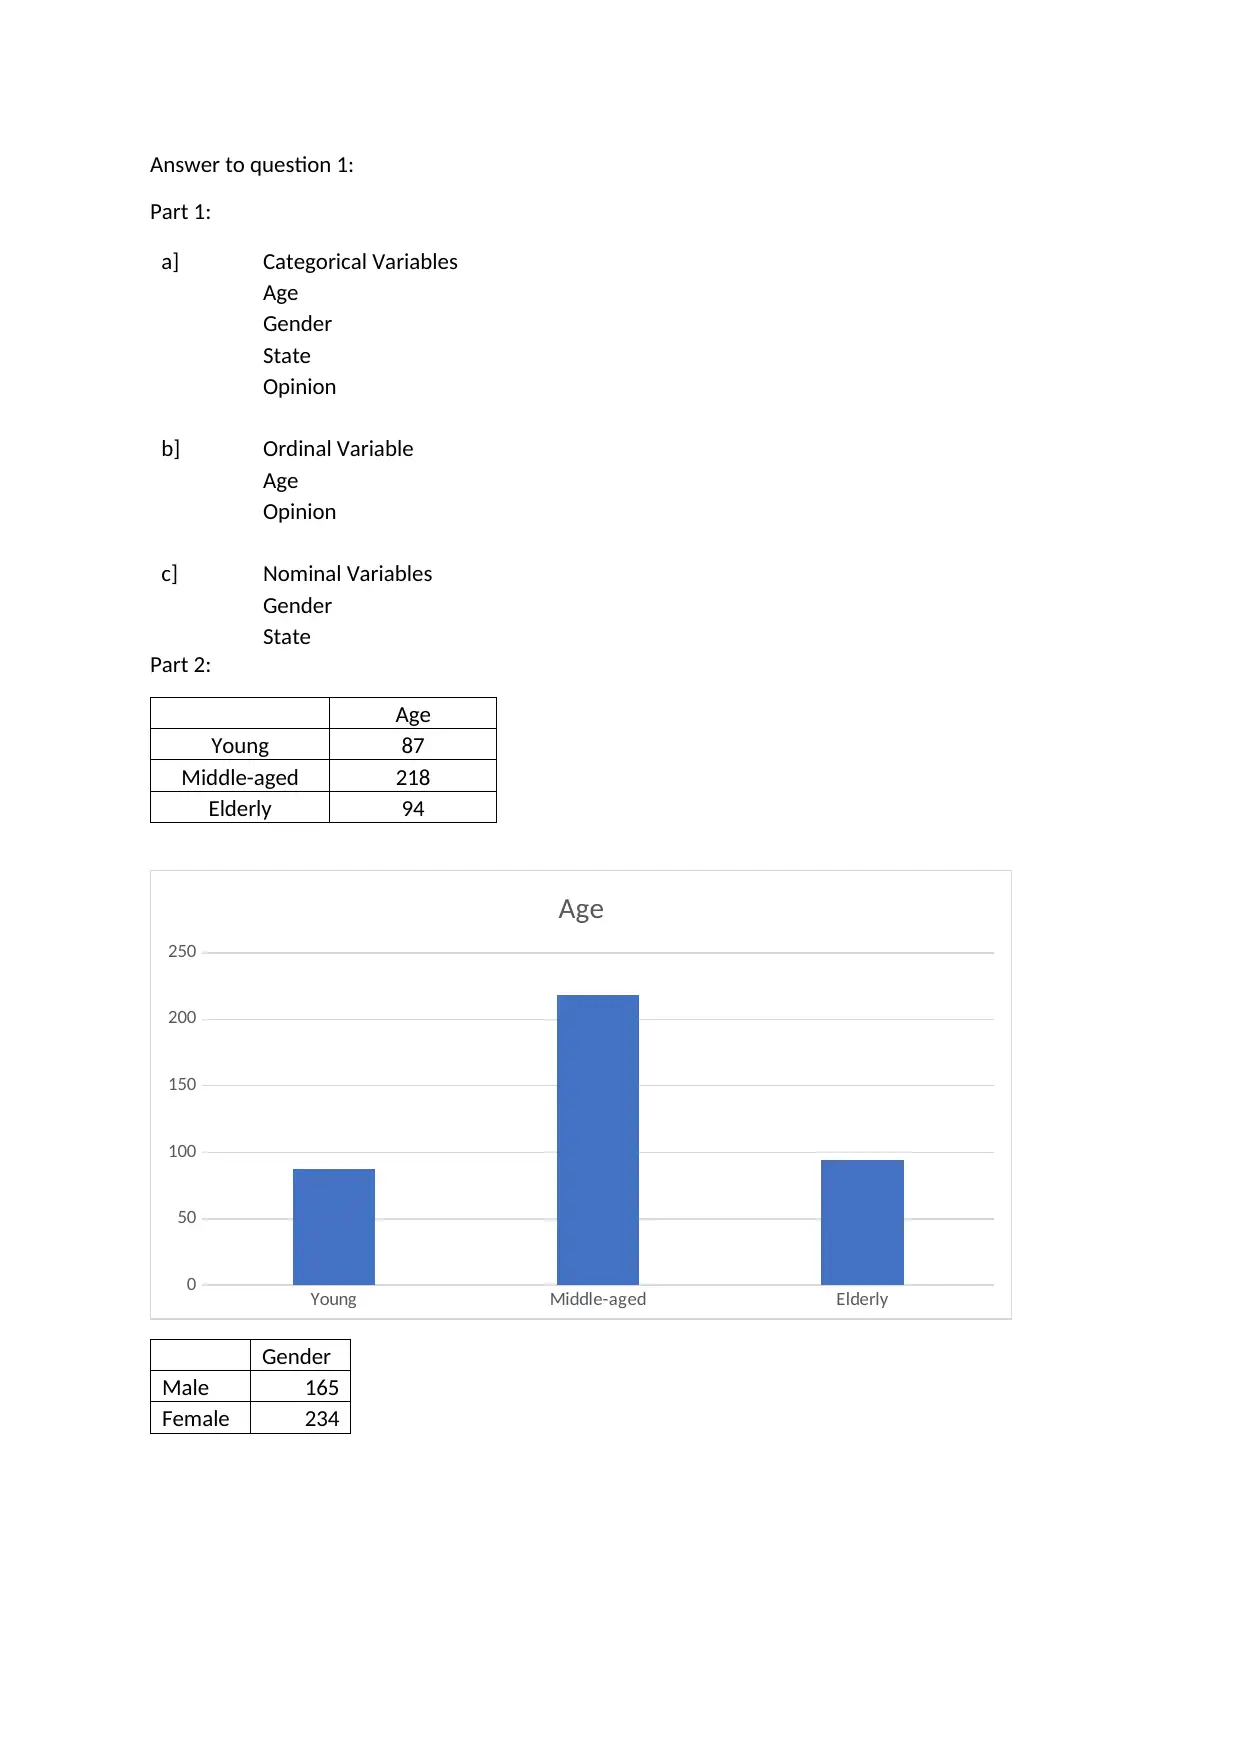
Homework Assignment
AI Summary
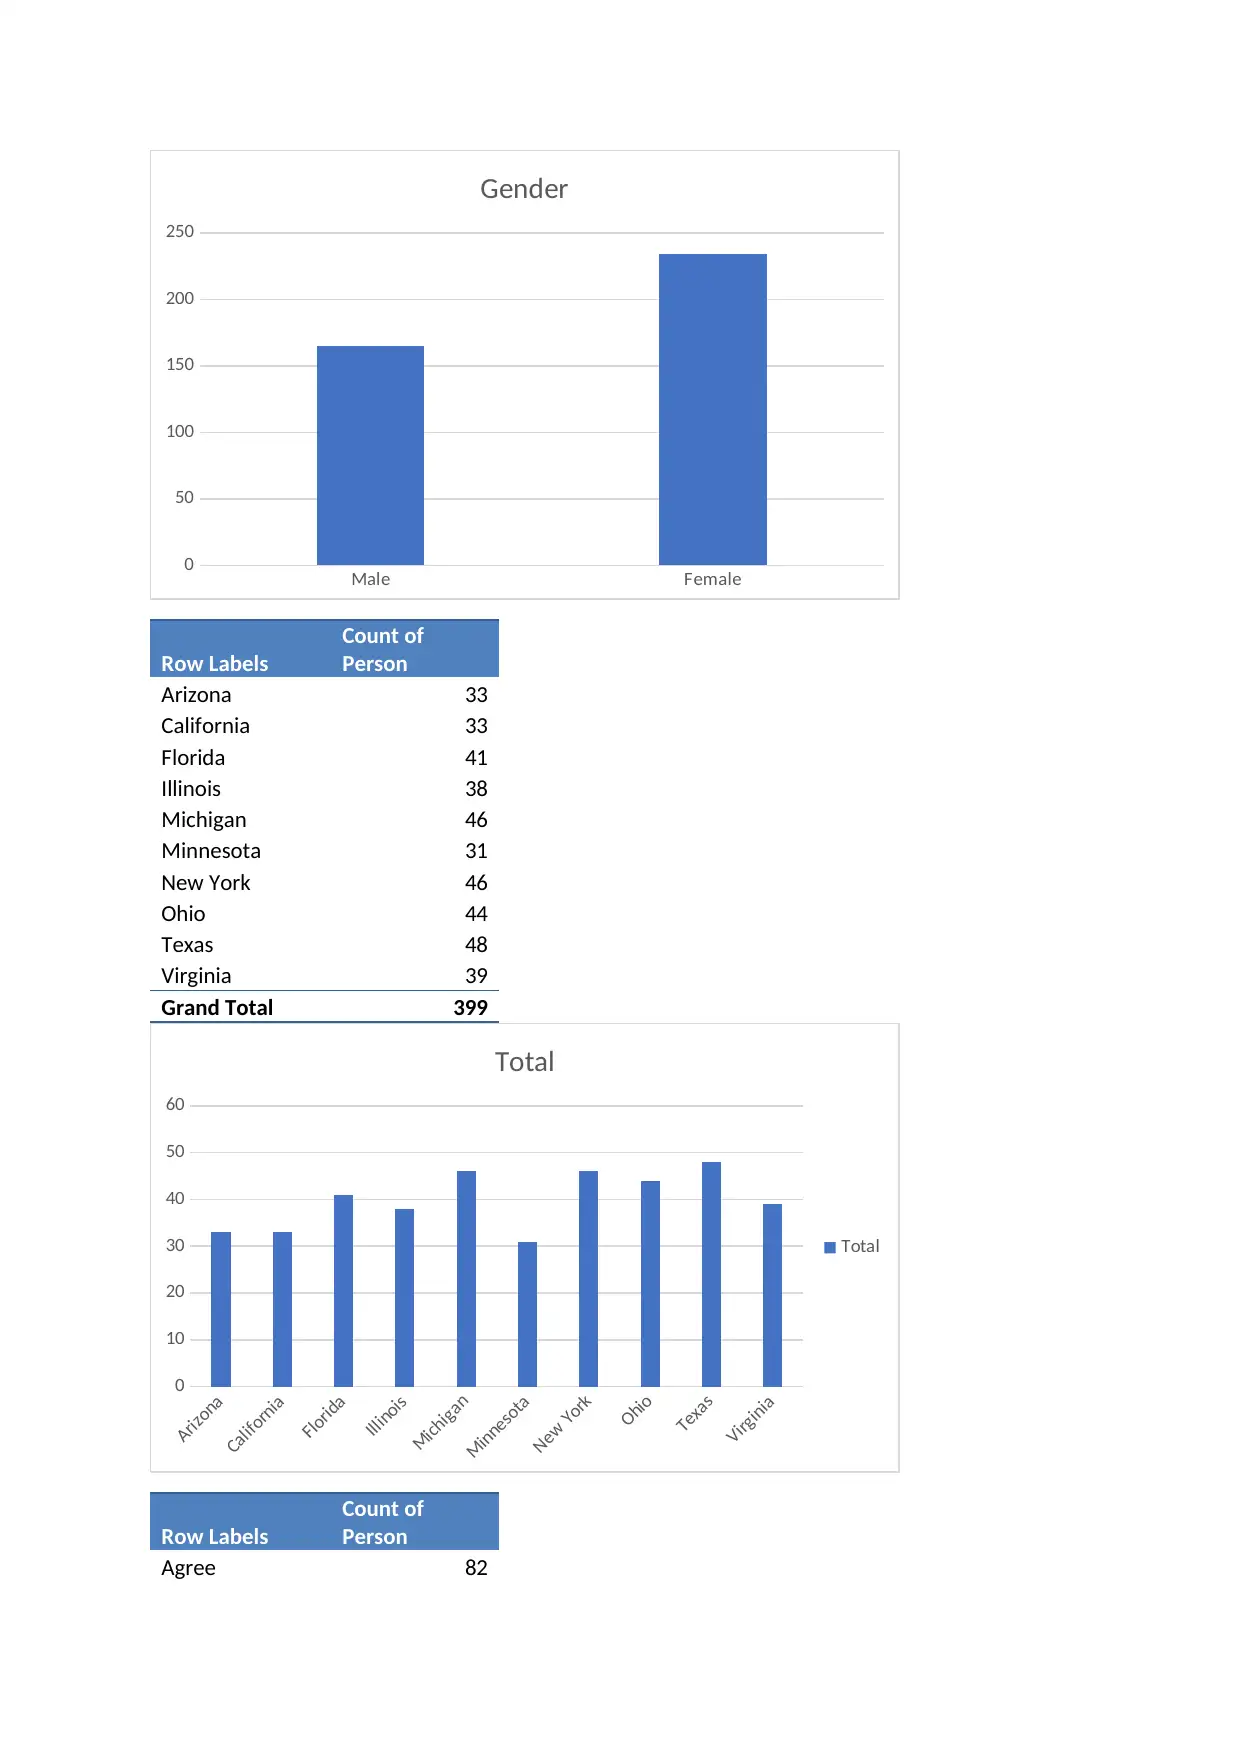
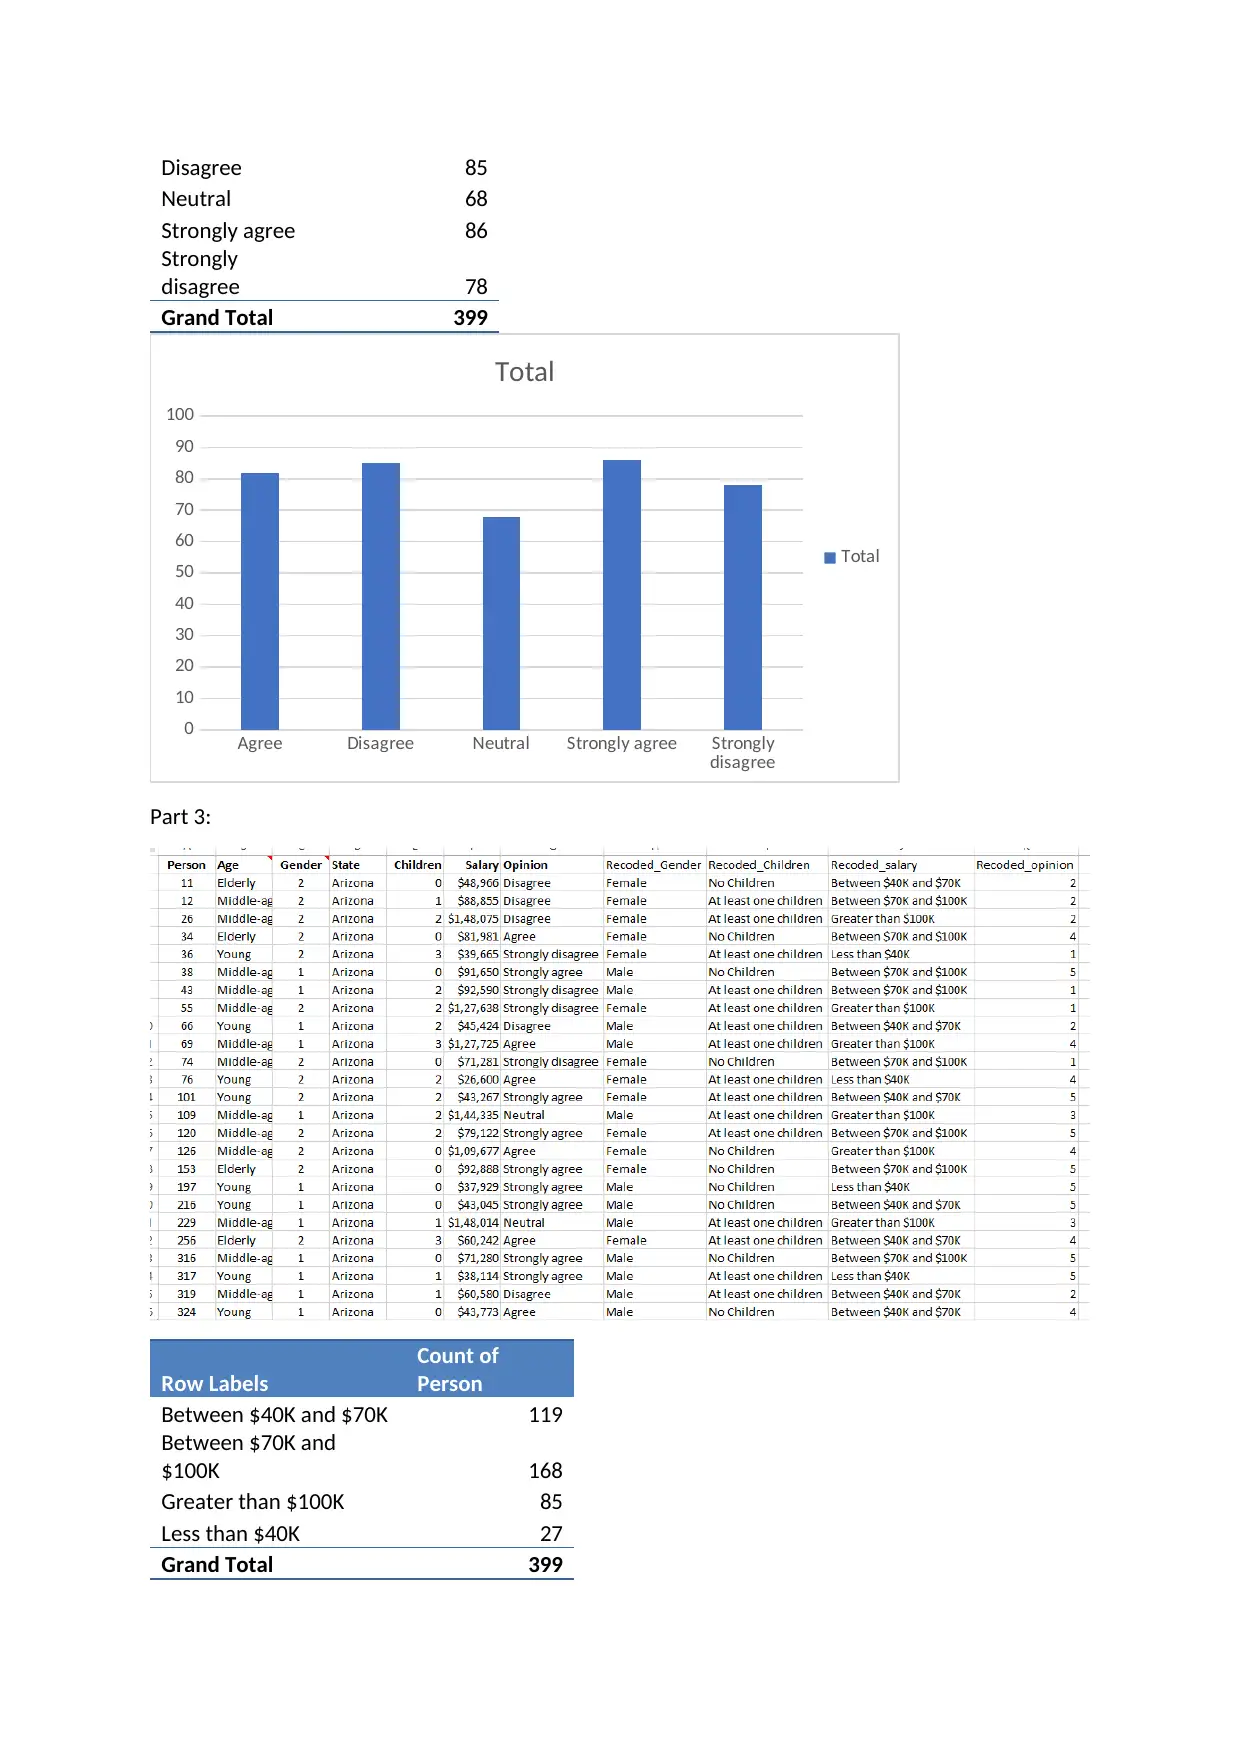
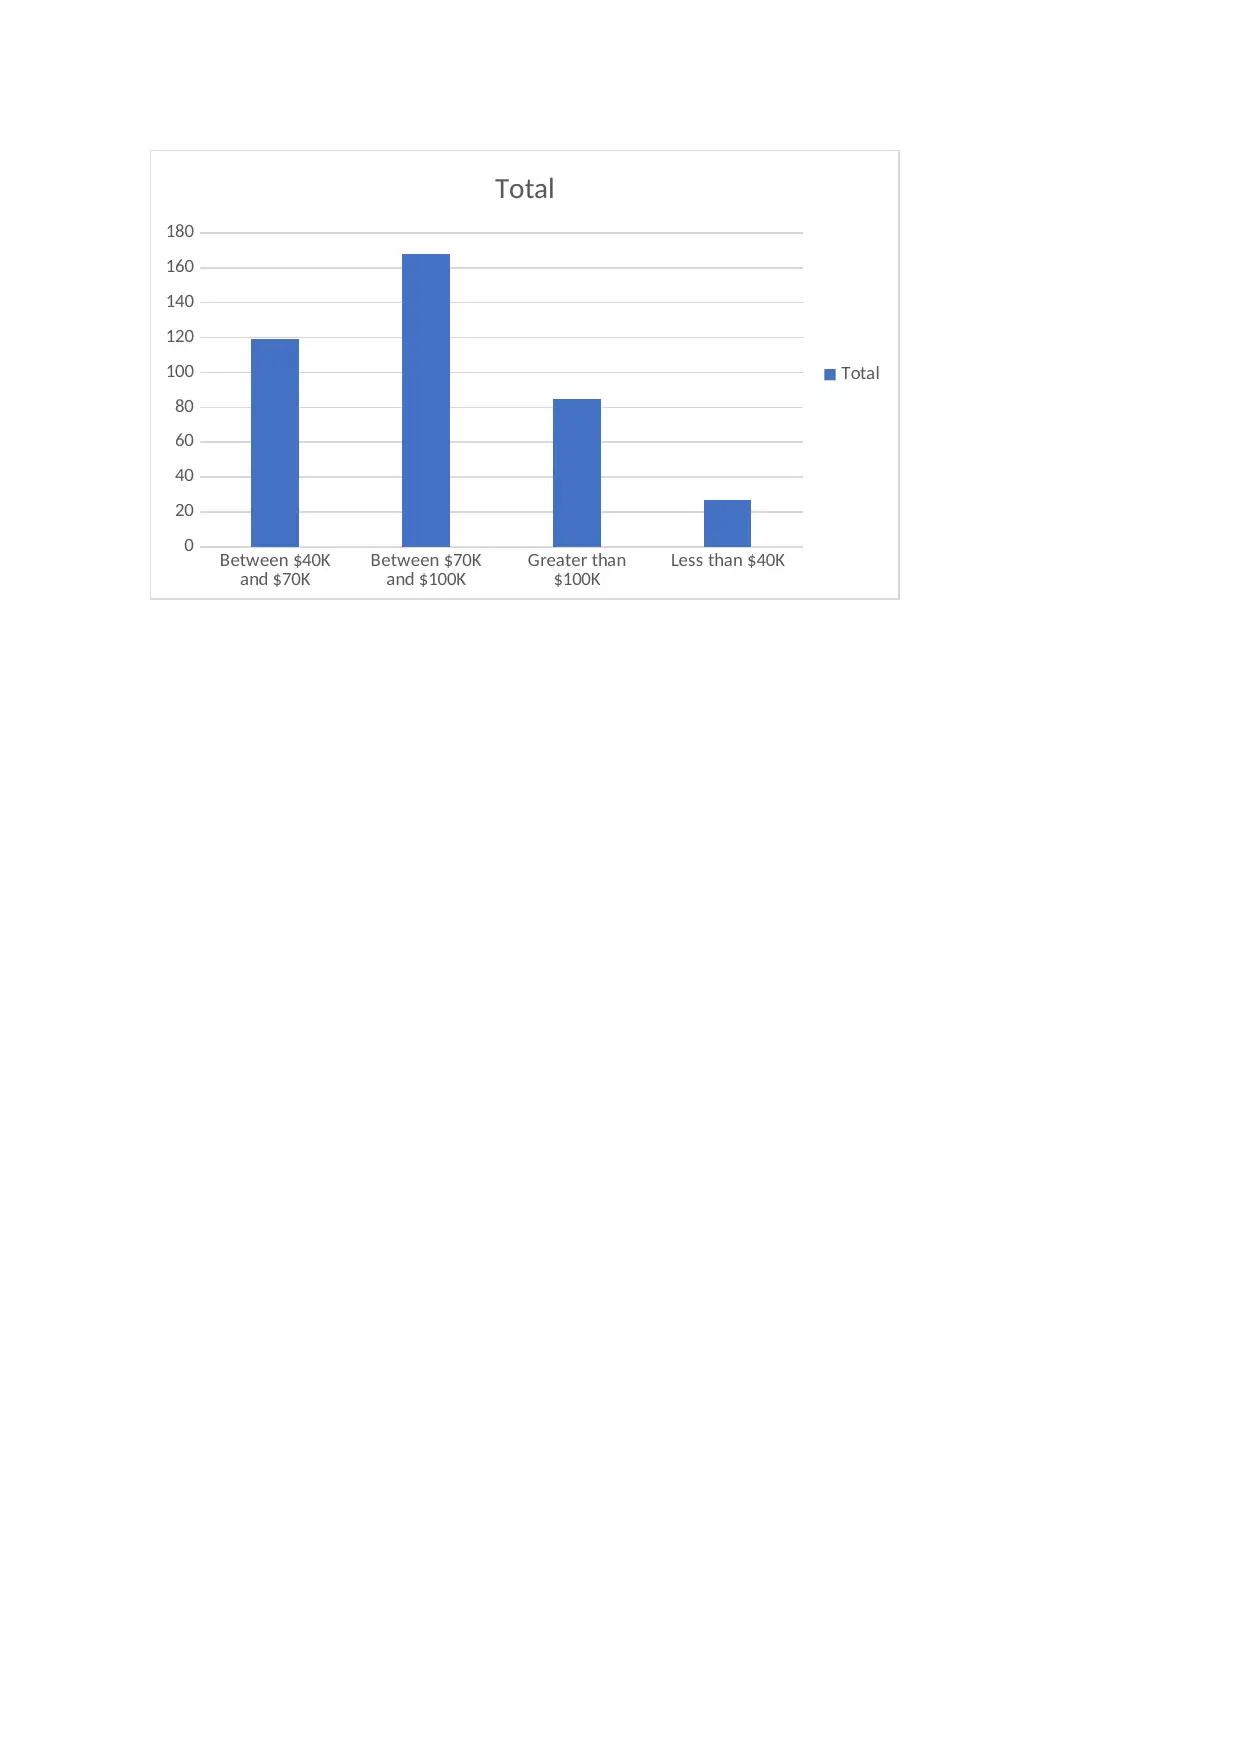
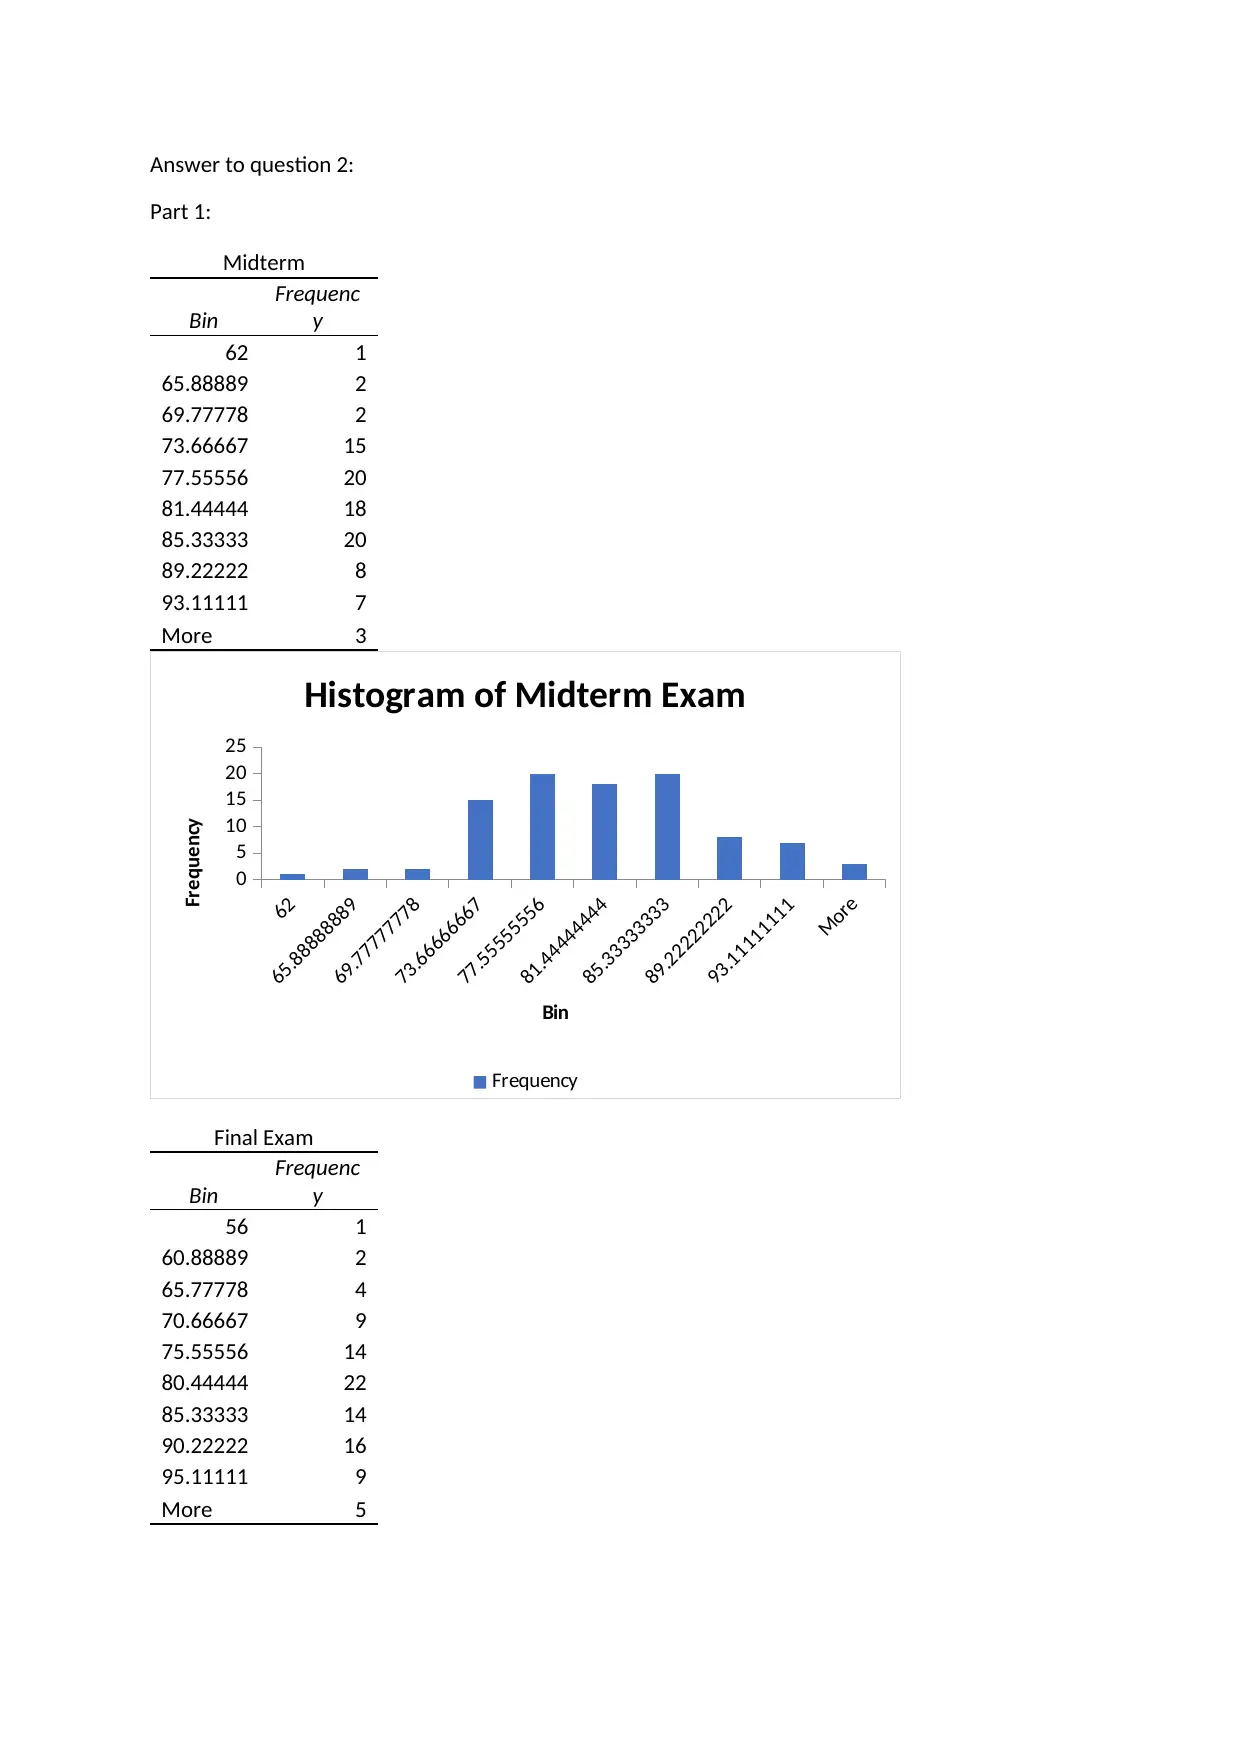
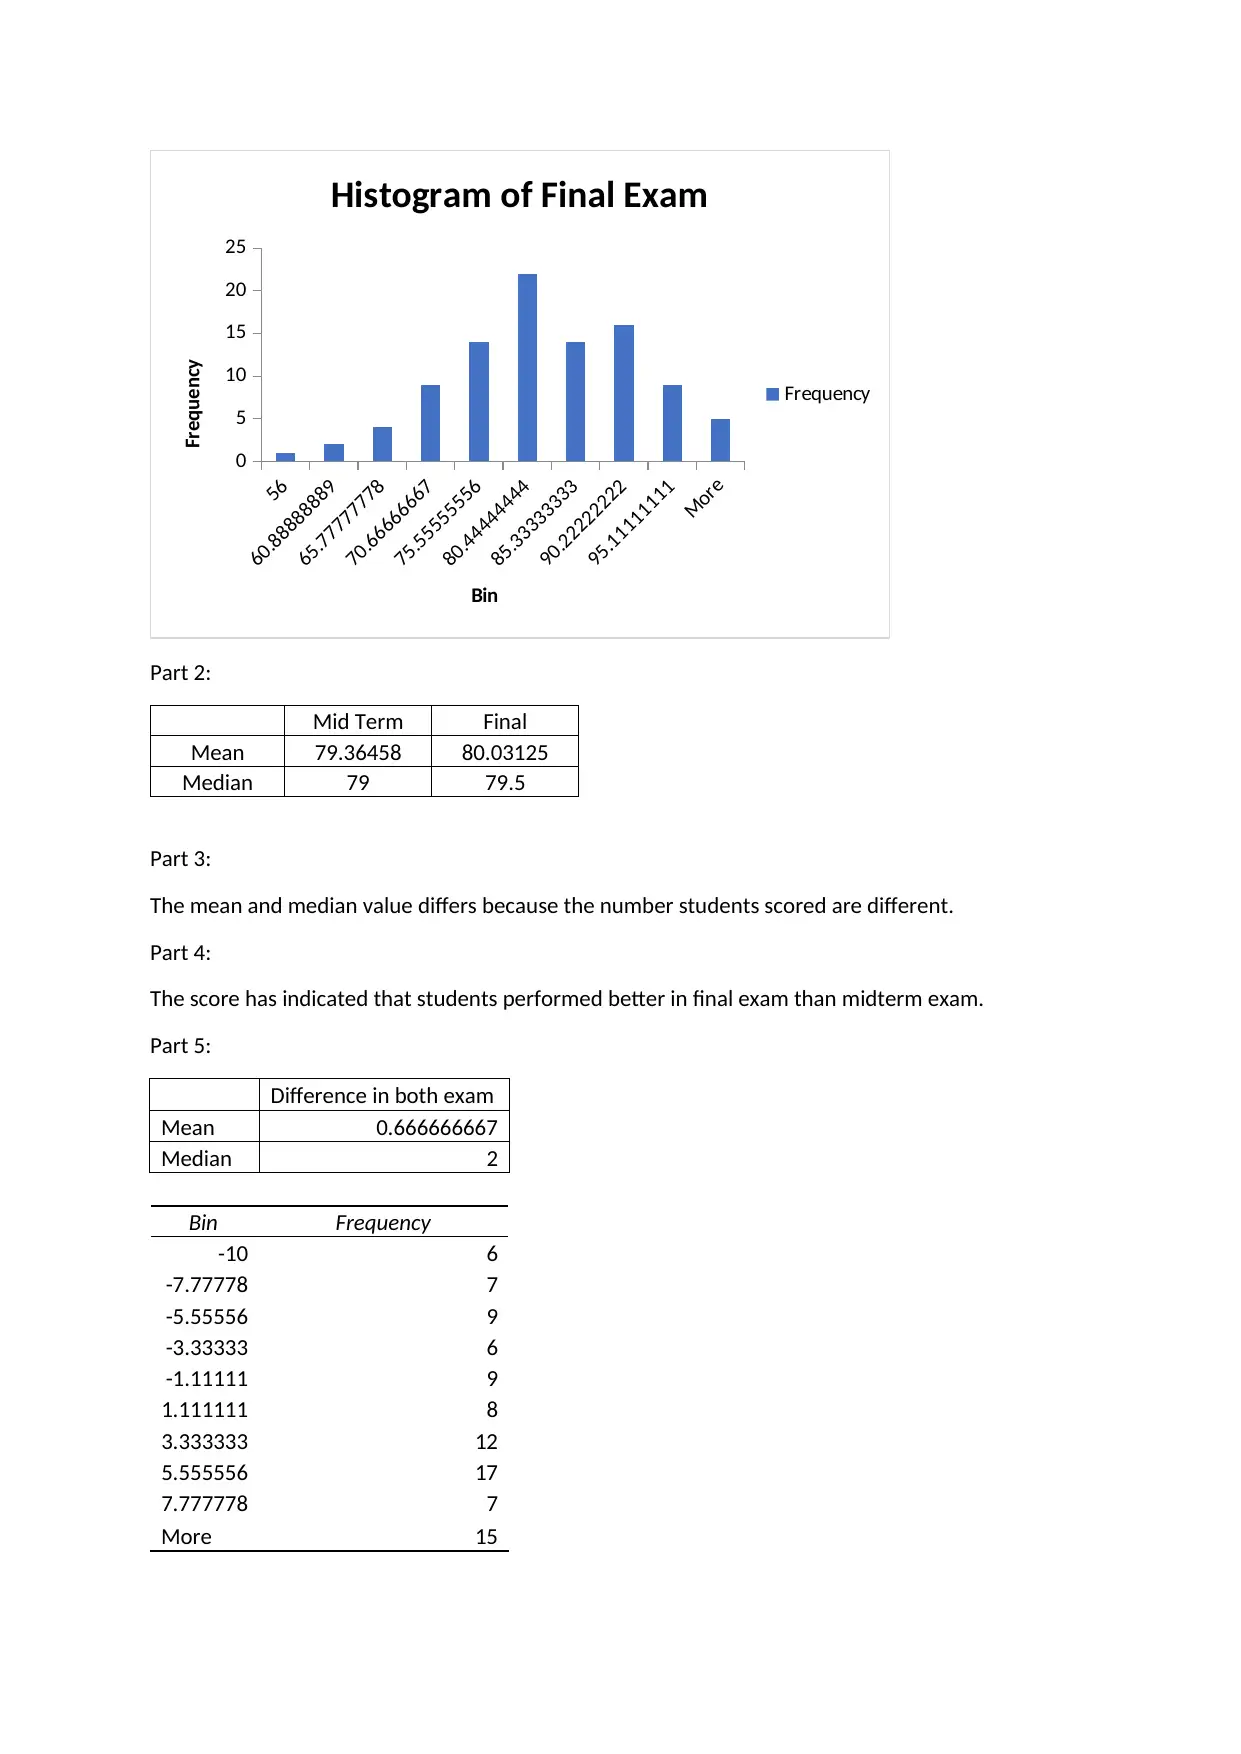
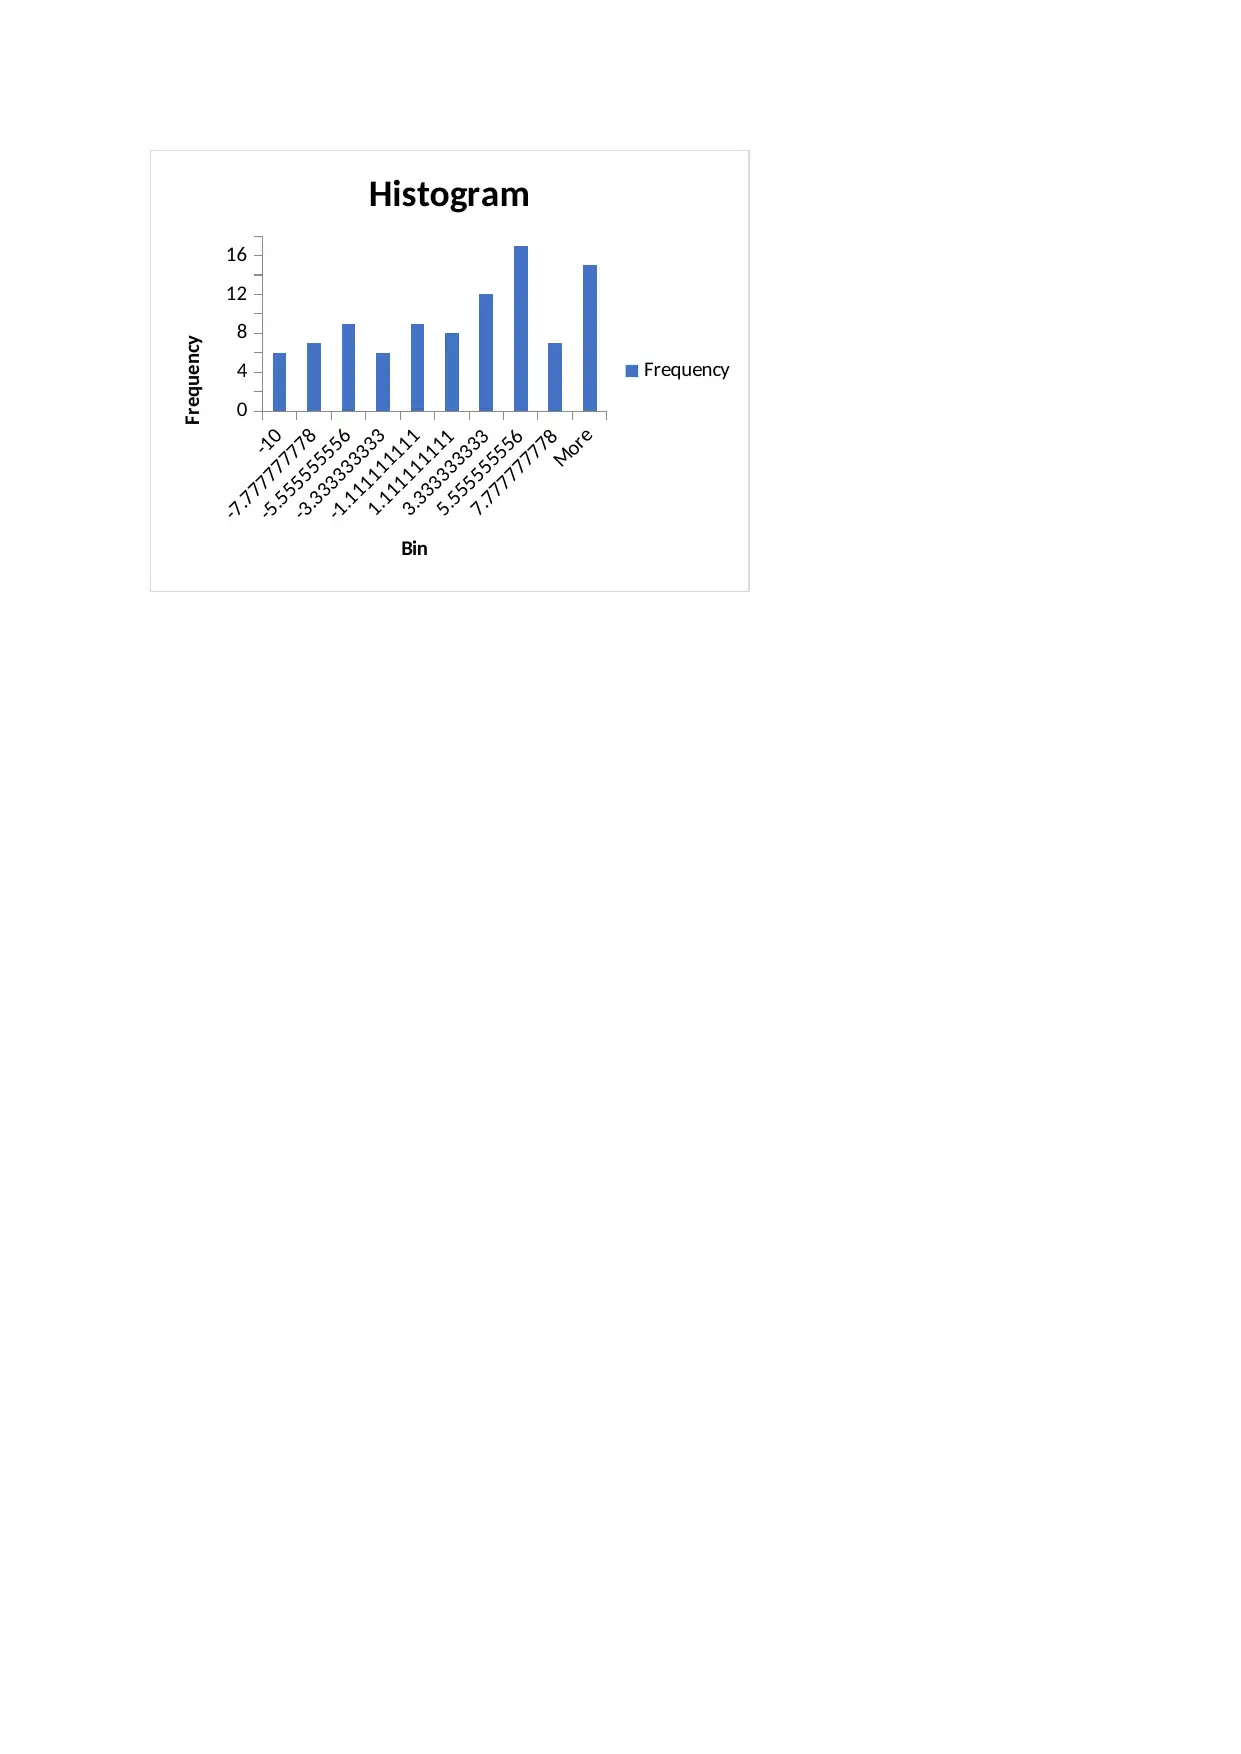
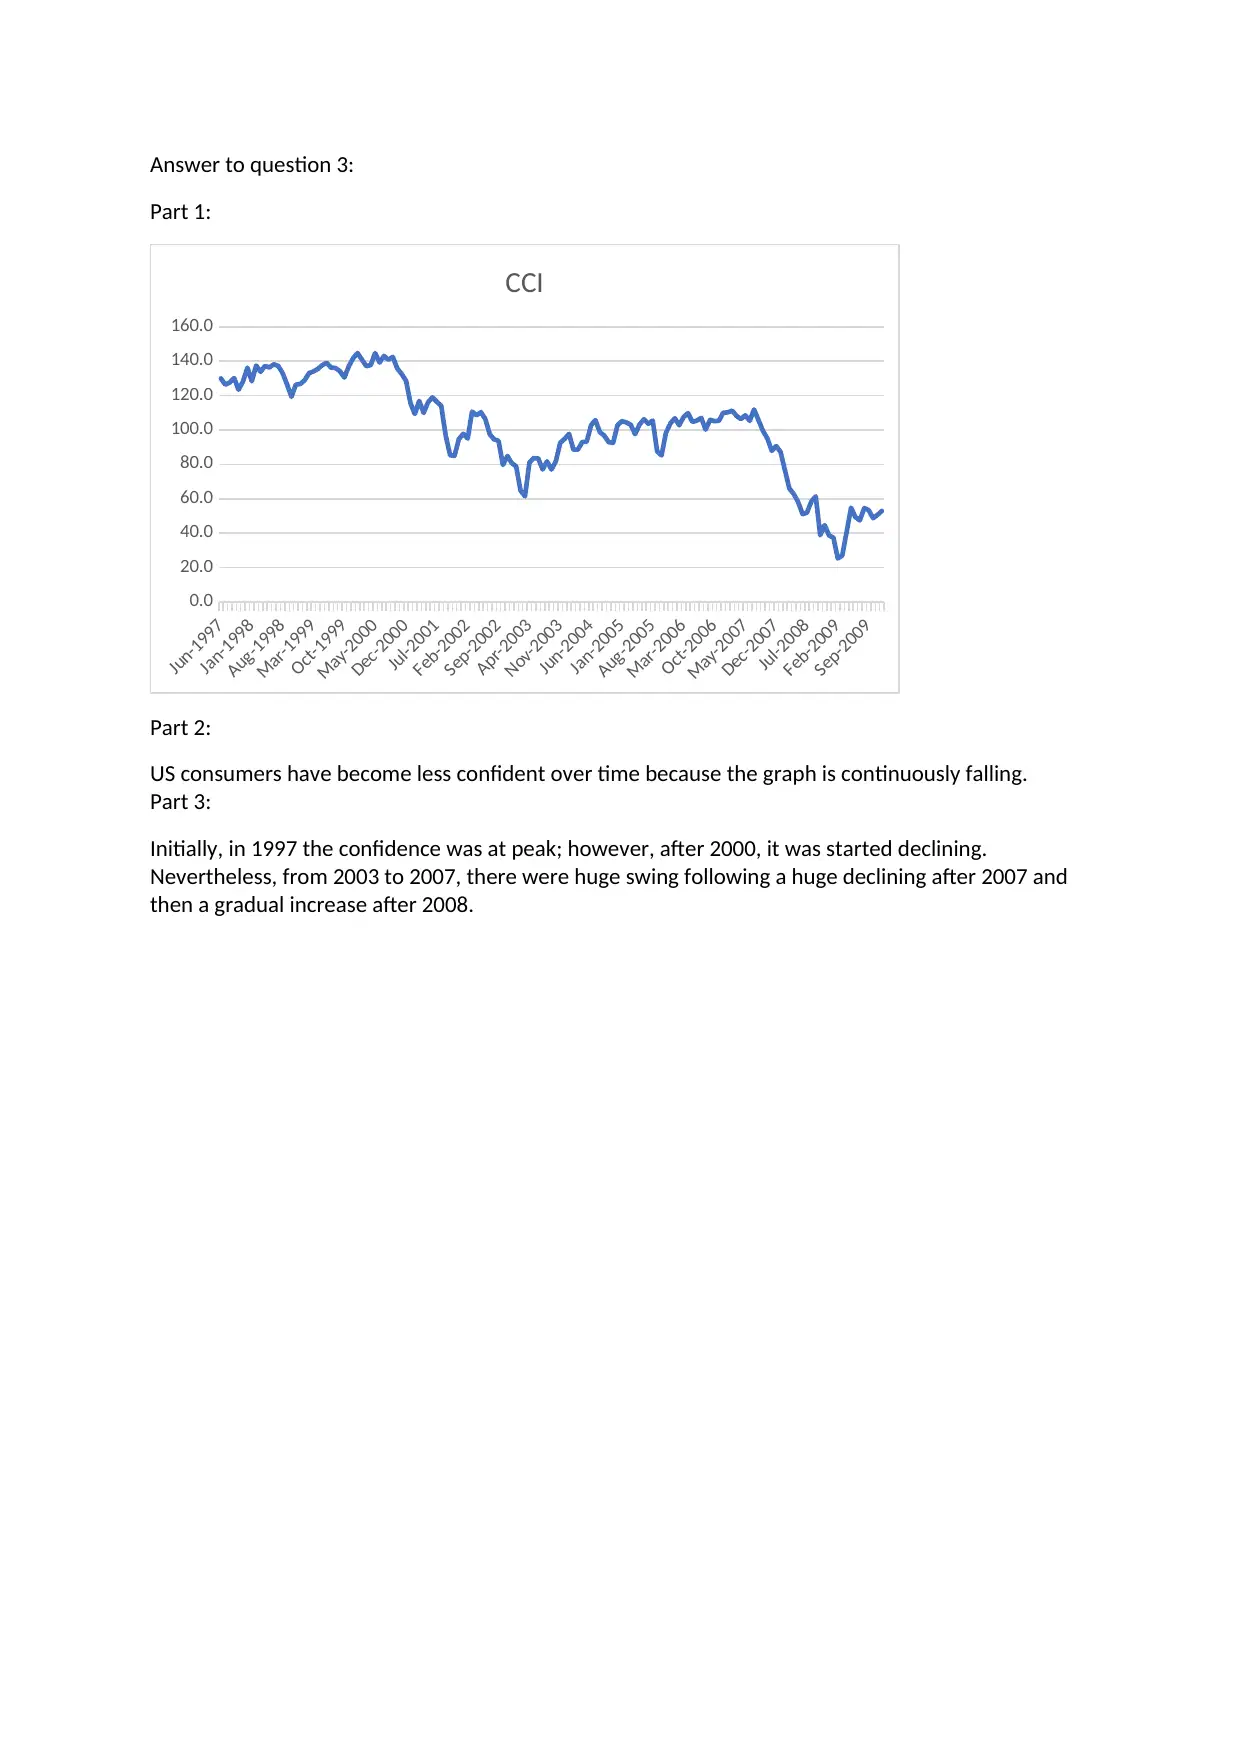
This document presents a comprehensive solution to Business Analytics Lab 1, addressing questions related to data analysis and decision-making. The solution begins by identifying and classifying variables (categorical, ordinal, and nominal) from a survey dataset, creating column charts to visualize the data. It then recodes the data, transforming variables like gender, children, salary, and opinion, and generates new column charts. The solution also analyzes midterm and final exam scores, constructing histograms, calculating mean and median scores, and comparing student performance. Furthermore, it examines the Consumer Confidence Index (CCI) over time, interpreting trends and fluctuations, and analyzes average salary data. The assignment demonstrates various data analysis techniques, including descriptive statistics, data visualization, and interpretation of results, providing a detailed and insightful analysis of the provided datasets.

1 out of 13

Your All-in-One AI-Powered Toolkit for Academic Success.
+13062052269
info@desklib.com
Available 24*7 on WhatsApp / Email
![[object Object]](/_next/static/media/star-bottom.7253800d.svg)
Copyright © 2020–2026 A2Z Services. All Rights Reserved. Developed and managed by ZUCOL.