Data Analysis, ER Diagram & Database Project for Dominican College

Verified

Added on  2024/05/30

|77
|4469
|495
Project
AI Summary
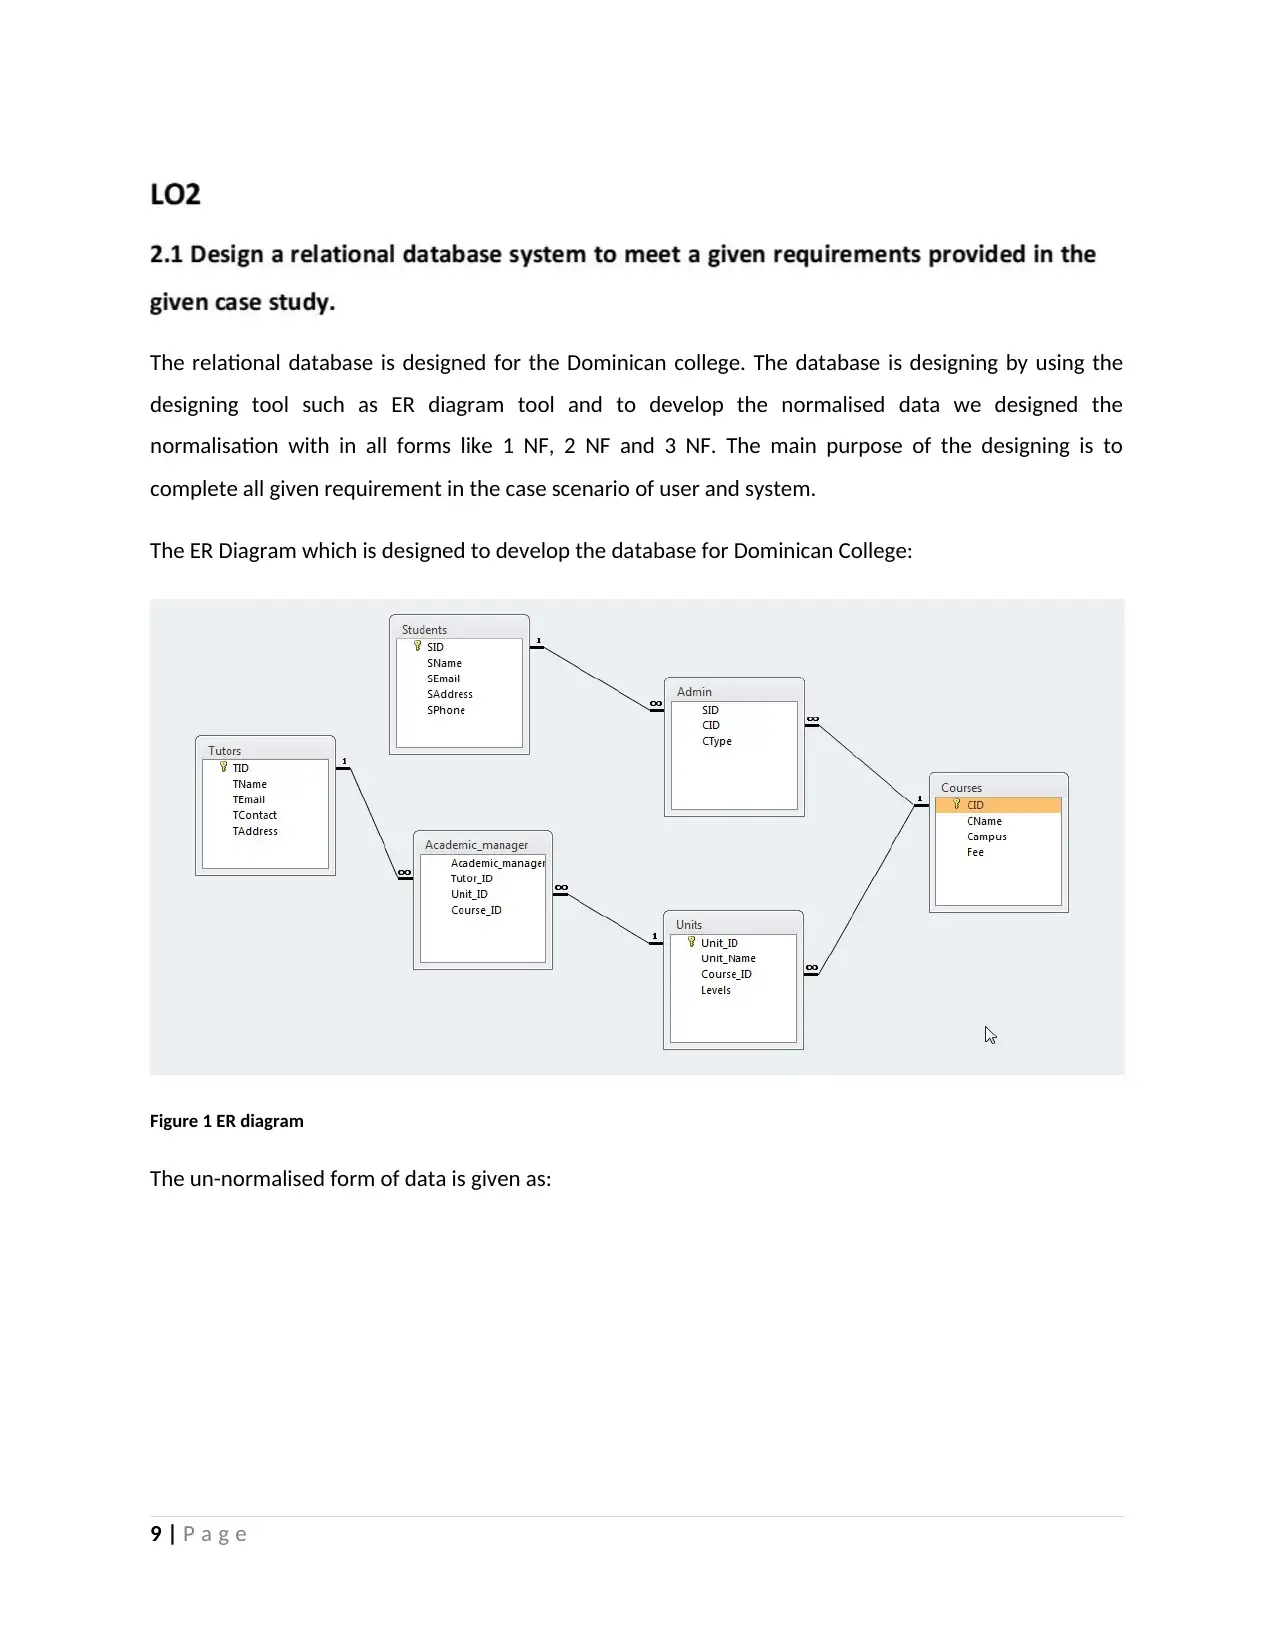
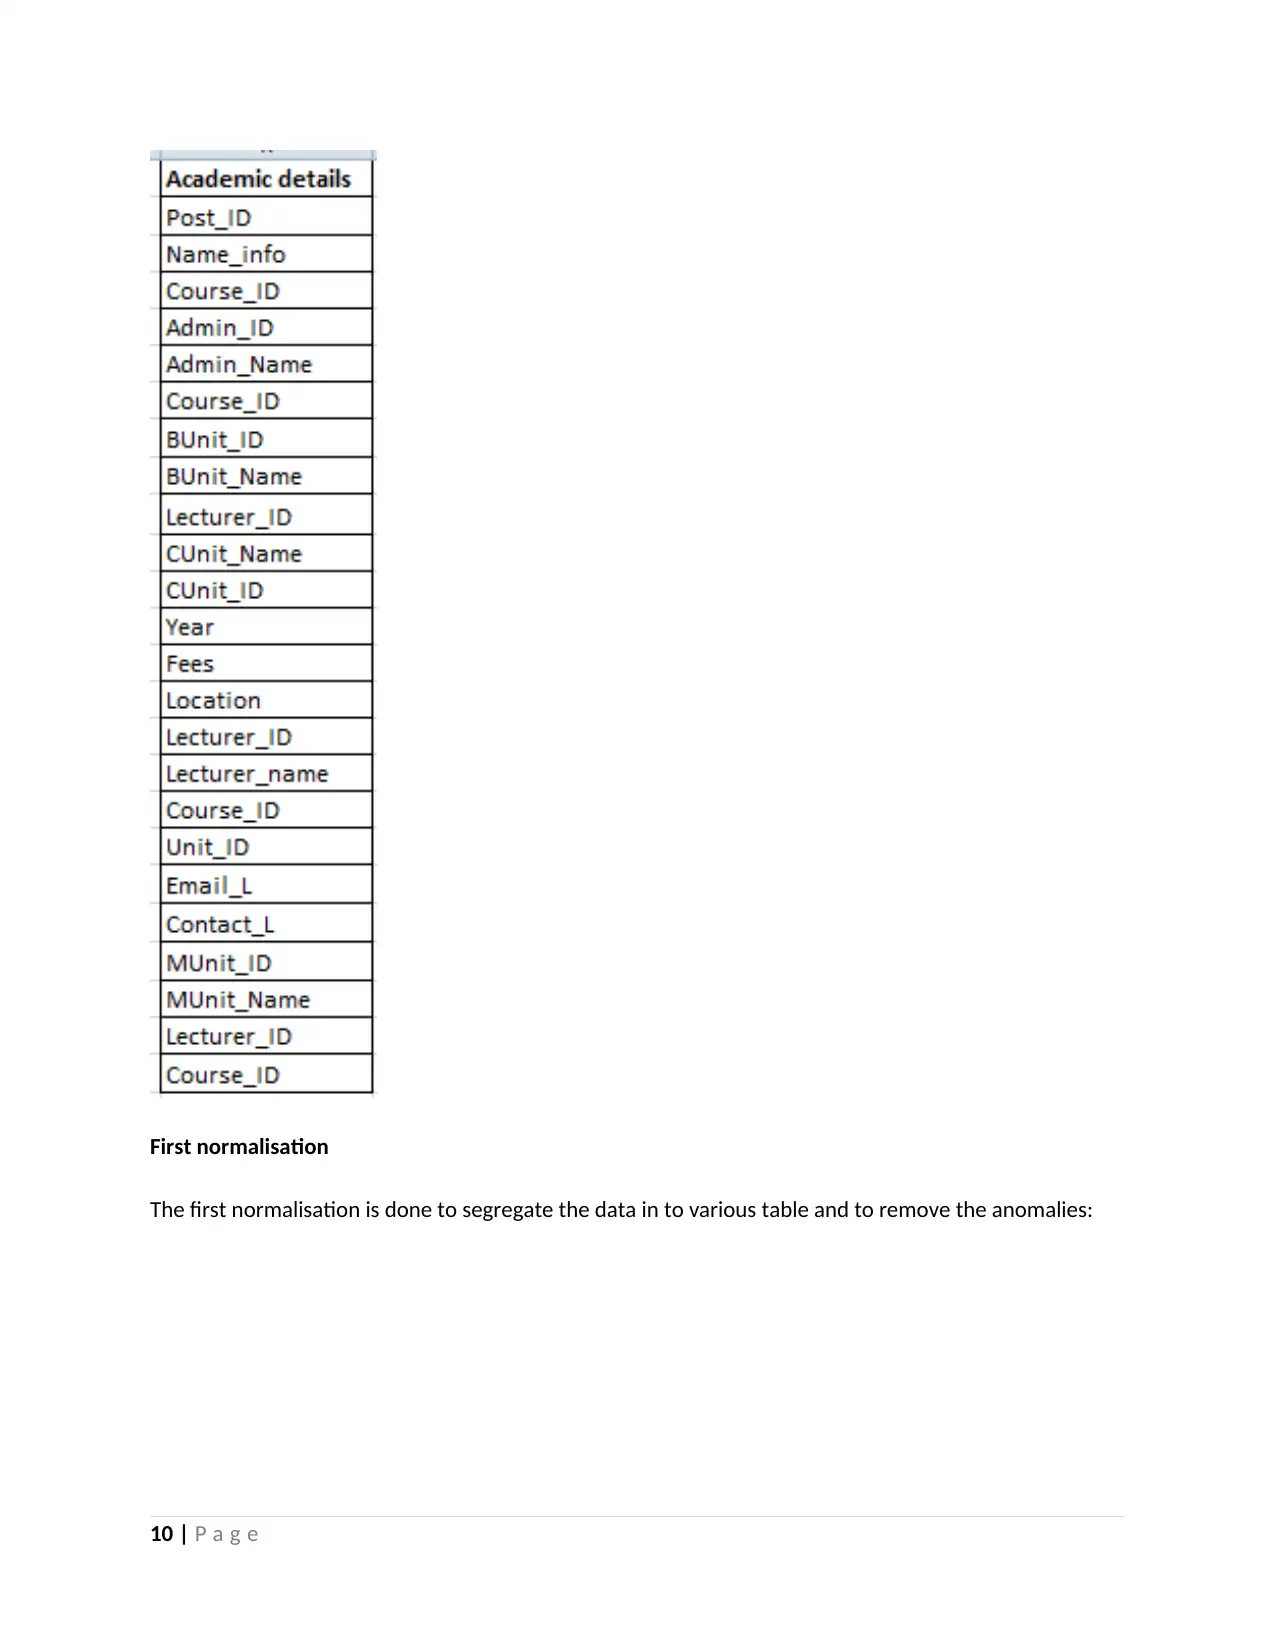
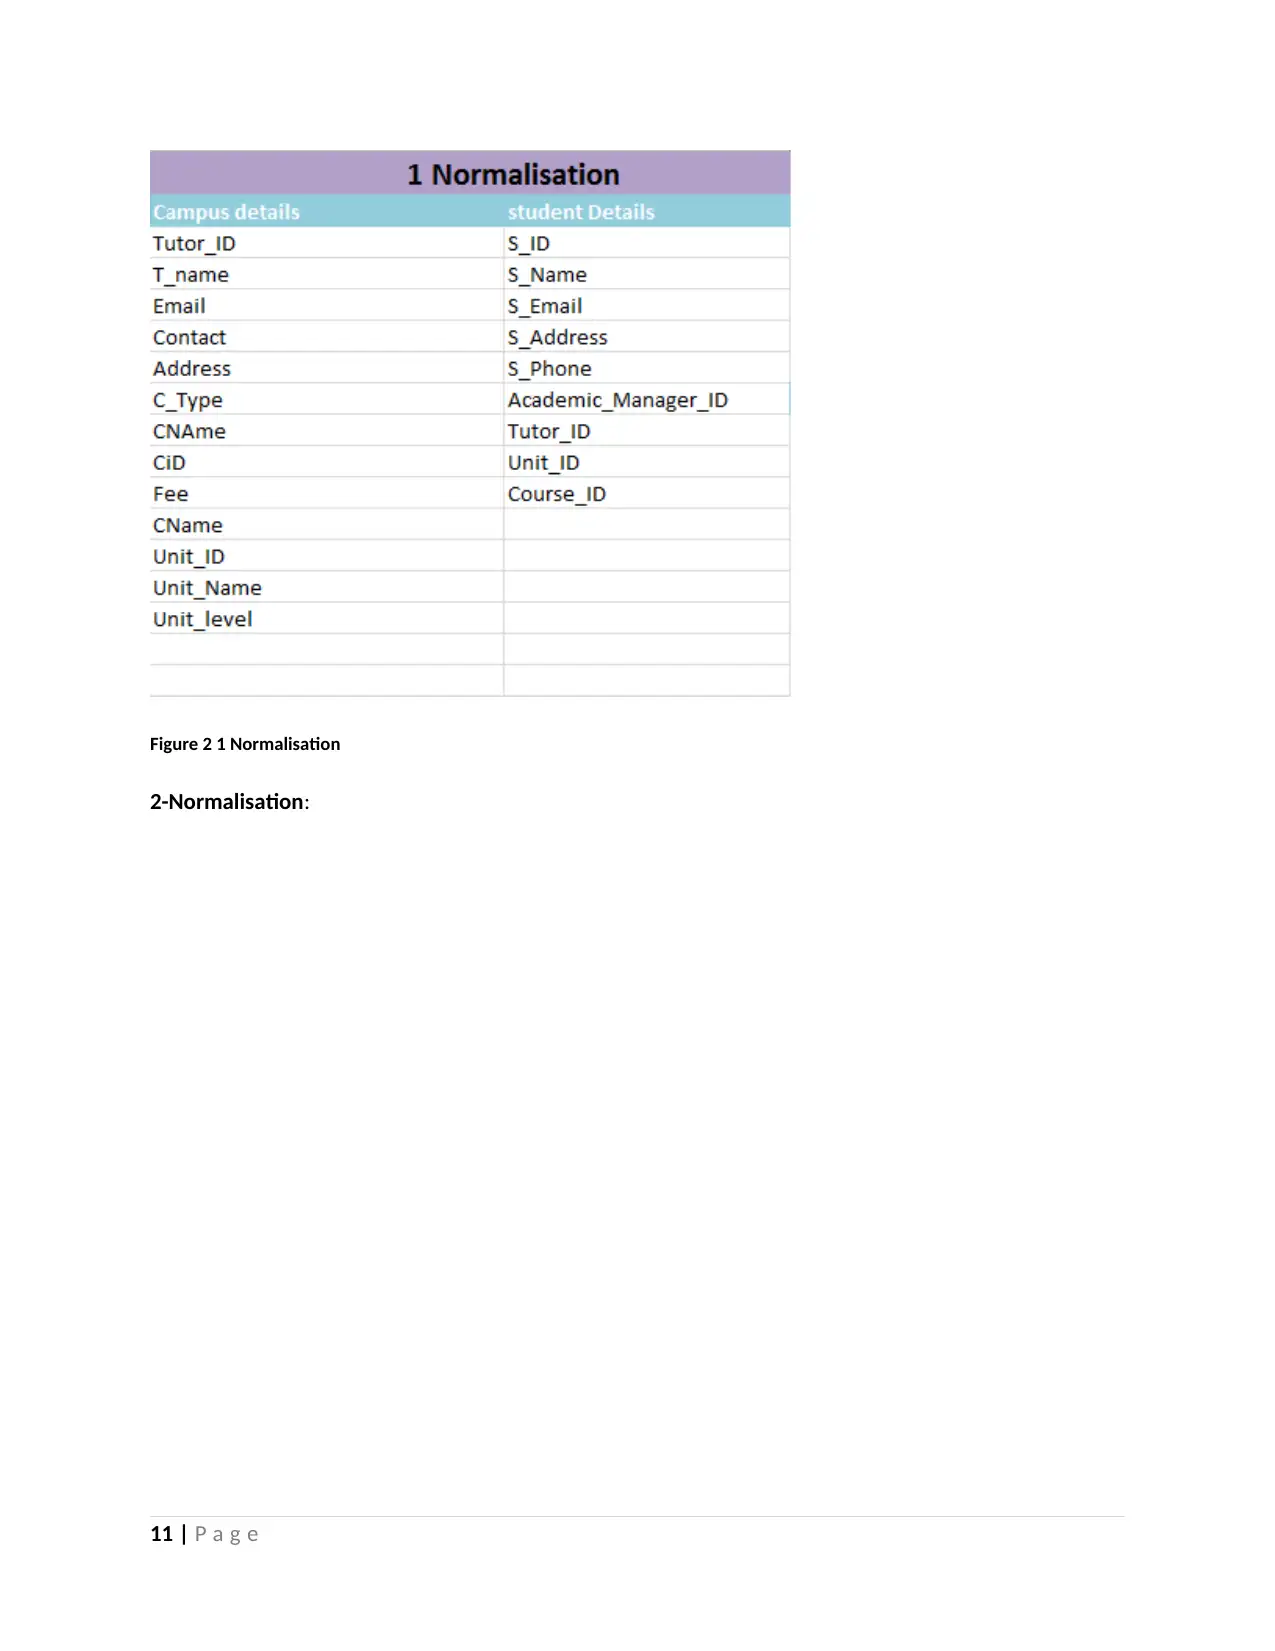
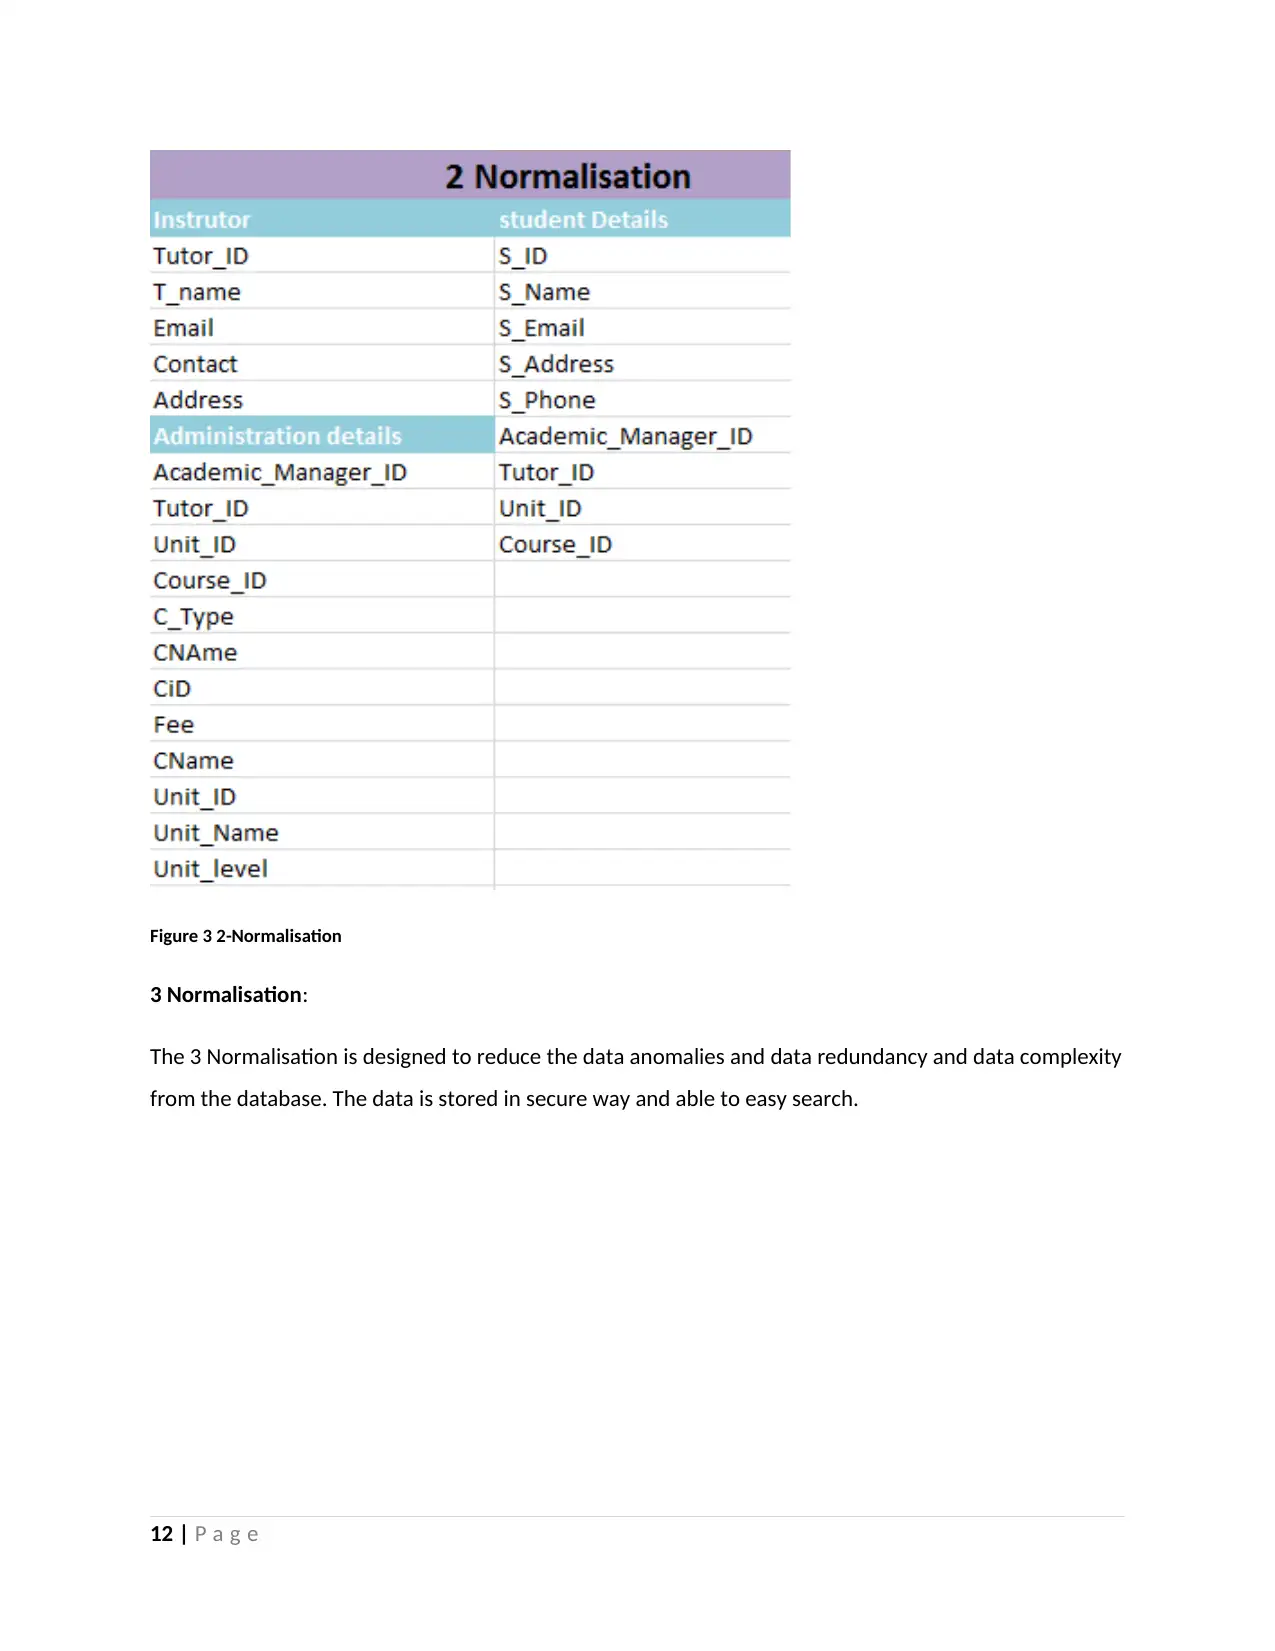
This project focuses on the data analysis and database design for Dominican College. It covers various aspects of database modeling, including conceptual modeling using the Entity-Relationship (ER) model, different database models such as hierarchical and semantic networks, and the construction of conceptual diagrams. The project details the normalization process, including 1NF, 2NF, and 3NF, to reduce data redundancy and anomalies. It also includes the design of database tables, forms for data entry, and reports for data presentation using MS Access. SQL queries are utilized for data manipulation and retrieval, enhancing the user interface and providing efficient data access. The document includes design views, datasheet views, and SQL views of the database elements, offering a comprehensive overview of the database development process for Dominican College. Desklib provides access to similar solved assignments.
Document Page
Assignment – Data Analysis and Design
1 | P a g e
tabler-icon-diamond-filled.svg

Paraphrase This Document

Need a fresh take? Get an instant paraphrase of this document with our AI Paraphraser
Document Page
2 | P a g e
Document Page
Database is a set of data stored on media accessible by a computer to simultaneously satisfy
several users selectively and in a very short time. They constitute the heart of the information
system.
There are 4 types of database Models:
Hierarchical DBs: the oldest ones based on a tree modeling of the data.
Relational DBs: organization of data into tables and exploitation using a declarative language
(eg Oracle, mySQL, Access).
DB Deductive: organization of data in table form and exploitation using a logical language.
DB Objects: Organize data as instances of hierarchical classes that have their own methods of
operation.
The modeling is carried out in three main stages which correspond to three different levels of
abstraction:
I. Conceptual level: represents the content of the database in conceptual terms, regardless of
any IT considerations.
II. Relational logic level: results from the translation of the conceptual schema into a schema
specific to a type of comic strip.
III. Physical level: is used to describe the organization and data access methods of the database.
Conceptual modeling
Modeling is a fundamental step in the design of the comic book, in that, on the one hand, it
determines the content of the comic strip and, on the other hand, defines the nature of the
relationships between the main concepts.
3 | P a g e
Document Page
The basic elements of the ER (Entity-Relationship) or EA (Entity-Association) model
ï‚· The entities
ï‚· Attributes
ï‚· Relationship type: cardinalities
ï‚· The ID
Entity: defines as an object that can be distinctly identified. There are two categories of entities:
- Regular entities: its existence does not depend on the existence of another entity.
- Weak entities: its existence depends on the existence of another entity.
Ex: the CONTRACT entity exists only if the corresponding CLIENT entity is present.
Attributes: characteristics or properties of entities.
An attribute may be mandatory or optional and have a domain of values.
Relationships: represent the existing links between the entities.
Unlike entities, relationships do not have their own relationships. Relationships are
characterized, like entities, by a name and possibly attributes.
Cardinality: the complete description of a relationship requires the precise definition of the
participation of the entities. Cardinality is the number of participation of an entity in a
relationship.
4 | P a g e
tabler-icon-diamond-filled.svg

Paraphrase This Document

Need a fresh take? Get an instant paraphrase of this document with our AI Paraphraser
Document Page
The hierarchical model
The information is organized in a tree-like fashion (hierarchical), accessible only from the root
of this tree. It makes it easy to add elements and modify their structure. The main defect of this
representation comes from the fact that the access point to the information is unique (it is the
root of the hierarchical tree). This implies that any search for data requires the course of all, or
at least part, of the hierarchy, through the root. The most common example is that of the tree
structure used for file systems (although it is not a DBMS itself, as we shall see later), where we
navigate from the root from the system to subdirectories and files containing the data.
The semantic networks model
This model describes the operation of a network database. This type of database works on the
principle of grouping the different elements of the database by their meaning. All information
can be associated with each other and serve as an access point. This makes it a complex model
whose data extraction is difficult. The most concrete example of such a model is the semantic
web.
The entity / association model
The entity-association model is a type of conceptual schema that is used in particular by
relational databases. The entry points are independent of the structure of the database, the
user simply enters a query, without having to navigate in the database, and the machine is
responsible for executing it to achieve the expected data. The main disadvantage is the rigidity
of the structure of the defined model and the difficulties that it entails to evolve an existing
schema when a new need appears or a design error is discovered. This includes all systems
based on the SQL language.
5 | P a g e
Document Page
How to build a conceptual diagram
The construction of a conceptual diagram can be realized in the following way:
1. Determine the list of entities.
2. for each entity:
(a) Establish the list of his attributes;
b) Among these, determine an identifier.
3. Determine the relationships between the entities.
4. for each relationship:
a) List the attributes specific to the relationship;
b) Check the dimension (binary, ternary, etc.);
c) Define the cardinalities.
5. Check the diagram obtained, including:
a) Remove transitivities;
b) Ensure that the diagram is connected;
c) Ensure that he responds to requests.
6. Validate with users.
Cardinality one by one: if and only if an employee can only be director in one department and a
department has only one employee as director.
Cardinality one to many: a department can occupy several employees who perform different
functions but each employee is part of only one department.
6 | P a g e
Document Page
Multi-to-many cardinality: One type of product can be manufactured in several factories and a
given factory can manufacture several types of products.
The cardinalities presented above are called maximum cardinalities in that they represent the
maximum number of participations of an entity in a relationship.
In contrast, the minimum cardinality is the minimum number of participations of an entity in a
relationship. The minimum cardinality can be 0 or 1.
The maximal and minimal cardinalities reflect the constraints specific to the entities and
relations. In a conceptual diagram, they are represented as follows:
0-1 none or only one
1-1 one and only one
0-N none or more
1-N one or more
The identifier: among all the attributes of the entity, the identifier is an attribute or a set of
attributes making it possible to determine one and only one entity within the set. Graphically
the identifiers are the underlined attributes. The weak entity will have an identifier composed
of the identifier of the entity on which it depends and another attribute.
A situation to be modeled can have several different schemes, each model having advantages
and disadvantages.
To measure the quality of ER modeling there are several criteria to use in combination:
Expressiveness: reflects the semantic richness of the schema. Can be characterized for example
by the number of concepts and / or constraints expressed in the table;
Minimality : tends to favor schemes with a minimum number of redundancies;
Readability: consists of evaluating the graphical representation itself;
7 | P a g e
tabler-icon-diamond-filled.svg

Paraphrase This Document

Need a fresh take? Get an instant paraphrase of this document with our AI Paraphraser
Document Page
Simplicity: favors schemas containing a minimum number of concepts. It can be measured for
example by calculating the number of entities and associations present on a diagram.
8 | P a g e
Document Page
The relational database is designed for the Dominican college. The database is designing by using the
designing tool such as ER diagram tool and to develop the normalised data we designed the
normalisation with in all forms like 1 NF, 2 NF and 3 NF. The main purpose of the designing is to
complete all given requirement in the case scenario of user and system.
The ER Diagram which is designed to develop the database for Dominican College:
Figure 1 ER diagram
The un-normalised form of data is given as:
9 | P a g e
Document Page
First normalisation
The first normalisation is done to segregate the data in to various table and to remove the anomalies:
10 | P a g e
tabler-icon-diamond-filled.svg

Paraphrase This Document

Need a fresh take? Get an instant paraphrase of this document with our AI Paraphraser
Document Page
Figure 2 1 Normalisation
2-Normalisation:
11 | P a g e
Document Page
Figure 3 2-Normalisation
3 Normalisation:
The 3 Normalisation is designed to reduce the data anomalies and data redundancy and data complexity
from the database. The data is stored in secure way and able to easy search.
12 | P a g e
chevron_up_icon
1 out of 77
circle_padding
hide_on_mobile
zoom_out_icon
[object Object]