Data Analysis Report: Donald Duque's Stationery Business Expansion
VerifiedAdded on 2020/07/23
|19
|3027
|112
Report
AI Summary
This report provides a comprehensive data analysis of Donald Duque's stationery business, focusing on its potential expansion into the German market. It begins with an overview of the wholesale stationery market in Germany and assesses per capita spending on writing and drawing materials. The report then delves into sales analysis, including assessments of total sales, mixed pie charts, and correlation coefficients. It estimates sales trends for 2018 and 2019, evaluates the pros and cons of expansion, and defines international standards for compliance. Furthermore, the report includes financial calculations, such as monthly mortgage costs, and analyzes a null hypothesis regarding order values. It also incorporates customer feedback and provides descriptive statistics, culminating in recommendations for business improvement and expansion strategies. The report leverages data to inform decision-making for sustainable business growth.
Analysing Data
Paraphrase This Document
Need a fresh take? Get an instant paraphrase of this document with our AI Paraphraser
Table of Contents
INTRODUCTION...........................................................................................................................3
TASK 1............................................................................................................................................3
Overview of wholesale stationery market in Germany:..............................................................3
TASK 2............................................................................................................................................4
Annual per capita spending on writing and drawing material....................................................4
TASK 3............................................................................................................................................5
a). Assessment of total sales:......................................................................................................5
b. Mixed pie chart.......................................................................................................................6
c. Correlation co-efficient through scatter plot:..........................................................................6
d. Estimating sales trend for the period of 2018 and 2019:........................................................7
TASK 4............................................................................................................................................8
a). Pros and Cons evaluation:......................................................................................................8
b). Defining international standards with which Donald Duque needs to comply:....................8
TASK 5............................................................................................................................................9
a). Computing monthly cost of 30 year repayment mortgage:....................................................9
b. Re-calculating monthly cost assuming that the interest is applied to the loan every month...9
TASK 6............................................................................................................................................9
TASK 7..........................................................................................................................................10
a). Advice for improvement:.....................................................................................................10
b). Descriptive statistics............................................................................................................12
TASK 8..........................................................................................................................................15
Recommendation.......................................................................................................................15
CONCLUSION..............................................................................................................................15
REFERENCES .............................................................................................................................16
Appendix........................................................................................................................................17
INTRODUCTION
Data analysis is the crucial part in any company as this helps the firm to take effective
business decisions which will ultimately used to gain the sustainability. Data analysis is the tool
which is used by the company's skilled employees for making the complex data useable and
understandable in an effective manner (Silverman, 2015). This report is based on the Donald
Duque which have their small family stationery business in the Northern France. Duque
emphasis on the wholesale business instead of retail. The Donald Duque have various products
which are: Printers, common office supplies, Furnitures which are used in the office premises,
drawing materials etc. Donald is trying to expand their business in Germany. But, before going
to expand the business, there is a strong need to know the market by simplifying the data
(MGCC Perspective, 2016).
TASK 1
Overview of wholesale stationery market in Germany:
Form assessment, this has been determined that Germany is enjoying leading position in
the stationery market. Henceforth, now there are diverse organisations which operates in
Germany which renders customers a high quality products along with their Staedtler, Stadbilo,
Lamy etc.
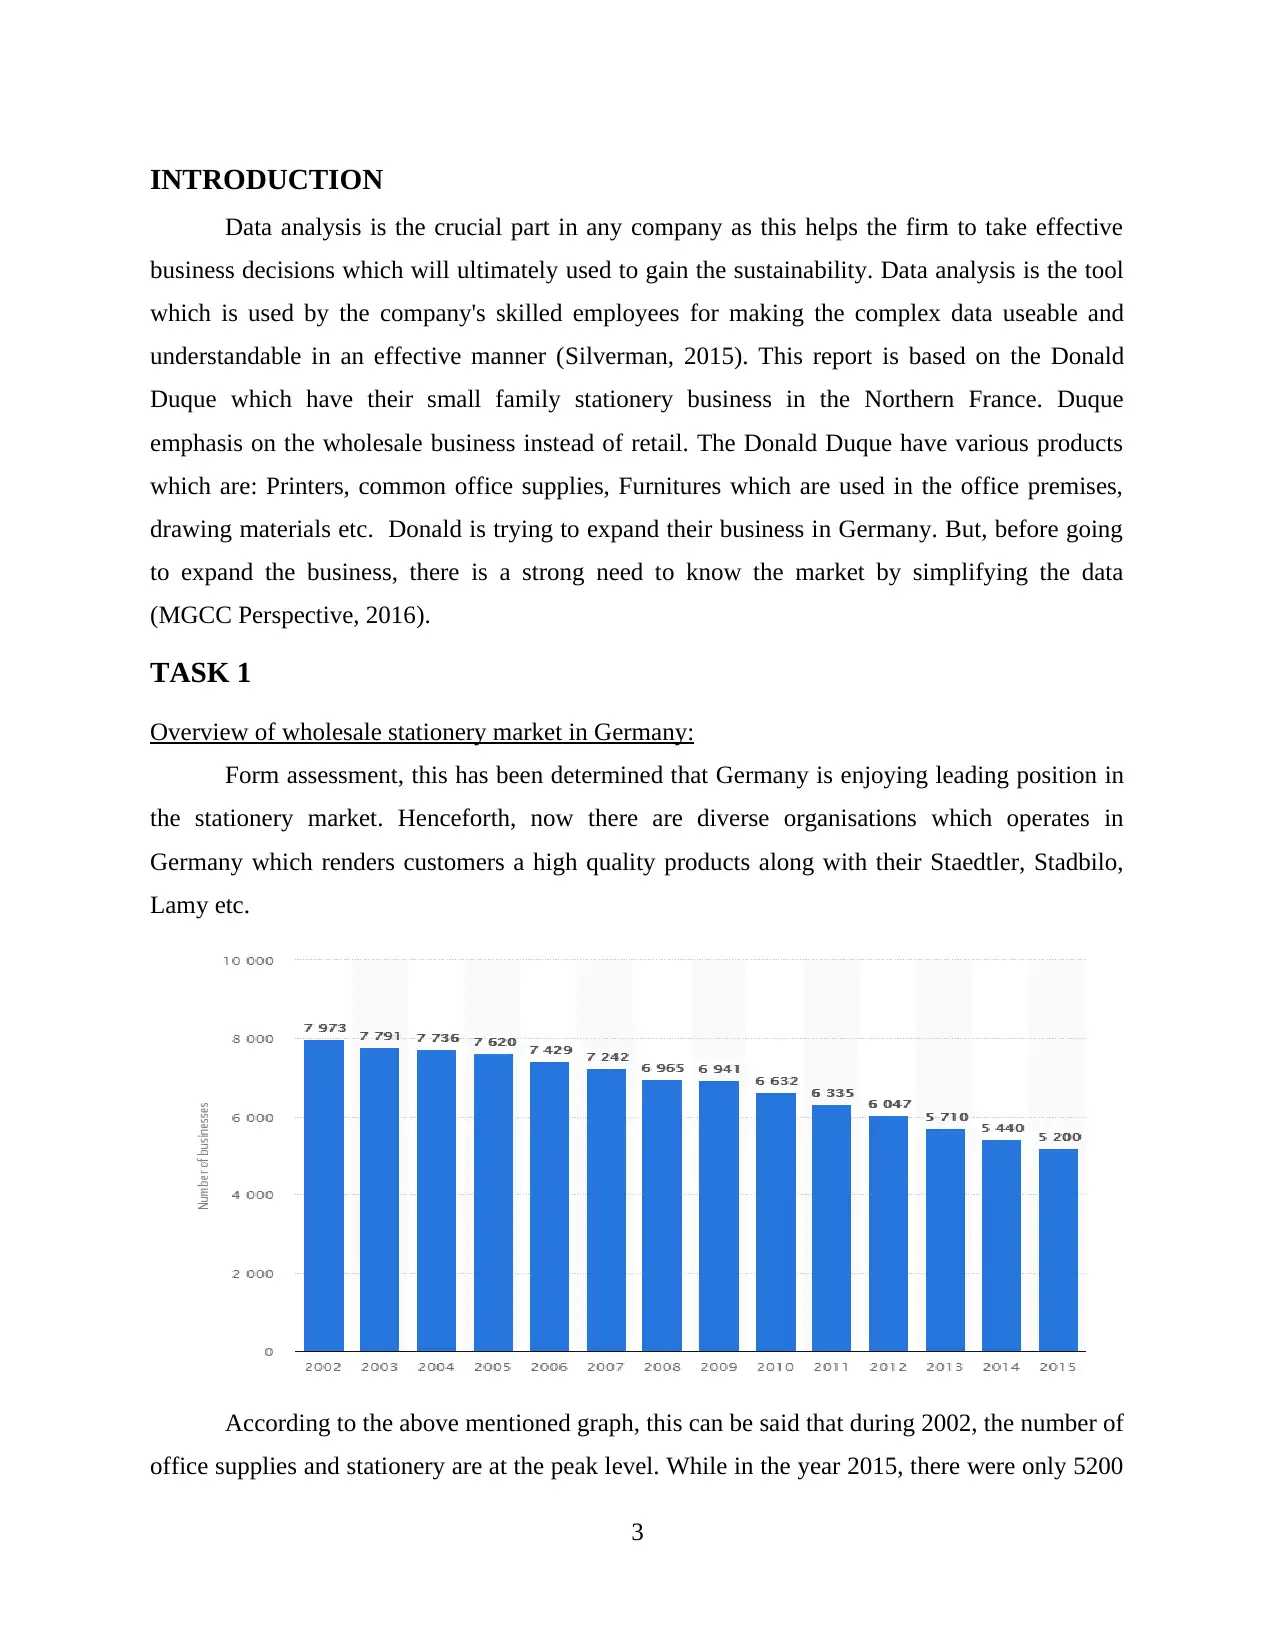
According to the above mentioned graph, this can be said that during 2002, the number of
office supplies and stationery are at the peak level. While in the year 2015, there were only 5200
3
Data analysis is the crucial part in any company as this helps the firm to take effective
business decisions which will ultimately used to gain the sustainability. Data analysis is the tool
which is used by the company's skilled employees for making the complex data useable and
understandable in an effective manner (Silverman, 2015). This report is based on the Donald
Duque which have their small family stationery business in the Northern France. Duque
emphasis on the wholesale business instead of retail. The Donald Duque have various products
which are: Printers, common office supplies, Furnitures which are used in the office premises,
drawing materials etc. Donald is trying to expand their business in Germany. But, before going
to expand the business, there is a strong need to know the market by simplifying the data
(MGCC Perspective, 2016).
TASK 1
Overview of wholesale stationery market in Germany:
Form assessment, this has been determined that Germany is enjoying leading position in
the stationery market. Henceforth, now there are diverse organisations which operates in
Germany which renders customers a high quality products along with their Staedtler, Stadbilo,
Lamy etc.
According to the above mentioned graph, this can be said that during 2002, the number of
office supplies and stationery are at the peak level. While in the year 2015, there were only 5200
3
⊘ This is a preview!⊘
Do you want full access?
Subscribe today to unlock all pages.
Trusted by 1+ million students worldwide
retailers who were far less than the earlier time. In addition to this, the main focus is likewise laid
down by the supplies and stationery retailer. In addition to this, the main focus is made by
suppliers on bringing or introducing innovative stationery products or services to the consumers
which can satiate their expectations level in a most effective manner. In addition to this, due to
enhancing the brand of the suppliers in overseas market, sales revenue would automatically rise
by 3.5% proportionately. In addition to this, various changes are likewise evaluated in such
industry after entry of specialist retailer. In addition to this, various retailers are trying to enhance
their quality and provides more efficient products or services to their clients so that they could
form various effective decisions (Schabenberger and Gotway, 2017). As, this is rightly observed
that the those company's products are mostly recommended in the market under which the
labelled are affixed. This can be rightly said that the products of the company are now sold out
online as the people are using online way for shopping.
TASK 2
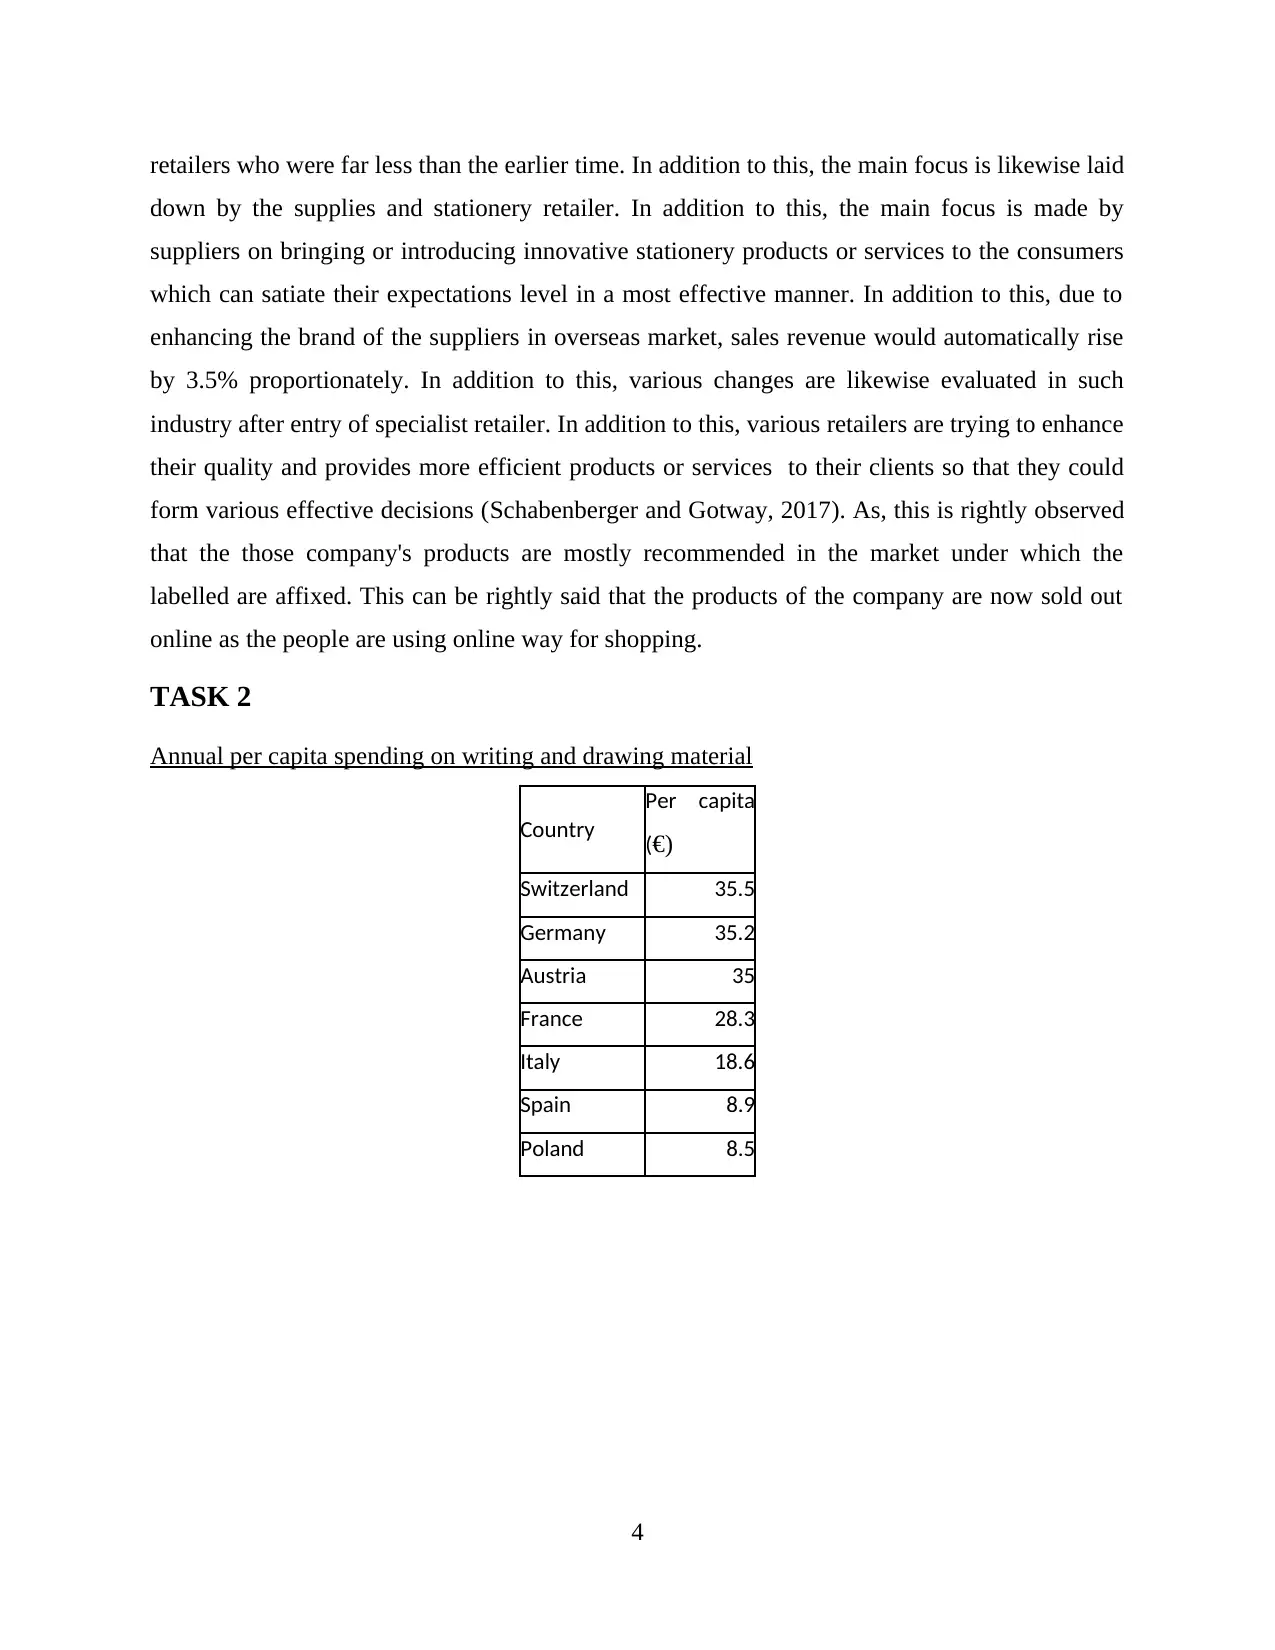
Annual per capita spending on writing and drawing material
Country
Per capita
(€)
Switzerland 35.5
Germany 35.2
Austria 35
France 28.3
Italy 18.6
Spain 8.9
Poland 8.5
4
down by the supplies and stationery retailer. In addition to this, the main focus is made by
suppliers on bringing or introducing innovative stationery products or services to the consumers
which can satiate their expectations level in a most effective manner. In addition to this, due to
enhancing the brand of the suppliers in overseas market, sales revenue would automatically rise
by 3.5% proportionately. In addition to this, various changes are likewise evaluated in such
industry after entry of specialist retailer. In addition to this, various retailers are trying to enhance
their quality and provides more efficient products or services to their clients so that they could
form various effective decisions (Schabenberger and Gotway, 2017). As, this is rightly observed
that the those company's products are mostly recommended in the market under which the
labelled are affixed. This can be rightly said that the products of the company are now sold out
online as the people are using online way for shopping.
TASK 2
Annual per capita spending on writing and drawing material
Country
Per capita
(€)
Switzerland 35.5
Germany 35.2
Austria 35
France 28.3
Italy 18.6
Spain 8.9
Poland 8.5
4
Paraphrase This Document
Need a fresh take? Get an instant paraphrase of this document with our AI Paraphraser
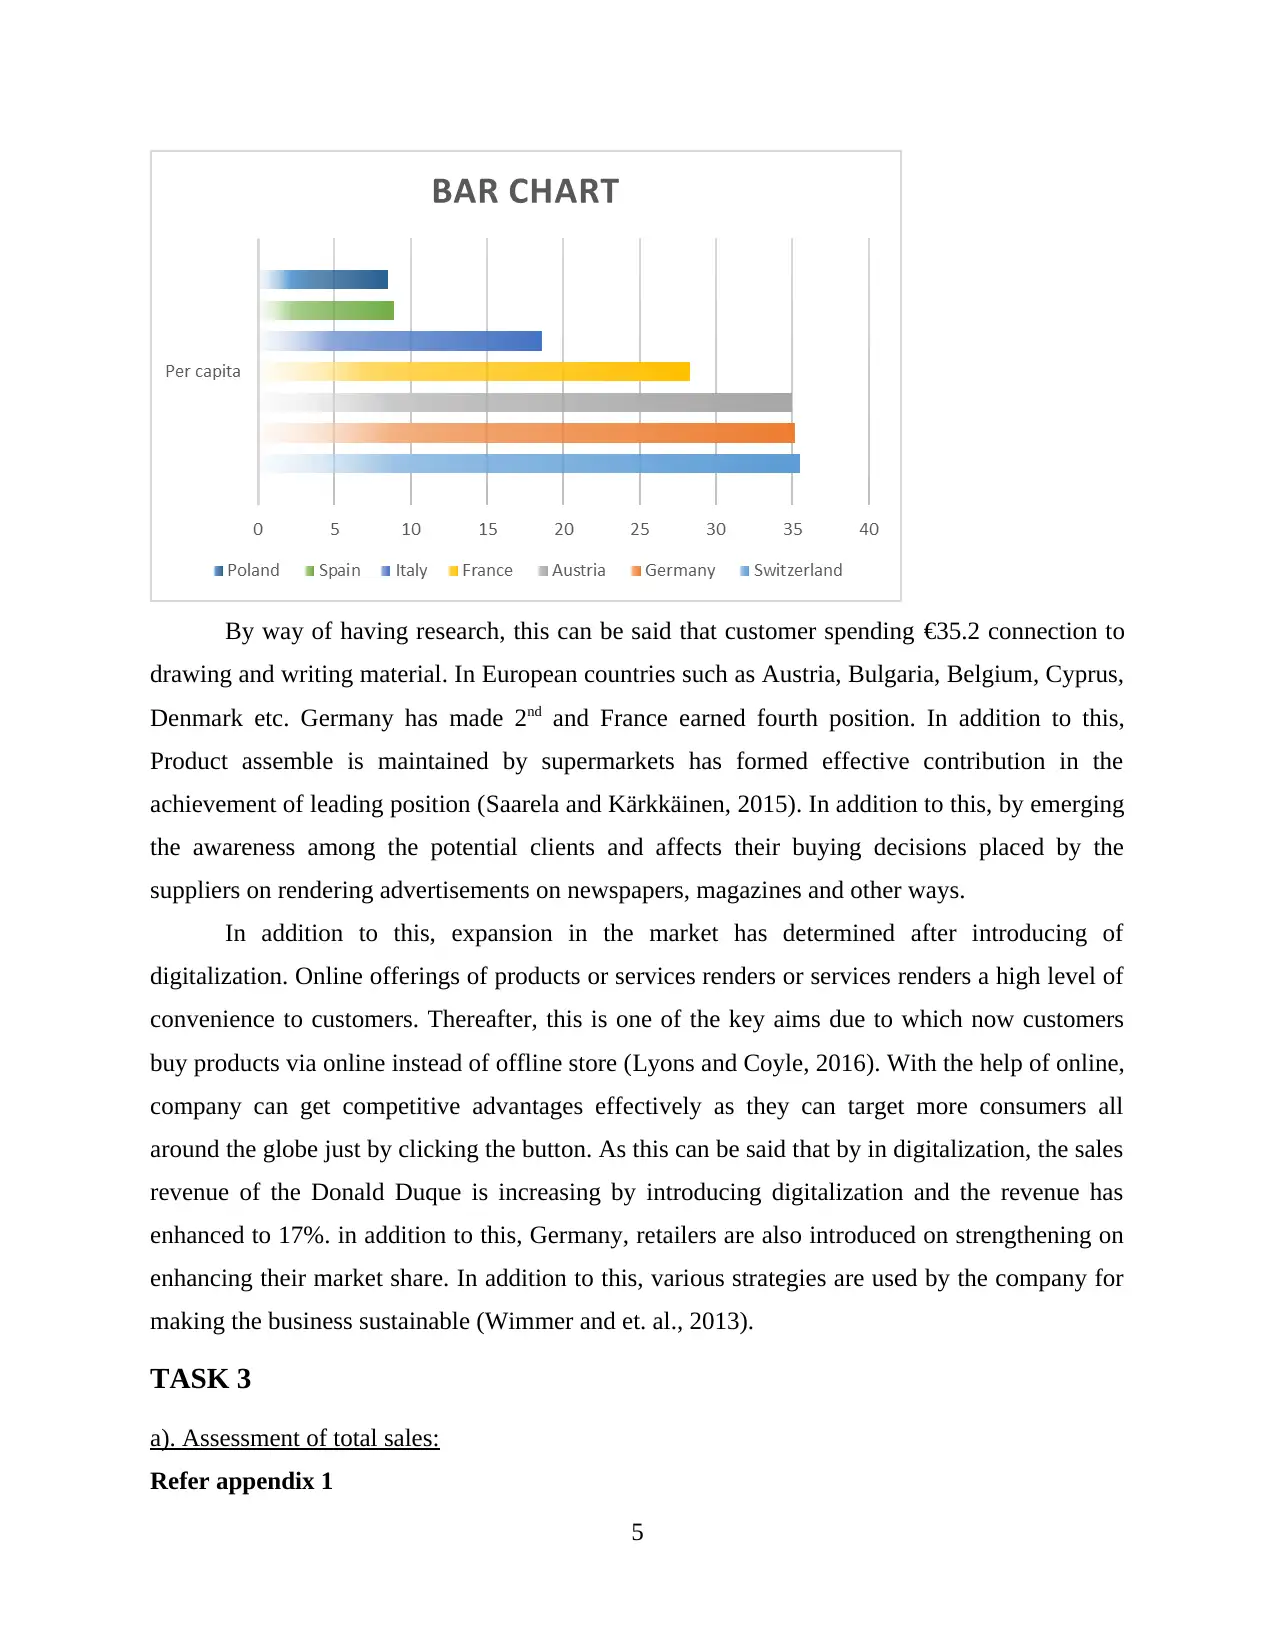
By way of having research, this can be said that customer spending €35.2 connection to
drawing and writing material. In European countries such as Austria, Bulgaria, Belgium, Cyprus,
Denmark etc. Germany has made 2nd and France earned fourth position. In addition to this,
Product assemble is maintained by supermarkets has formed effective contribution in the
achievement of leading position (Saarela and Kärkkäinen, 2015). In addition to this, by emerging
the awareness among the potential clients and affects their buying decisions placed by the
suppliers on rendering advertisements on newspapers, magazines and other ways.
In addition to this, expansion in the market has determined after introducing of
digitalization. Online offerings of products or services renders or services renders a high level of
convenience to customers. Thereafter, this is one of the key aims due to which now customers
buy products via online instead of offline store (Lyons and Coyle, 2016). With the help of online,
company can get competitive advantages effectively as they can target more consumers all
around the globe just by clicking the button. As this can be said that by in digitalization, the sales
revenue of the Donald Duque is increasing by introducing digitalization and the revenue has
enhanced to 17%. in addition to this, Germany, retailers are also introduced on strengthening on
enhancing their market share. In addition to this, various strategies are used by the company for
making the business sustainable (Wimmer and et. al., 2013).
TASK 3
a). Assessment of total sales:
Refer appendix 1
5
For identifying value of total sales, sales of entire items covered in products portfolio
which has been introduced. In addition to this, for reflecting a desirable sales level or trend
comparison of the existing year also done. During the year of 2015, 2016 and 2017, total sales is
assumed to be the €165000, €182000 & €178000 significantly. This has evaluated from
assessment which sales revenue of company is enhanced by 10.30% during 2016. while on the
other hand, during 2017, sales revenue of the Donald Duque is declined at (-2.20%) which
reflects the decreasing trends (Green and Salkind, 2016). This can be rightly observed that the
sales revenue can be optimised and the margin of profits requires to be emerged for unit requires
to be done.
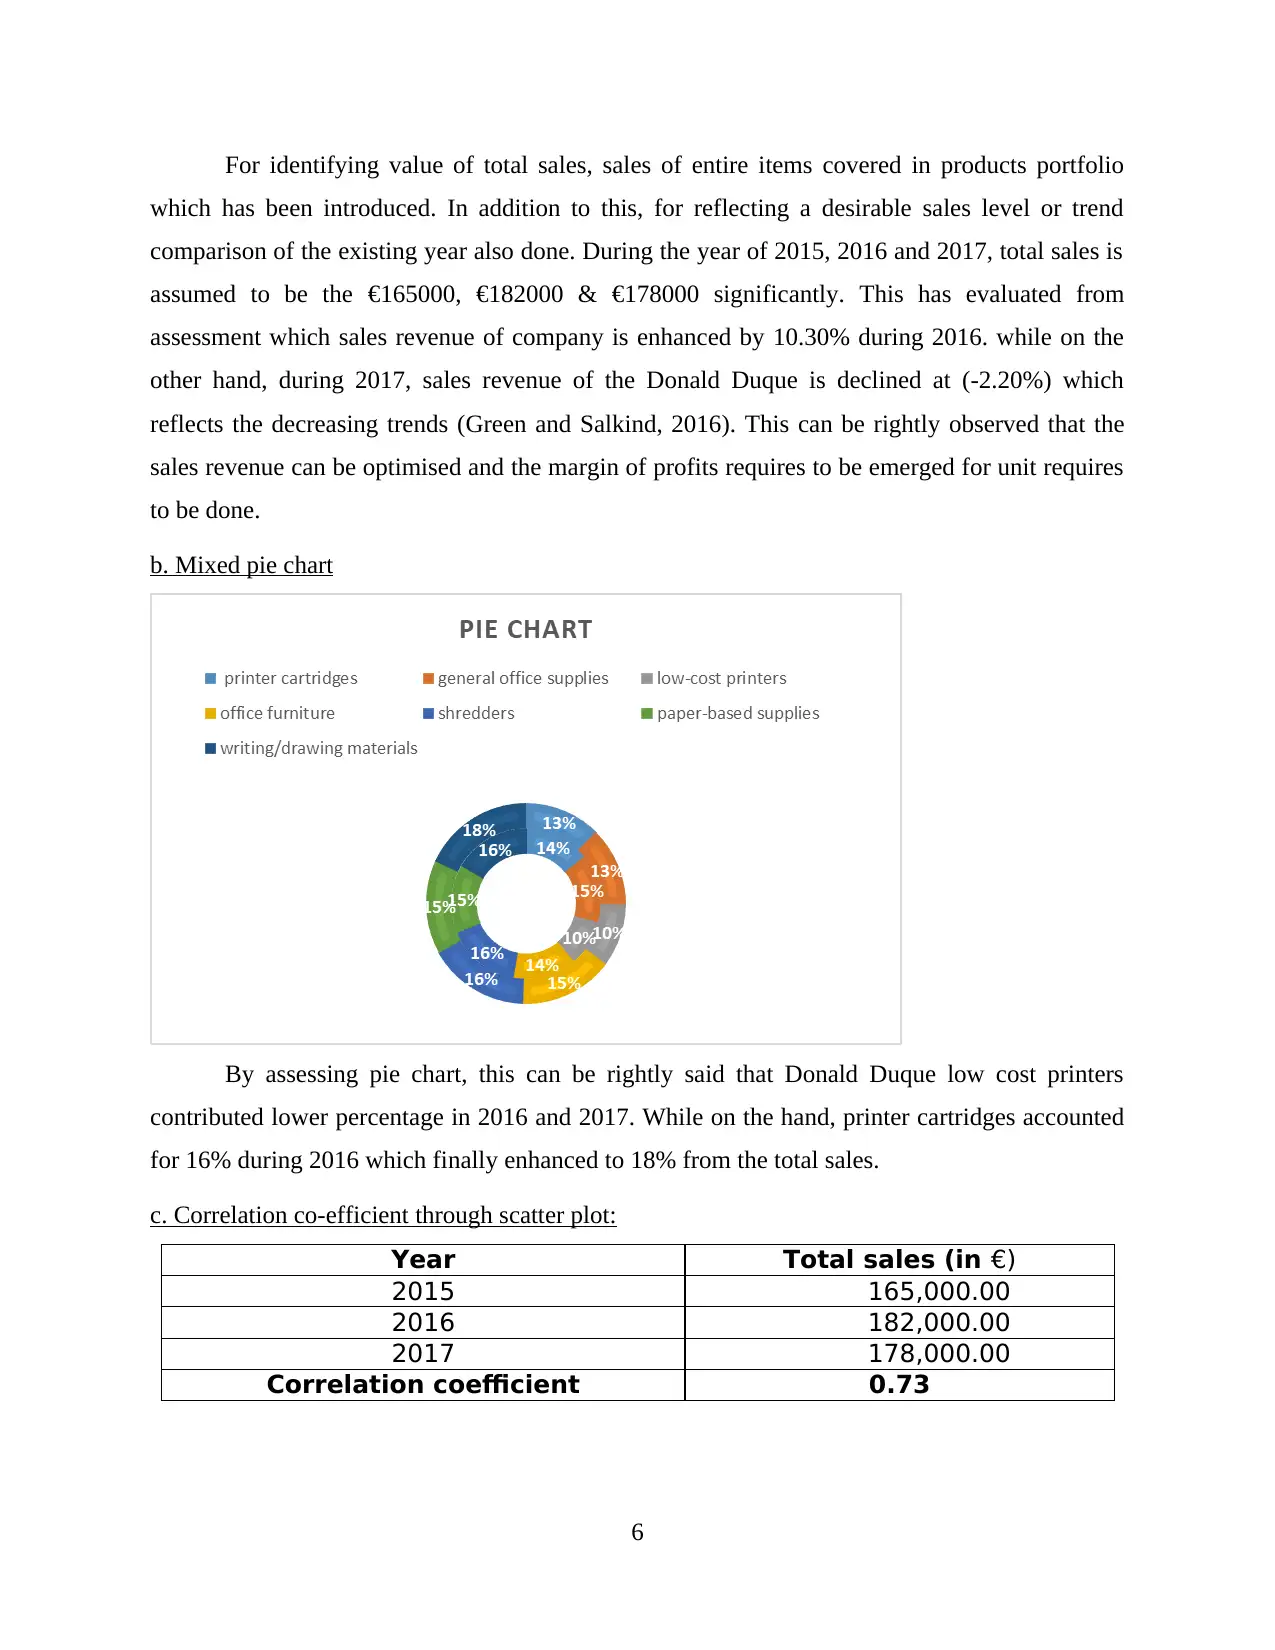
b. Mixed pie chart
By assessing pie chart, this can be rightly said that Donald Duque low cost printers
contributed lower percentage in 2016 and 2017. While on the hand, printer cartridges accounted
for 16% during 2016 which finally enhanced to 18% from the total sales.
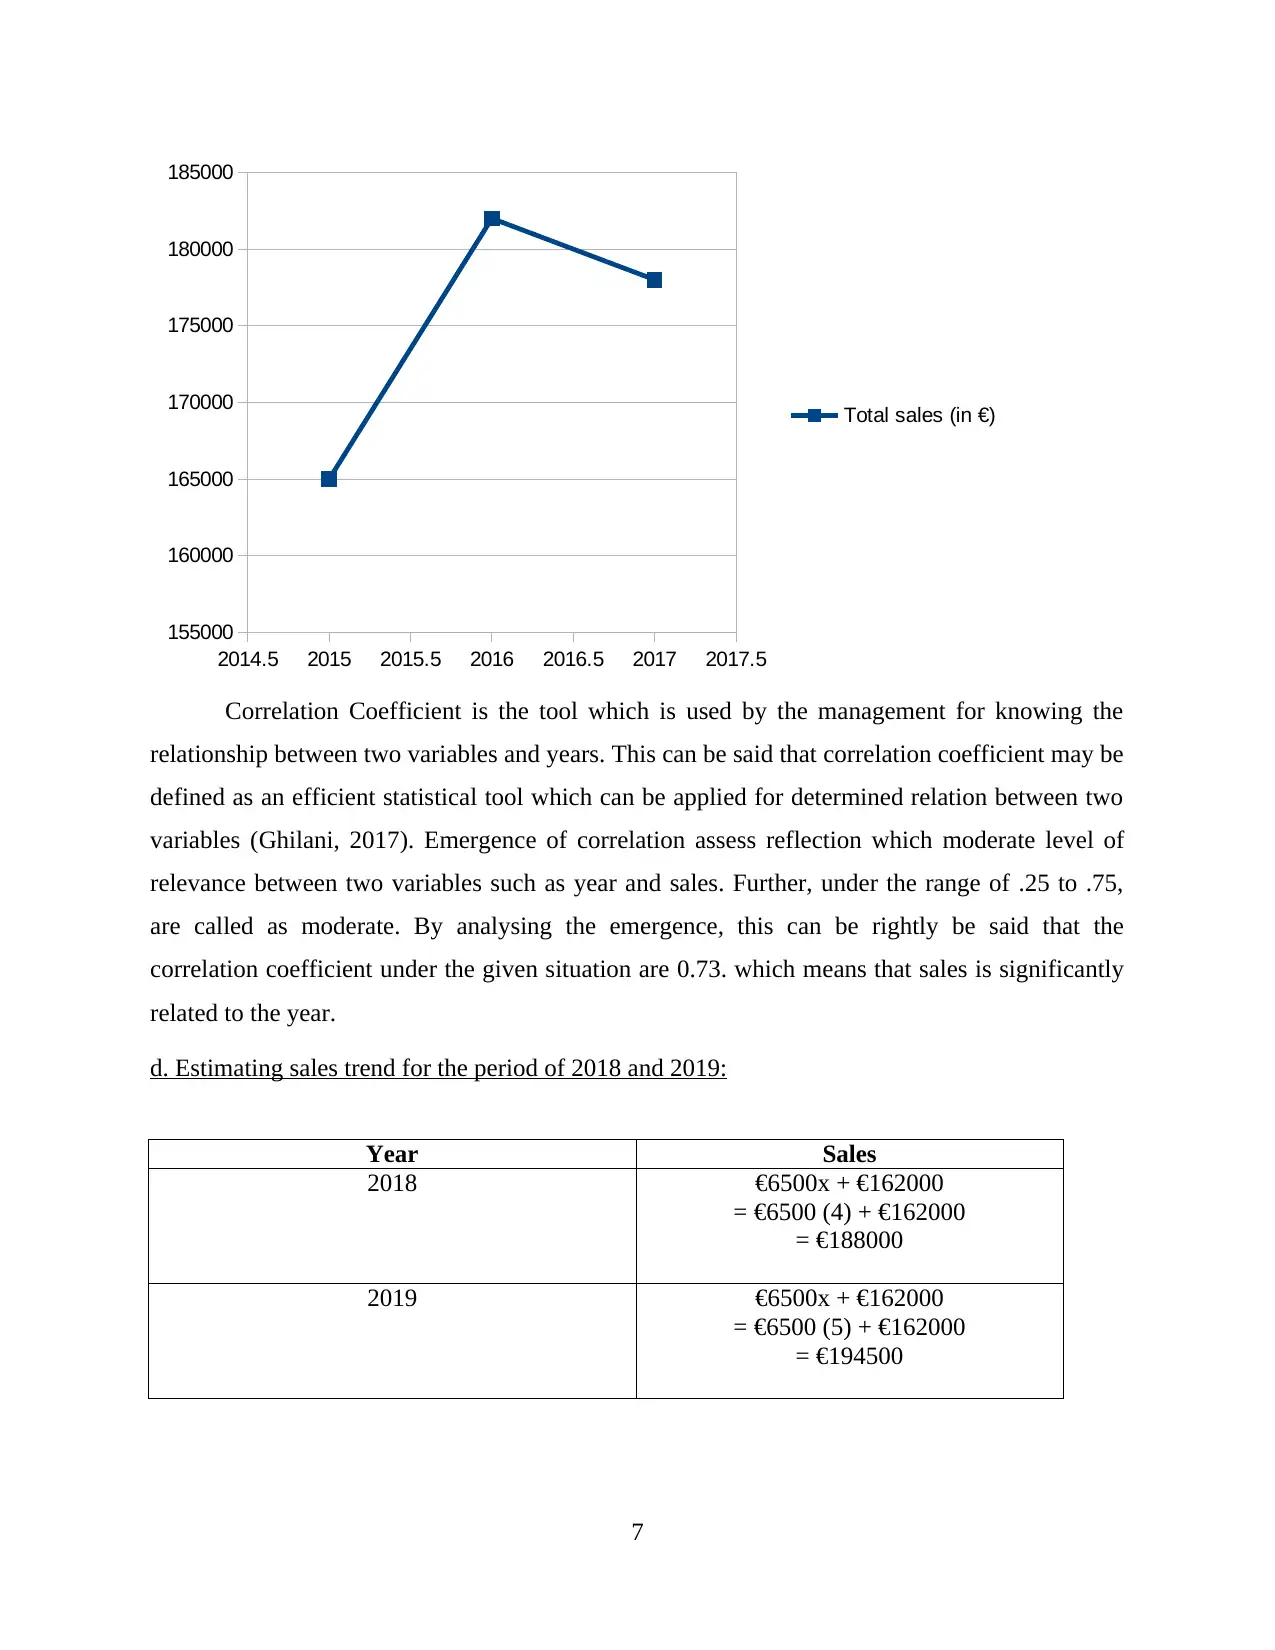
c. Correlation co-efficient through scatter plot:
Year Total sales (in €)
2015 165,000.00
2016 182,000.00
2017 178,000.00
Correlation coefficient 0.73
6
which has been introduced. In addition to this, for reflecting a desirable sales level or trend
comparison of the existing year also done. During the year of 2015, 2016 and 2017, total sales is
assumed to be the €165000, €182000 & €178000 significantly. This has evaluated from
assessment which sales revenue of company is enhanced by 10.30% during 2016. while on the
other hand, during 2017, sales revenue of the Donald Duque is declined at (-2.20%) which
reflects the decreasing trends (Green and Salkind, 2016). This can be rightly observed that the
sales revenue can be optimised and the margin of profits requires to be emerged for unit requires
to be done.
b. Mixed pie chart
By assessing pie chart, this can be rightly said that Donald Duque low cost printers
contributed lower percentage in 2016 and 2017. While on the hand, printer cartridges accounted
for 16% during 2016 which finally enhanced to 18% from the total sales.
c. Correlation co-efficient through scatter plot:
Year Total sales (in €)
2015 165,000.00
2016 182,000.00
2017 178,000.00
Correlation coefficient 0.73
6
⊘ This is a preview!⊘
Do you want full access?
Subscribe today to unlock all pages.
Trusted by 1+ million students worldwide
2014.5 2015 2015.5 2016 2016.5 2017 2017.5
155000
160000
165000
170000
175000
180000
185000
Total sales (in €)
Correlation Coefficient is the tool which is used by the management for knowing the
relationship between two variables and years. This can be said that correlation coefficient may be
defined as an efficient statistical tool which can be applied for determined relation between two
variables (Ghilani, 2017). Emergence of correlation assess reflection which moderate level of
relevance between two variables such as year and sales. Further, under the range of .25 to .75,
are called as moderate. By analysing the emergence, this can be rightly be said that the
correlation coefficient under the given situation are 0.73. which means that sales is significantly
related to the year.
d. Estimating sales trend for the period of 2018 and 2019:
Year Sales
2018 €6500x + €162000
= €6500 (4) + €162000
= €188000
2019 €6500x + €162000
= €6500 (5) + €162000
= €194500
7
Paraphrase This Document
Need a fresh take? Get an instant paraphrase of this document with our AI Paraphraser
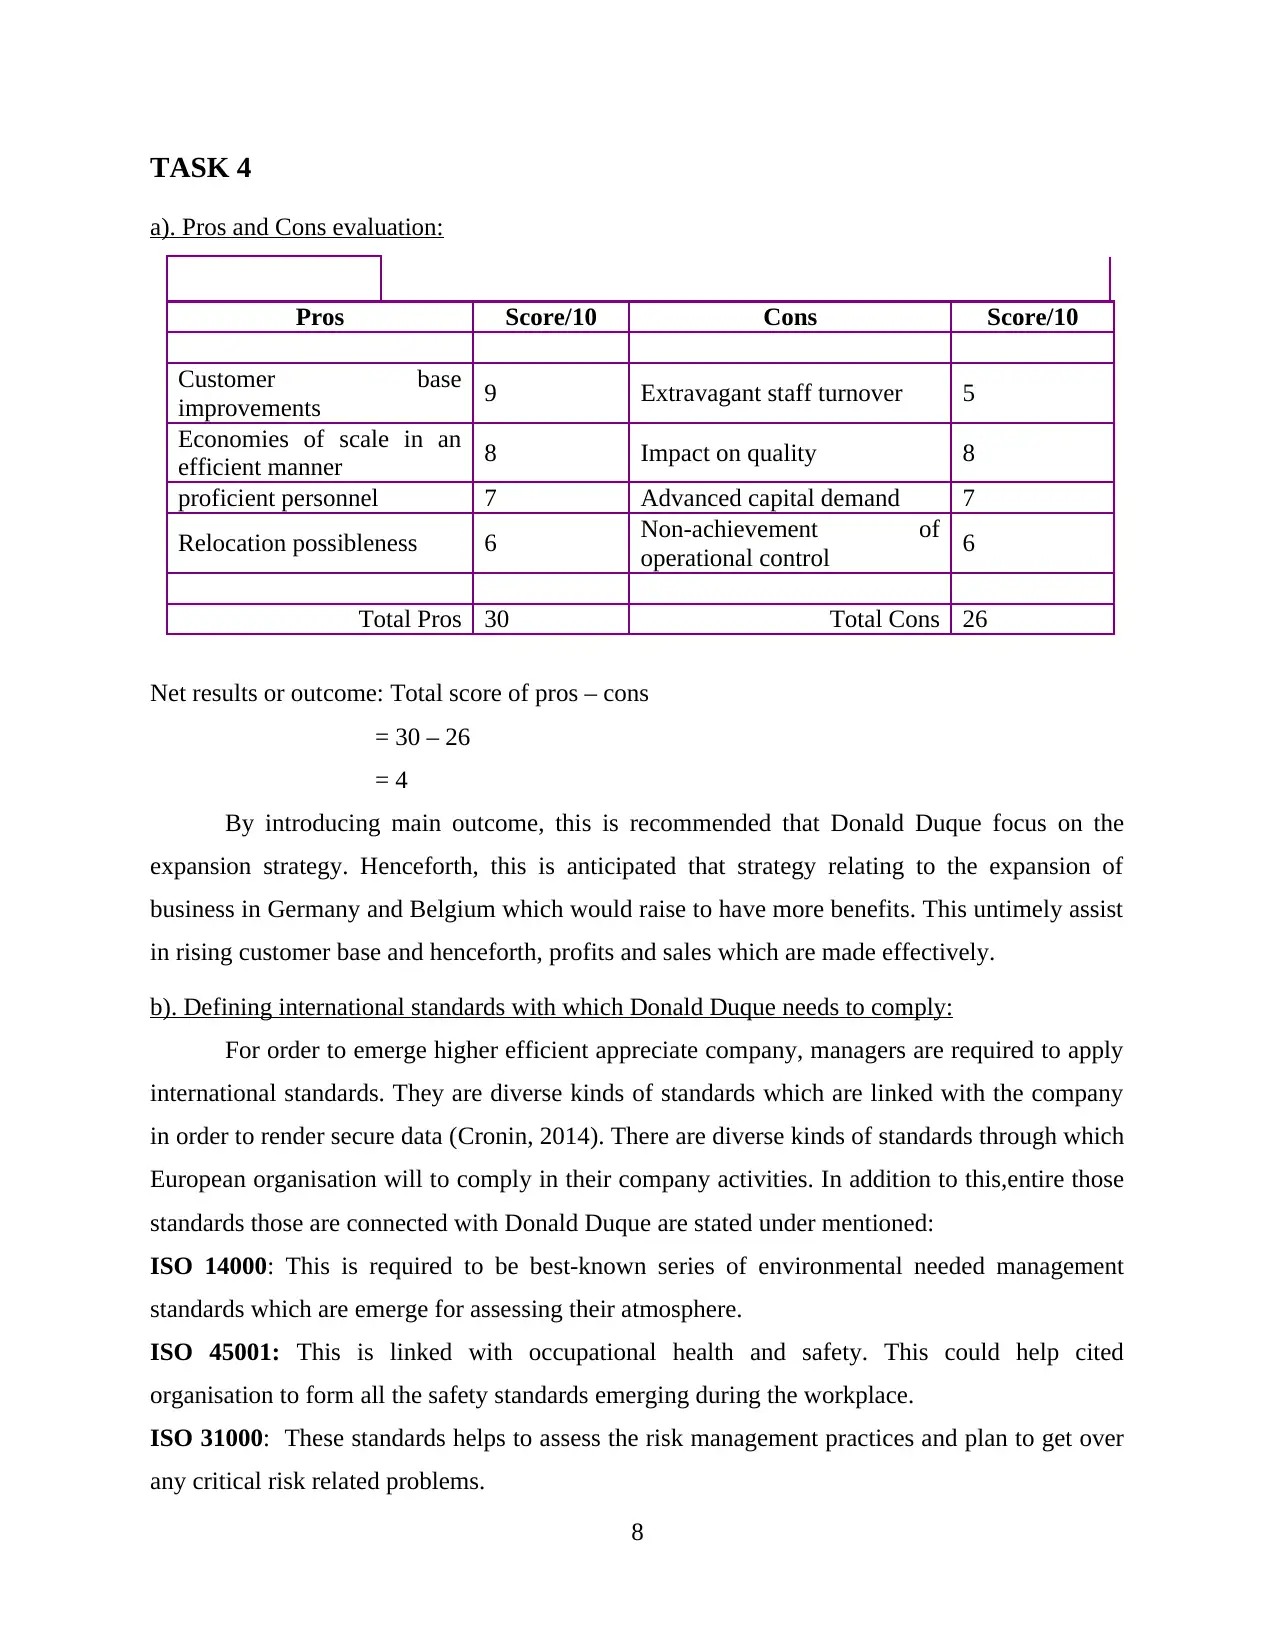
TASK 4
a). Pros and Cons evaluation:
Pros Score/10 Cons Score/10
Customer base
improvements 9 Extravagant staff turnover 5
Economies of scale in an
efficient manner 8 Impact on quality 8
proficient personnel 7 Advanced capital demand 7
Relocation possibleness 6 Non-achievement of
operational control 6
Total Pros 30 Total Cons 26
Net results or outcome: Total score of pros – cons
= 30 – 26
= 4
By introducing main outcome, this is recommended that Donald Duque focus on the
expansion strategy. Henceforth, this is anticipated that strategy relating to the expansion of
business in Germany and Belgium which would raise to have more benefits. This untimely assist
in rising customer base and henceforth, profits and sales which are made effectively.
b). Defining international standards with which Donald Duque needs to comply:
For order to emerge higher efficient appreciate company, managers are required to apply
international standards. They are diverse kinds of standards which are linked with the company
in order to render secure data (Cronin, 2014). There are diverse kinds of standards through which
European organisation will to comply in their company activities. In addition to this,entire those
standards those are connected with Donald Duque are stated under mentioned:
ISO 14000: This is required to be best-known series of environmental needed management
standards which are emerge for assessing their atmosphere.
ISO 45001: This is linked with occupational health and safety. This could help cited
organisation to form all the safety standards emerging during the workplace.
ISO 31000: These standards helps to assess the risk management practices and plan to get over
any critical risk related problems.
8
TASK 5
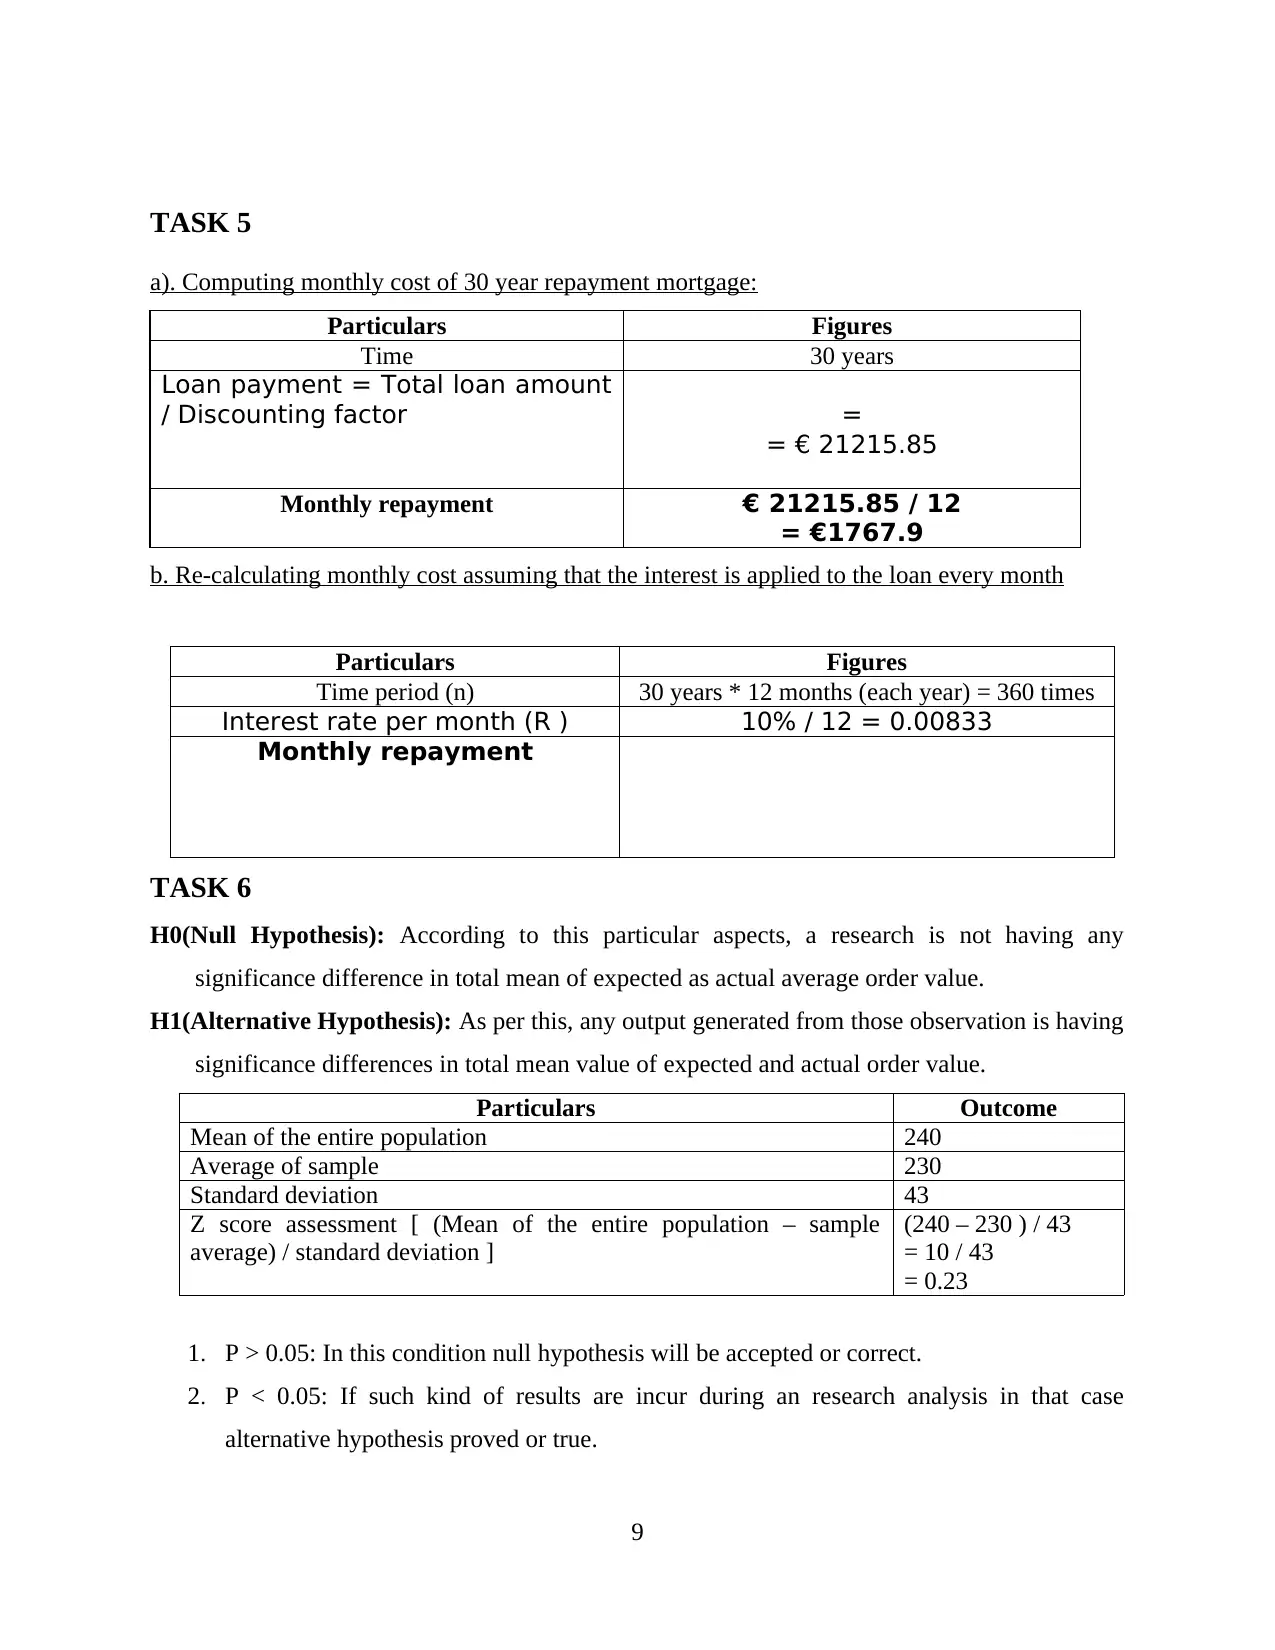
a). Computing monthly cost of 30 year repayment mortgage:
Particulars Figures
Time 30 years
Loan payment = Total loan amount
/ Discounting factor =
= € 21215.85
Monthly repayment € 21215.85 / 12
= €1767.9
b. Re-calculating monthly cost assuming that the interest is applied to the loan every month
Particulars Figures
Time period (n) 30 years * 12 months (each year) = 360 times
Interest rate per month (R ) 10% / 12 = 0.00833
Monthly repayment
TASK 6
H0(Null Hypothesis): According to this particular aspects, a research is not having any
significance difference in total mean of expected as actual average order value.
H1(Alternative Hypothesis): As per this, any output generated from those observation is having
significance differences in total mean value of expected and actual order value.
Particulars Outcome
Mean of the entire population 240
Average of sample 230
Standard deviation 43
Z score assessment [ (Mean of the entire population – sample
average) / standard deviation ]
(240 – 230 ) / 43
= 10 / 43
= 0.23
1. P > 0.05: In this condition null hypothesis will be accepted or correct.
2. P < 0.05: If such kind of results are incur during an research analysis in that case
alternative hypothesis proved or true.
9
⊘ This is a preview!⊘
Do you want full access?
Subscribe today to unlock all pages.
Trusted by 1+ million students worldwide
In accordance with this, it has been determine that P value from Z-score of 0.23 accounts
for .59 in significantly seen (Chambers, 2018). There are variable outcomes which indicate that
total p- value is more greater than the standard point of ranges such as 0.05. Henceforth, it has
been seen that total account which is aspected to examine overall positive responses. From the
above results, it has been analyse that there is significance difference and in that situation null
hypothesis is being accepted. On the basis of p value, it has been analyse that entailed that there
is no statistical difference which have been taken place among the mean value of expected and
actual order value. In accordance with that, it can be identify that total value of actual and
expected orders are floating into more similar direction (Germany – A Potential Stationery
Market, 2018).
TASK 7
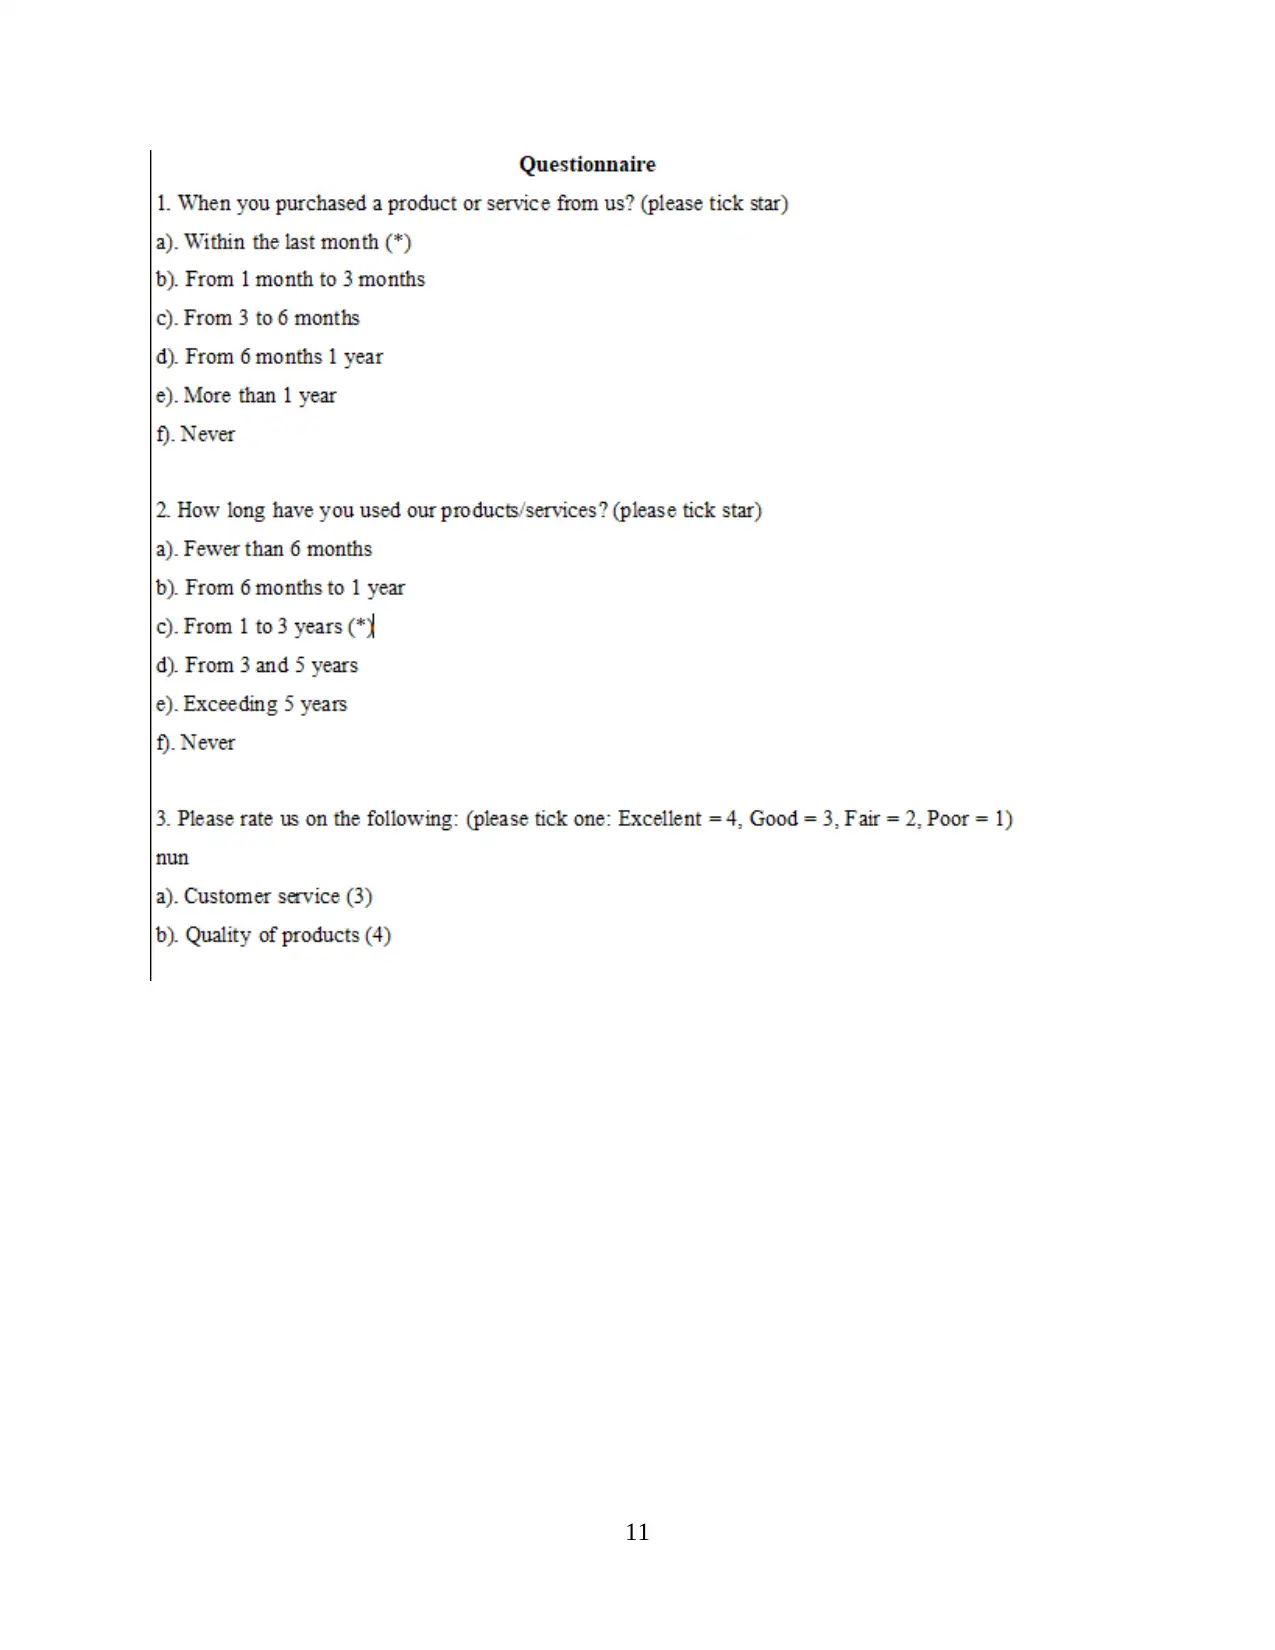
a). Advice for improvement:
As per the below mentioned questionnaire, management of the company can take
independent decisions relating to the expansion of business program. Here, 20 respondents were
taken from the market and below-mentioned questionnaire is rendered to them for analysing
effective decision-making.Germany – A Potential Stationery Market. 2018.MGCC Perspective.
2016
10
for .59 in significantly seen (Chambers, 2018). There are variable outcomes which indicate that
total p- value is more greater than the standard point of ranges such as 0.05. Henceforth, it has
been seen that total account which is aspected to examine overall positive responses. From the
above results, it has been analyse that there is significance difference and in that situation null
hypothesis is being accepted. On the basis of p value, it has been analyse that entailed that there
is no statistical difference which have been taken place among the mean value of expected and
actual order value. In accordance with that, it can be identify that total value of actual and
expected orders are floating into more similar direction (Germany – A Potential Stationery
Market, 2018).
TASK 7
a). Advice for improvement:
As per the below mentioned questionnaire, management of the company can take
independent decisions relating to the expansion of business program. Here, 20 respondents were
taken from the market and below-mentioned questionnaire is rendered to them for analysing
effective decision-making.Germany – A Potential Stationery Market. 2018.MGCC Perspective.
2016
10
Paraphrase This Document
Need a fresh take? Get an instant paraphrase of this document with our AI Paraphraser
11
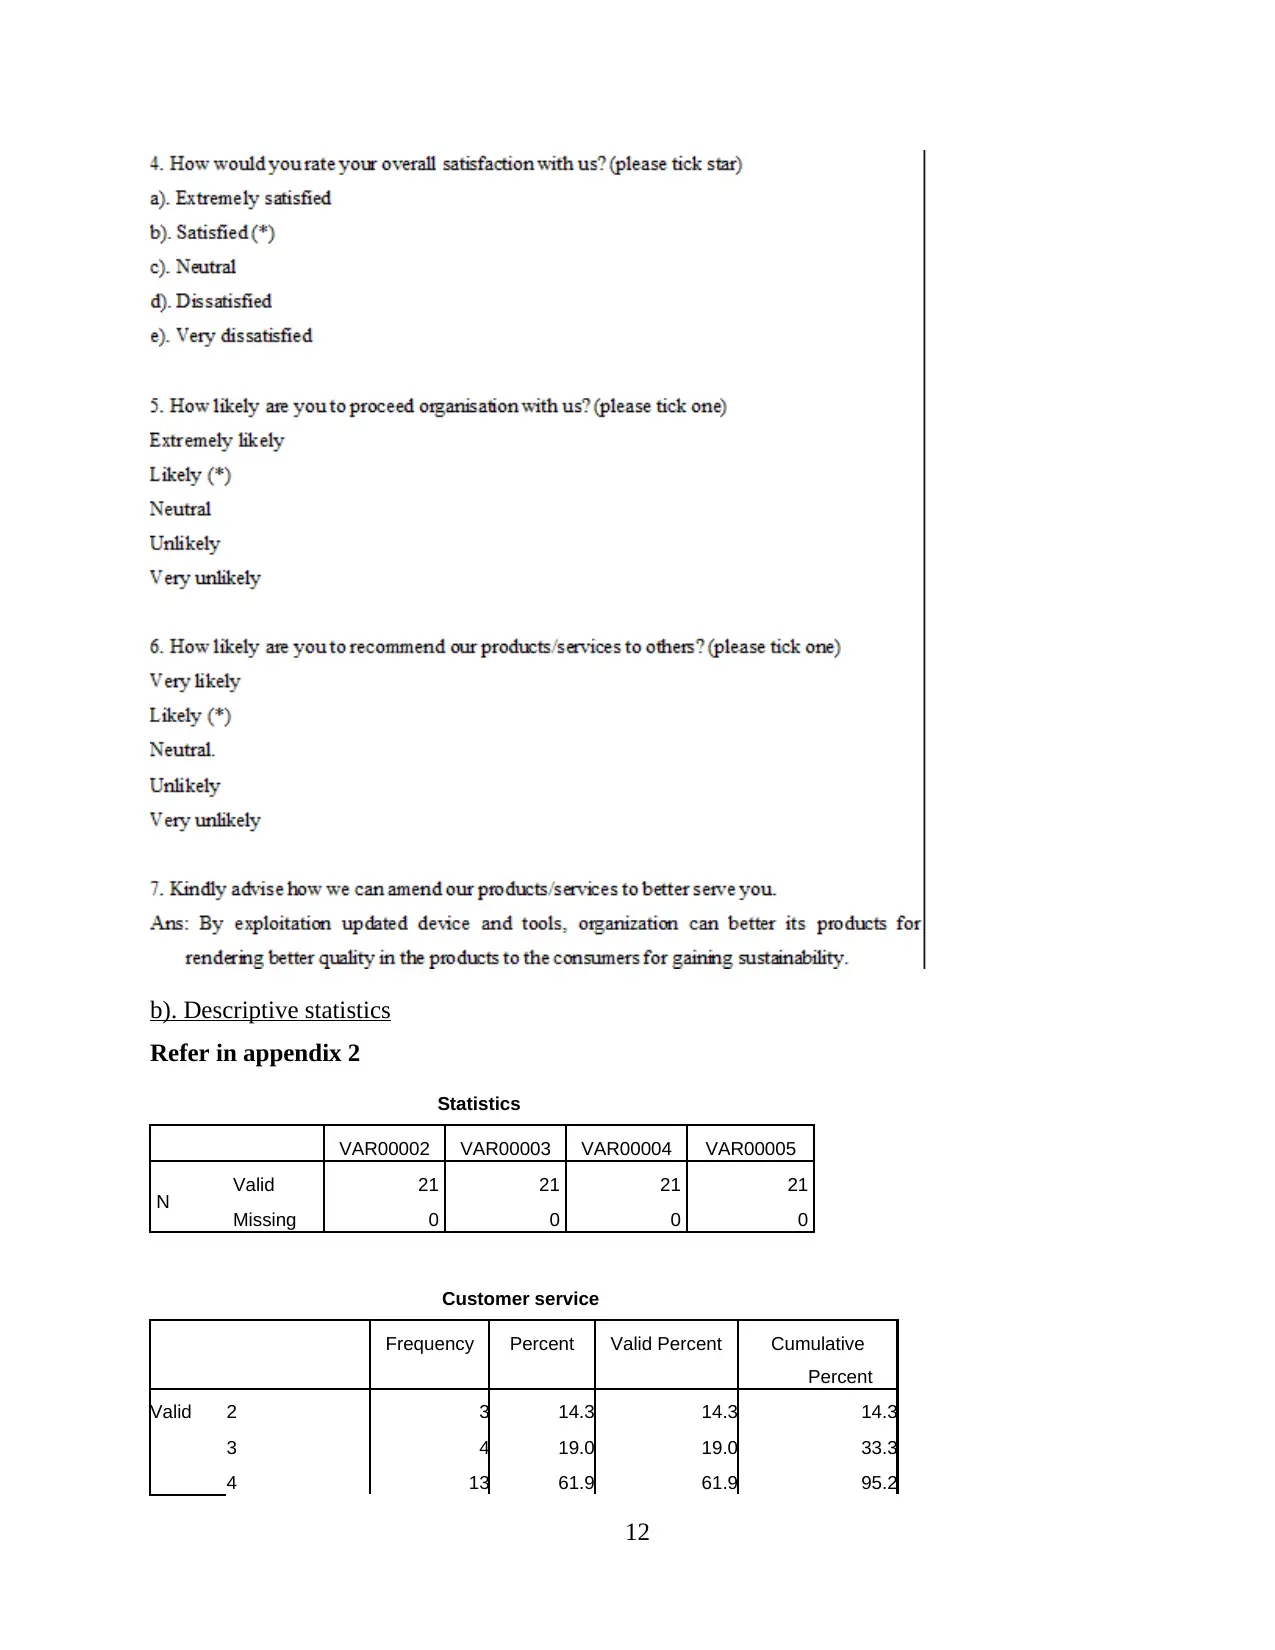
b). Descriptive statistics
Refer in appendix 2
Statistics
VAR00002 VAR00003 VAR00004 VAR00005
N Valid 21 21 21 21
Missing 0 0 0 0
Customer service
Frequency Percent Valid Percent Cumulative
Percent
Valid 2 3 14.3 14.3 14.3
3 4 19.0 19.0 33.3
4 13 61.9 61.9 95.2
12
Refer in appendix 2
Statistics
VAR00002 VAR00003 VAR00004 VAR00005
N Valid 21 21 21 21
Missing 0 0 0 0
Customer service
Frequency Percent Valid Percent Cumulative
Percent
Valid 2 3 14.3 14.3 14.3
3 4 19.0 19.0 33.3
4 13 61.9 61.9 95.2
12
⊘ This is a preview!⊘
Do you want full access?
Subscribe today to unlock all pages.
Trusted by 1+ million students worldwide
1 out of 19
Related Documents


Your All-in-One AI-Powered Toolkit for Academic Success.
+13062052269
info@desklib.com
Available 24*7 on WhatsApp / Email
![[object Object]](/_next/static/media/star-bottom.7253800d.svg)
Unlock your academic potential
Copyright © 2020–2026 A2Z Services. All Rights Reserved. Developed and managed by ZUCOL.