Comprehensive Data Analysis Report: Durham Humidity Study

Verified

Added on  2023/06/14

|10
|1619
|242
Report
AI Summary
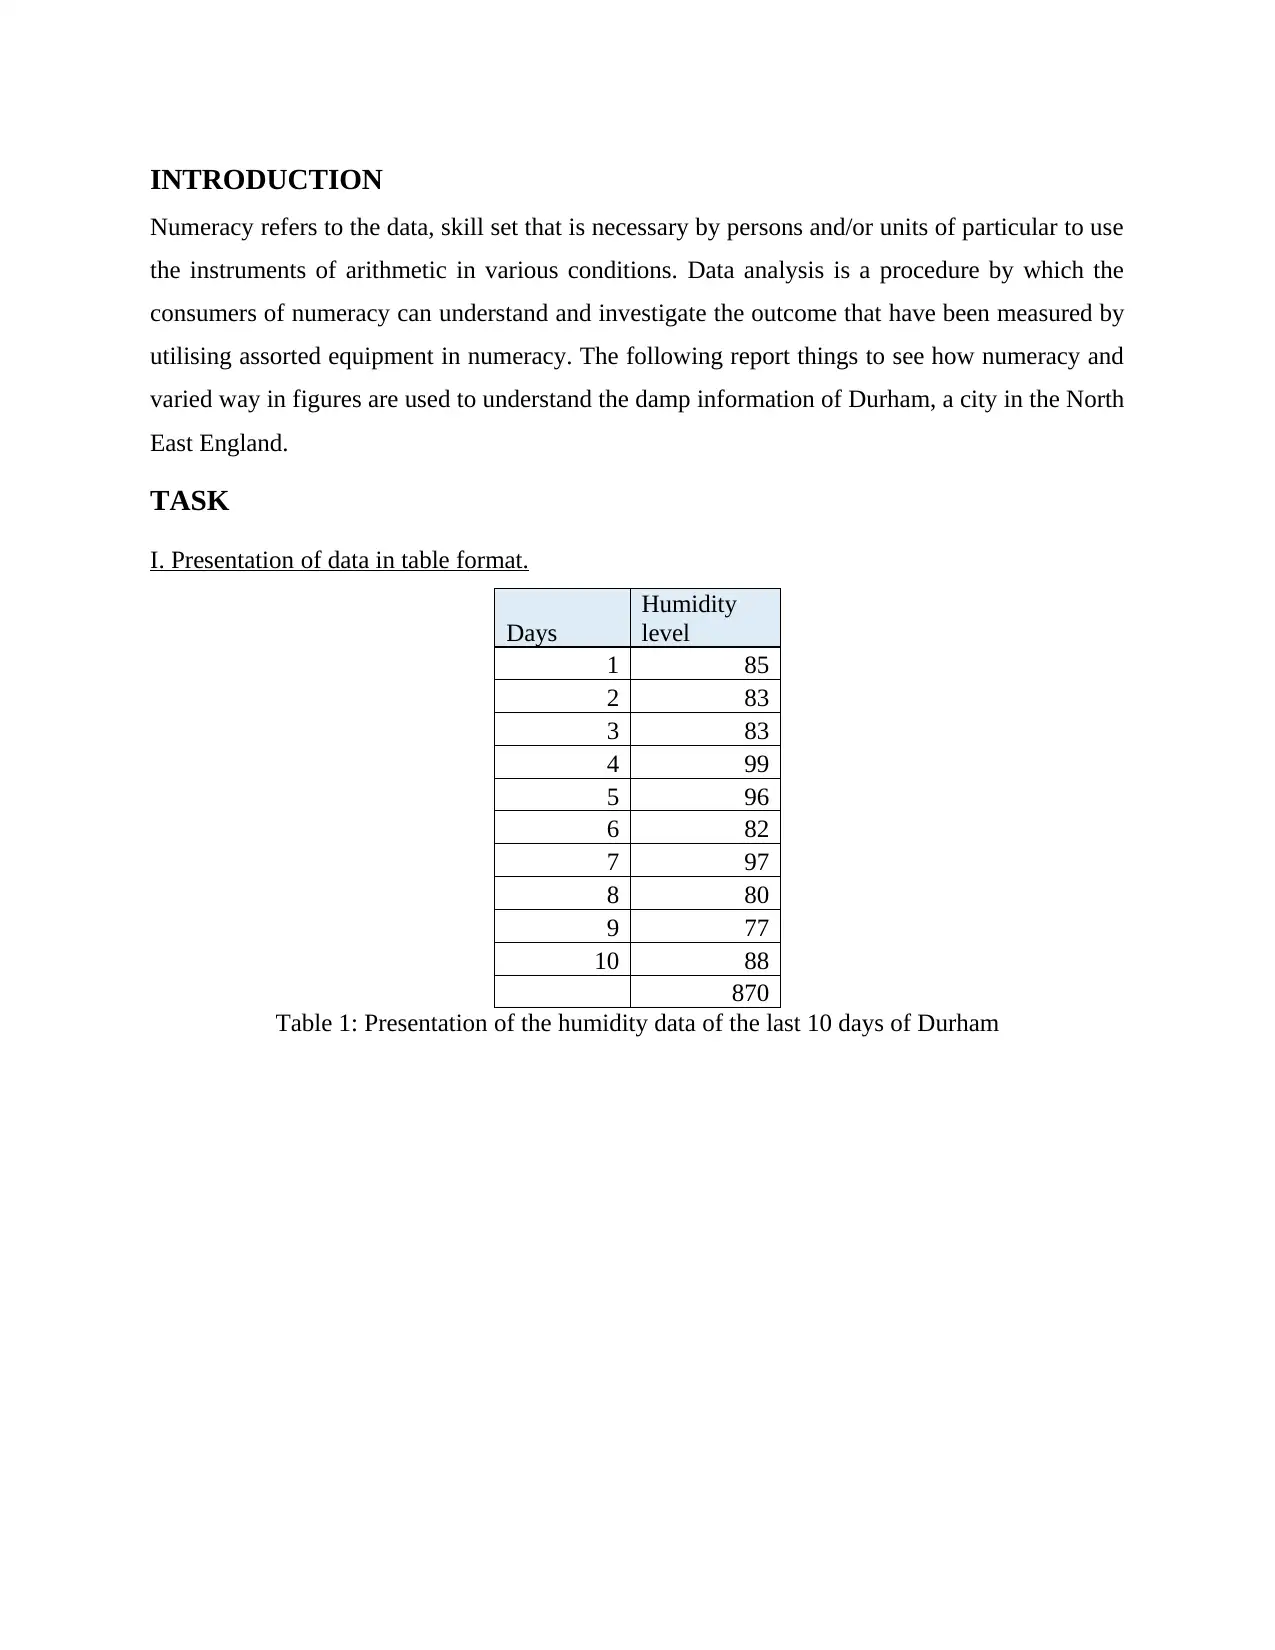
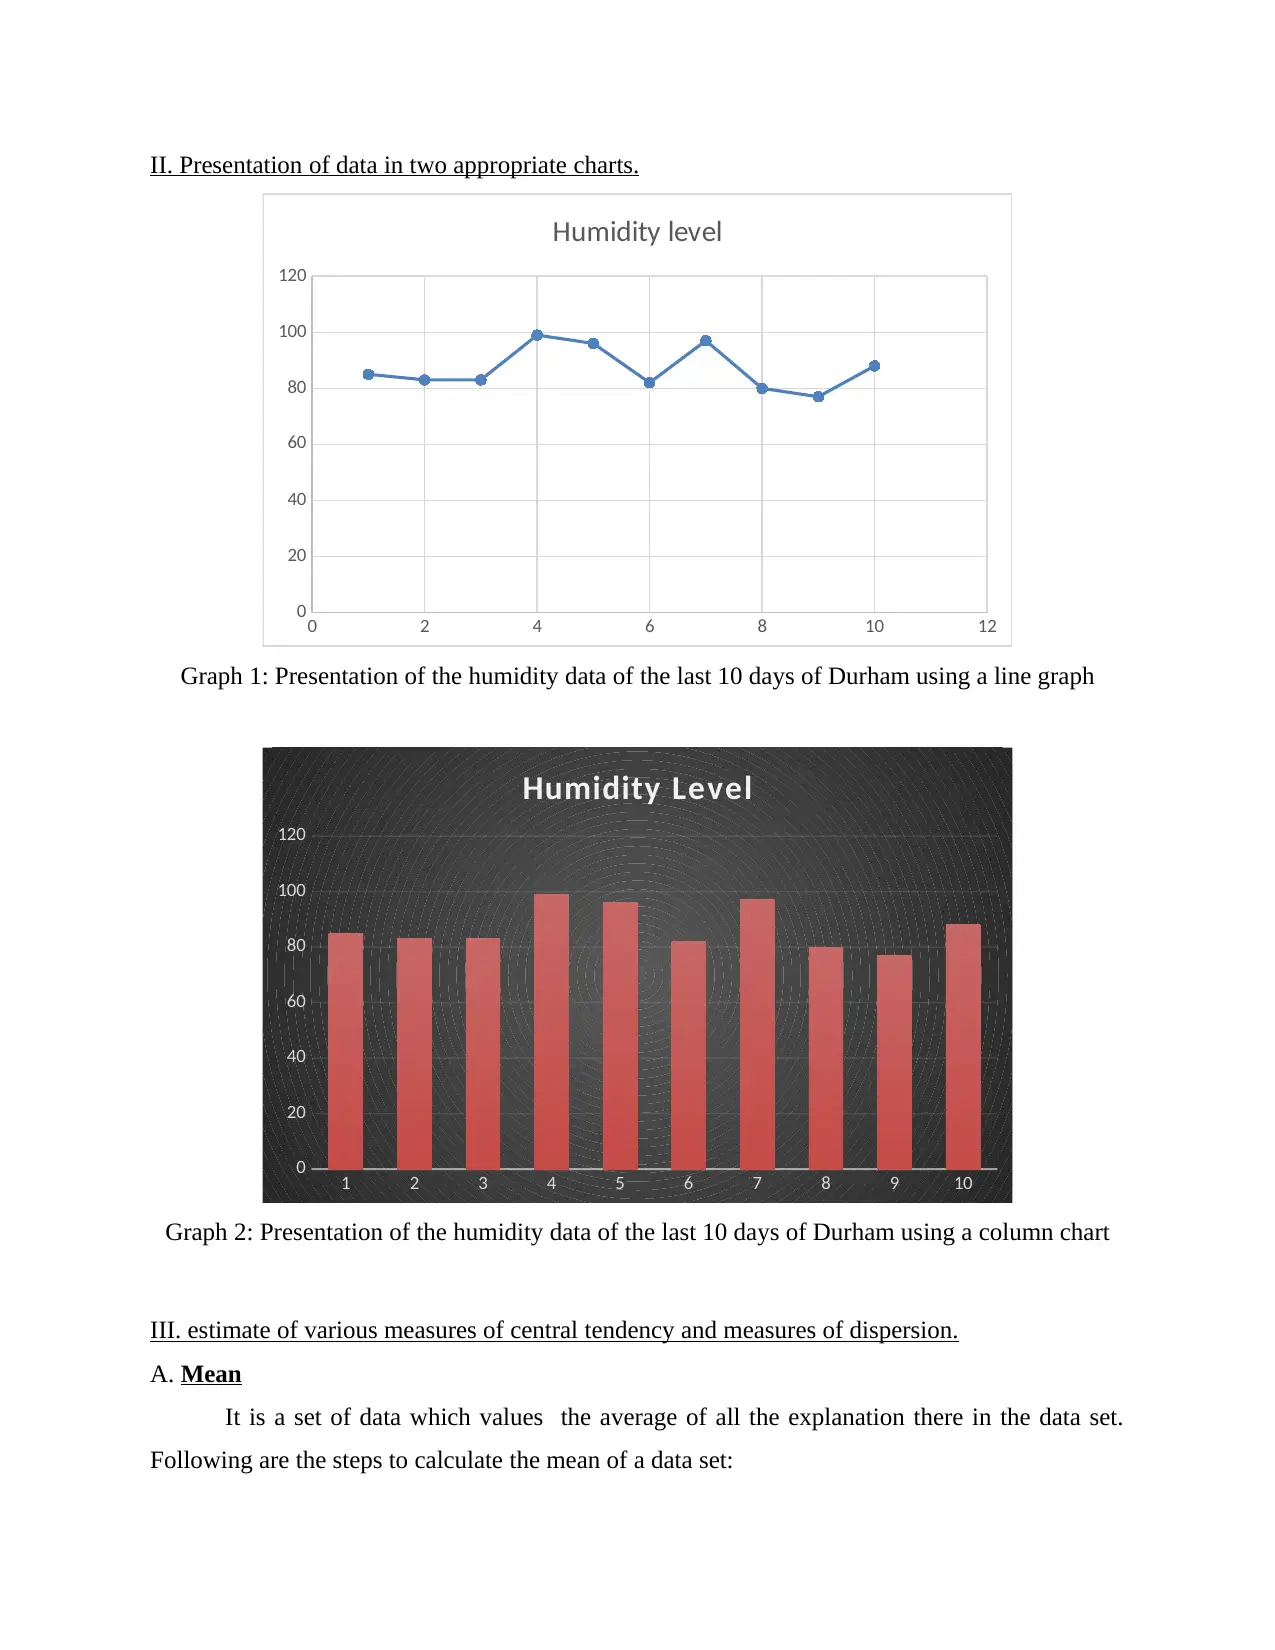
This report presents a comprehensive analysis of humidity data collected in Durham, North East England, employing various statistical methods to derive meaningful insights. The analysis includes data presentation in tabular and chart formats (line and column charts), calculation of measures of central tendency (mean, median, mode), measures of dispersion (range, standard deviation), and the application of a linear forecasting model to predict future humidity levels. The report details the steps involved in calculating each statistical measure and provides interpretations of the results, such as the mean humidity being 87, the median being 83, and the mode being 83. The linear forecasting model predicts humidity levels for the 11th and 13th days based on past data, demonstrating the practical application of data analysis in understanding and predicting environmental conditions. The study concludes that numeracy and data analysis are essential for interpreting and understanding data effectively.
Document Page
Data Analysis
tabler-icon-diamond-filled.svg

Secure Best Marks with AI Grader

Need help grading? Try our AI Grader for instant feedback on your assignments.
Document Page
Contents
INTRODUCTION...........................................................................................................................3
TASK...............................................................................................................................................3
I. Presentation of data in table format..........................................................................................3
II. Presentation of data in two appropriate charts........................................................................4
III. Calculation of different measures of central tendency and measures of dispersion..............4
IV. Calculation of different elements of linear forecasting model..............................................7
.........................................................................................................................................................7
CONCLUSION................................................................................................................................8
REFERENCES................................................................................................................................9
Document Page
INTRODUCTION
Numeracy refers to the data, skill set that is necessary by persons and/or units of particular to use
the instruments of arithmetic in various conditions. Data analysis is a procedure by which the
consumers of numeracy can understand and investigate the outcome that have been measured by
utilising assorted equipment in numeracy. The following report things to see how numeracy and
varied way in figures are used to understand the damp information of Durham, a city in the North
East England.
TASK
I. Presentation of data in table format.
Days
Humidity
level
1 85
2 83
3 83
4 99
5 96
6 82
7 97
8 80
9 77
10 88
870
Table 1: Presentation of the humidity data of the last 10 days of Durham
Document Page
II. Presentation of data in two appropriate charts.
0 2 4 6 8 10 12
0
20
40
60
80
100
120
Humidity level
Graph 1: Presentation of the humidity data of the last 10 days of Durham using a line graph
1 2 3 4 5 6 7 8 9 10
0
20
40
60
80
100
120
Humidity Level
Graph 2: Presentation of the humidity data of the last 10 days of Durham using a column chart
III. estimate of various measures of central tendency and measures of dispersion.
A. Mean
It is a set of data which values the average of all the explanation there in the data set.
Following are the steps to calculate the mean of a data set:
tabler-icon-diamond-filled.svg

Secure Best Marks with AI Grader

Need help grading? Try our AI Grader for instant feedback on your assignments.
Document Page
Step 1: recognize all the interpretation in a statistics set.
Step 2: adding up of all the clarification is prepared here.
Step 3: conclude the number of inspection in the figures set.
Step 4: Put the value resolute in the method and analyse the signify.
Mean = Sum of all the Observations / Number of Observations
Mean of the Humidity data of Durham = 85 + 83 + 83 + 99 + 96 + 82 + 97 + 80 + 77 + 88 / 10
= 870 / 10
= 87
B. Median
It is a set of measurements which is coming in the appropriate center of the data set. It is
basically examine after structure of information of set which counted into minimum or
maximum order. Here are the instructions which are used in calculation of median:
Step 1: The first stage in the computation of median is to organize the explanation in data set in
rising order.
Step 2: determine the number of interpretation either in odd or even.
Step 3: If the number of watching is even, the method which will be utilised to analyse the
median is (N/2)
Step 4: If the number of comments is odd, the method which will be utilsed in measuring of
median is ( ( N + 1 ) / 2)
Step 5: After keeping the explanation, the outcome figure is the term which is the median of the
interpretation.
85, 83, 83, 99, 96, 82, 97, 80, 77, 88
77, 80, 82, 83, 83, 85, 88, 96, 97, 99
Median of the Humidity data of Durham = 10 / 2
Median of the Humidity data of Durham = 5th Term
That is 83.
C. Mode
This compute of central tendency refers to the value which has been most take place in a
data set. The steps to analyse mode of a data set is:
Step 1: resolve the data set and categorize it.
Document Page
Step 2: Check out all the different values.
Step 3: count all the values and their frequencies occur in the data.
Step 4: The value with the most occurred worth will be measured as the Mode of the given data
set.
77, 80, 82, 83, 83, 85, 88, 96, 97, 99
Mode of the Humidity data of Durham = 83 as it is occurring two times in the data set.
D. Range
Range refers to one of the measure of diffusion which is discover by the highest and the
lowest value of the data set . Assuming the reach is little, it addresses the central tendency and in
the event that the reach is enormous then it doesn't address the central tendency .
Following are the steps to calculate the Range:
Step 1: organise every one of the deatil available.
Step 2: Then determine the maximum and the minimum charge.
Step 3: minus the minimum value from the bigggest.
Step 4: The value we get after the third step is the Range.
Range = Maximum observation – Minimum Observation.
Range of the Humidity data of Durham = 99 – 77
= 22
E. Standard Deviation
It is the detachment of the variable from the focal tendency, which is for the most part
mean (Kelleher, and Tierney, 2018). Following are the steps to calculate Standard deviation.
Step 1: initially we have to find the mean of the data given.
Step 2: For every scrutiny find out the distinction between the value and the mode of the data.
Step 3: Sum of all the values of step 2.
Step 4: partition by number of terms (n).
Step 5: Finally, Square root the result of step 4.
Standard Deviation of the Humidity data of Durham= √ (xi – μ) 2 / N
= √ (568.4) / 10
= √ 56.84
= 7.53
Document Page
IV. Calculation of different elements of linear forecasting model.
Linear Forecasting Model predicts the Future Values based on the past values in a linear
y = mx + c
where, 'y' is the dependent variable
'mx' is the independent variable
'c' is the constant
Following are the steps to calculate m:
Step 1: Multiply both the factors X and Y which are named as days and clamminess
Step 2: Do the addition of the above calculation.
Step 3: Sum of the x variable and y factor independently.
Step 4: Then multiply both the factors.
Step 5: compute ( x) 2 at the end put the values in the method.
Step 6: The consequential value is the value of 'm'.
m = (10 * 4760) – (55 * 870) / (10 * 385) – (385)
m= 47600 – 47850 / 3850 – 385
m = −250 / 3465
m= −0.072
Following are the steps to calculate C:
Step 1: First of all, estimate the sum of 'y' variable.
Step 2: Then stature out the sum of 'x' variable.
Step 3: at last part it with the sum of 'N'.
Step 4: The assessment imitative from Step 3 is the value of 'c'.
tabler-icon-diamond-filled.svg

Paraphrase This Document

Need a fresh take? Get an instant paraphrase of this document with our AI Paraphraser
Document Page
C= 870 - (−0.072 * 55) / 10
C= 870 - (−3.96) / 10
C= 873.96 / 10
C= 87.396
Humidity on Day 11th :
m= −0.072, c= 87.396, x= 11
y= mx + c
y = -0.072 * 11 + 87.396
y= −0.792 + 87.396
y= 86.604
Humidity on 11th Day = 86.604 %
Humidity on Day 13th :
m= −0.072, c= 87.396, x= 13
y= mx + c
y = -0.072 * 13 + 87.396
y= −0.936+ 87.396
y= 86.46
Humidity on 11th Day = 86.46 %
CONCLUSION
From the above interpretation, it can be evaluated that the numeracy and data analysis is a major
feature in the ground of study. persons need to control full education about the instruments of
statistics as these helps in the analysing and understanding of the data when presented. The
Document Page
above report has taken the humidity data of Durham to use diverse tools and interpret how these
are used to examine the data.
Document Page
REFERENCES
Books and Journals
Keshtegar, B., and et., al., 2020. Reliability analysis of stiffened aircraft panels using adjusting mean
value method. AIAA Journal, 58(12), pp.5448-5458.
Knyazev, G.G., and et., al., 2020. The default mode network in self-and other-referential processing:
effect of cultural values. Culture and Brain, pp.1-17.
Elliott, V., 2018. Thinking about the coding process in qualitative data analysis. The Qualitative
Report, 23(11), pp.2850-2861.
Cistulli, P.A., and et., al.,, 2019. Short-term CPAP adherence in obstructive sleep apnea: a big data
analysis using real world data. Sleep medicine, 59, p.114.
chevron_up_icon
1 out of 10
circle_padding
hide_on_mobile
zoom_out_icon
logo.png

Your All-in-One AI-Powered Toolkit for Academic Success.

Available 24*7 on WhatsApp / Email

[object Object]