Data Analytics II: Obama-Clinton Election & NICU Data Case Study

Verified

Added on  2023/04/20

|25
|2842
|93
Case Study
AI Summary
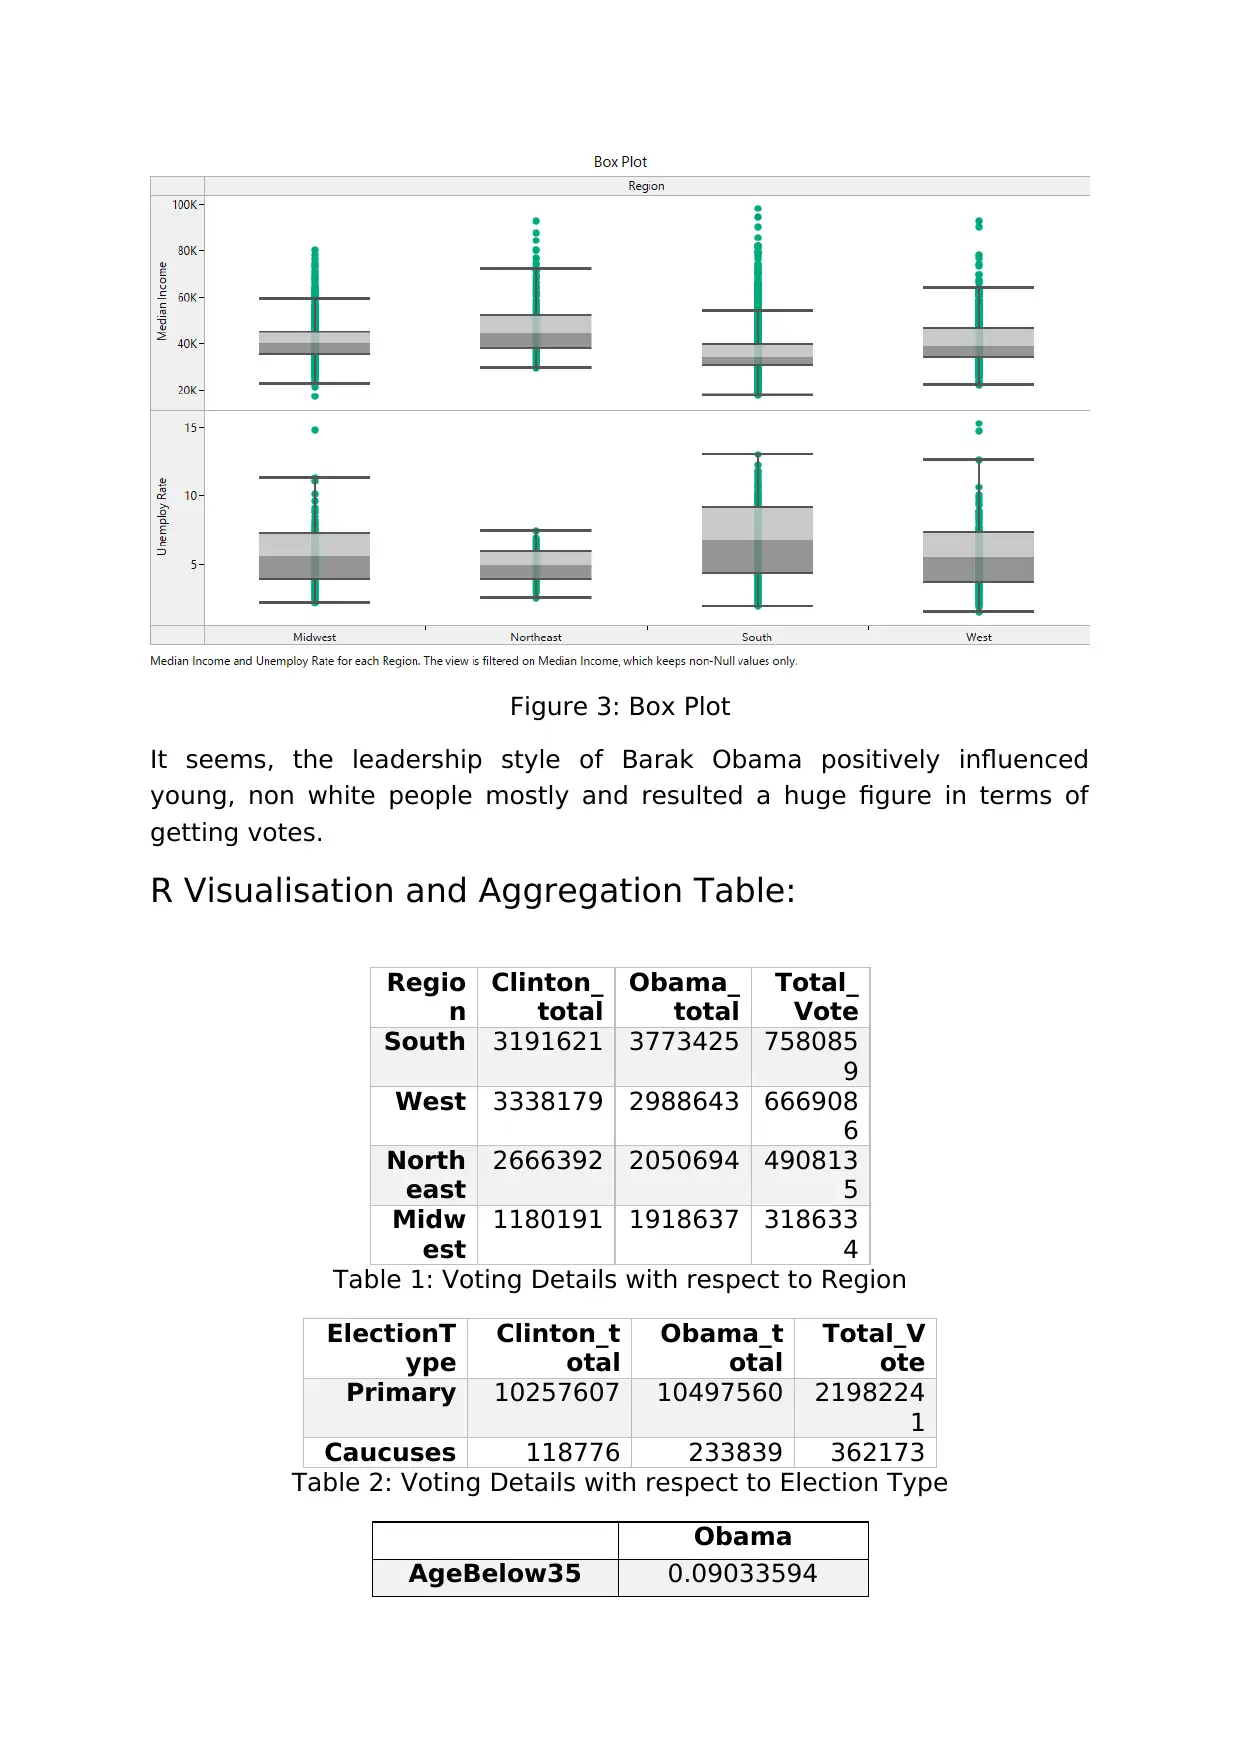
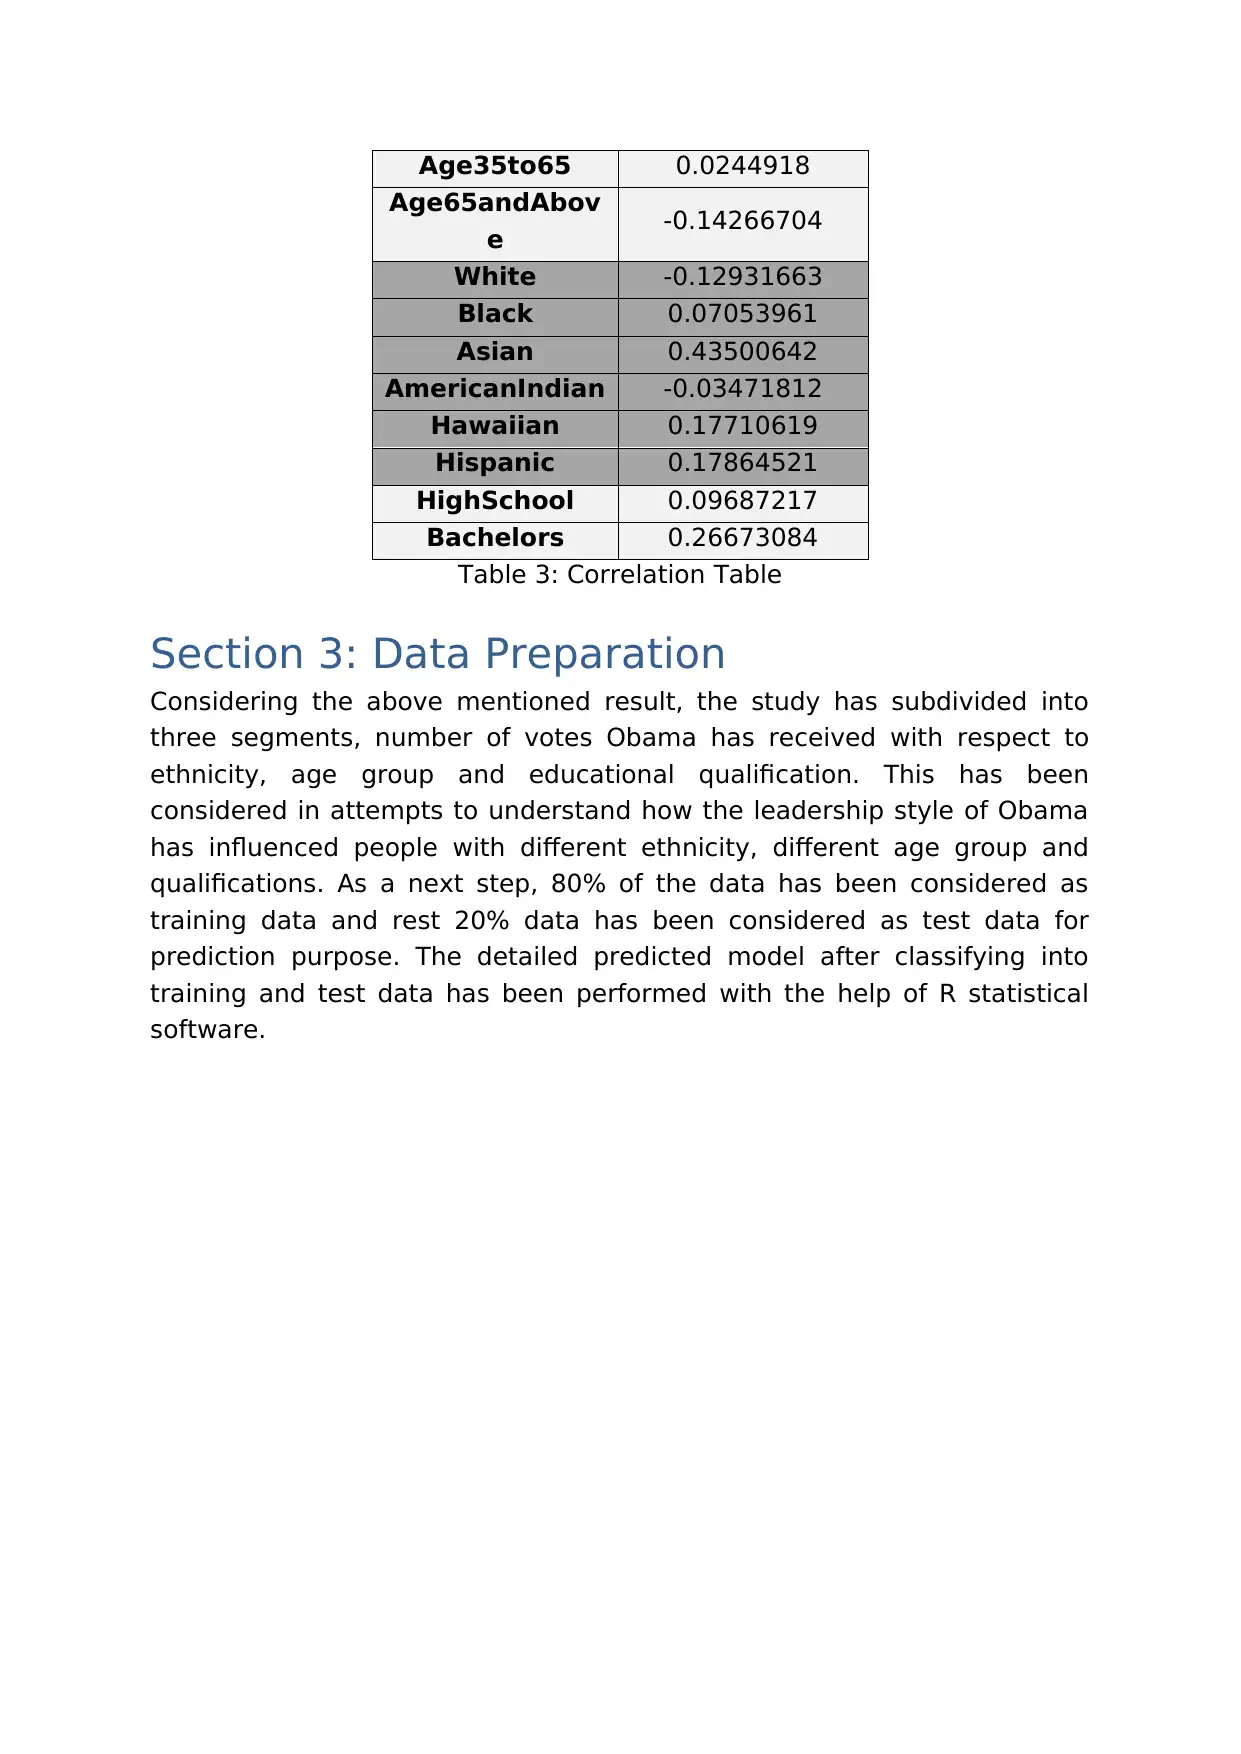
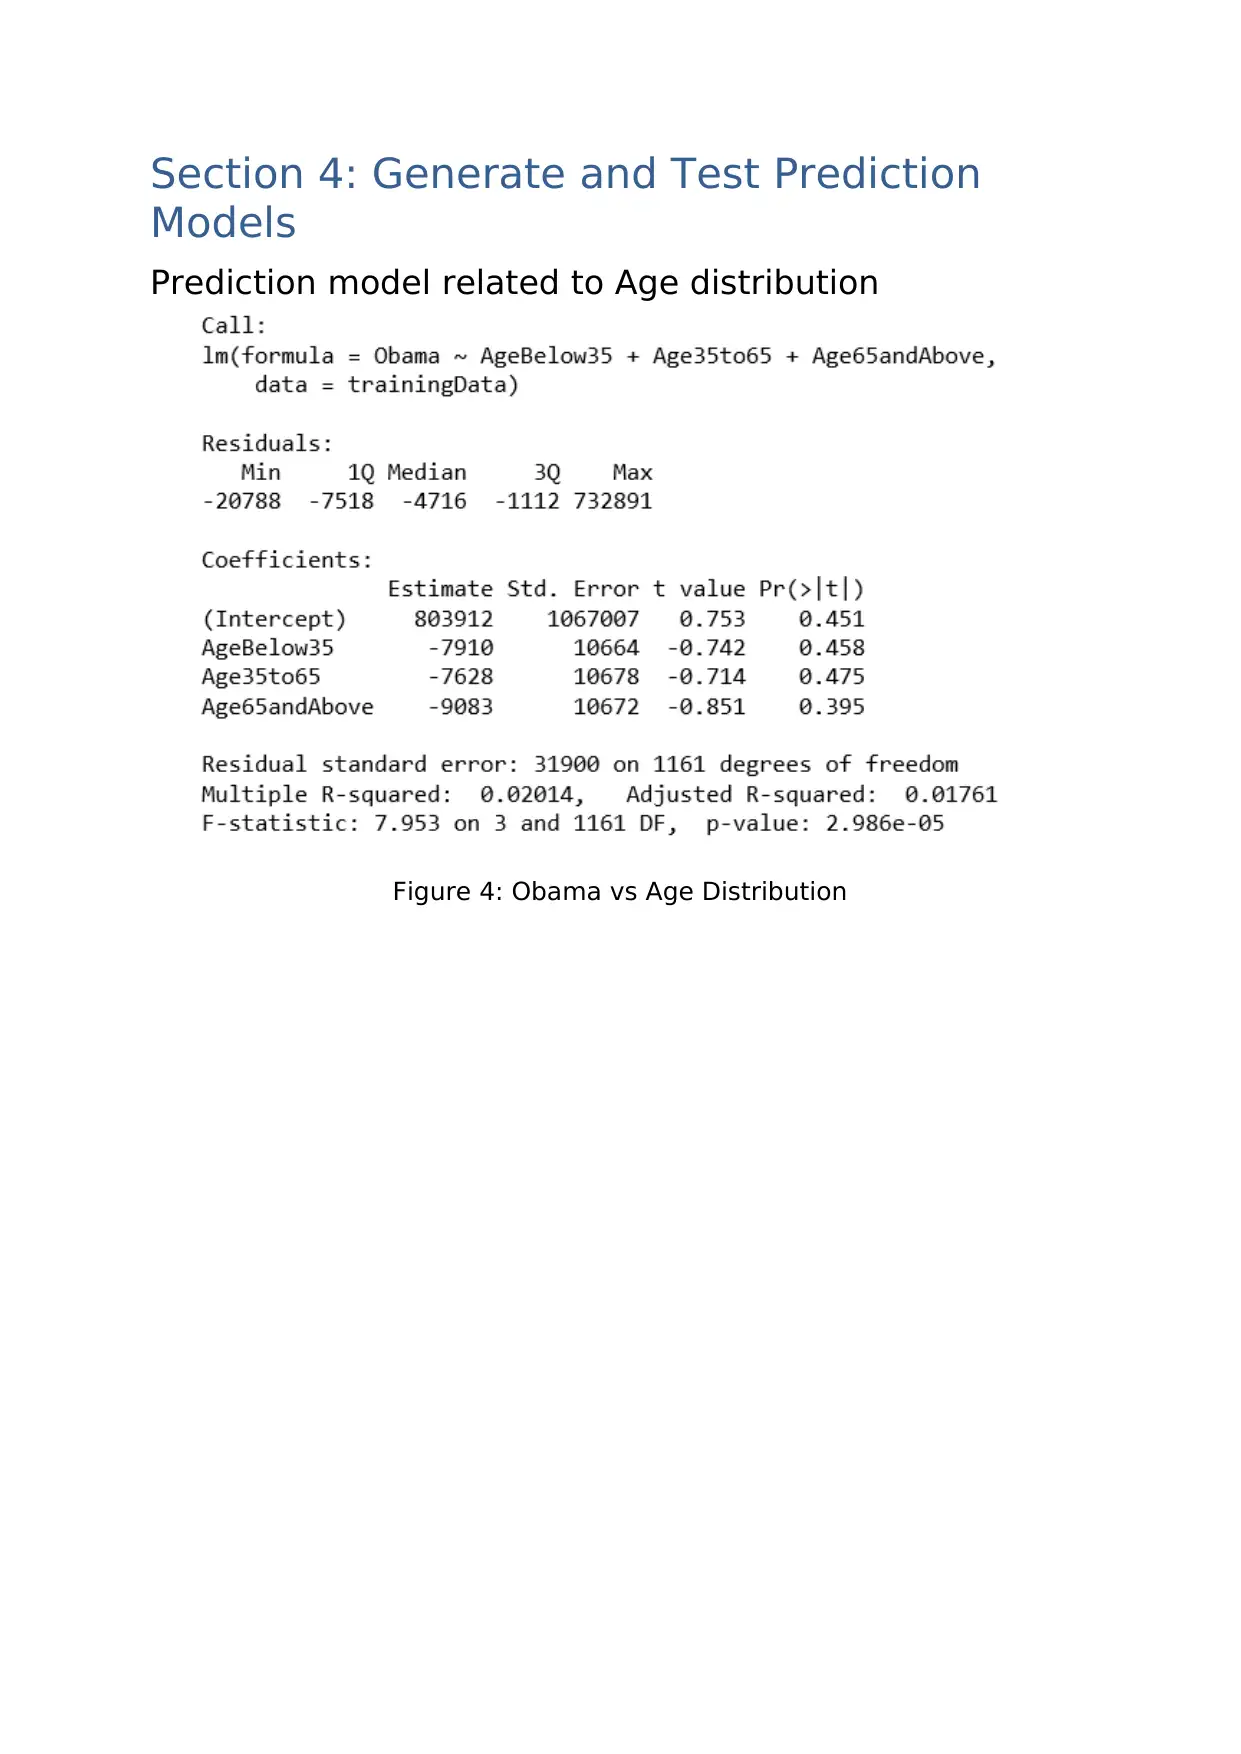
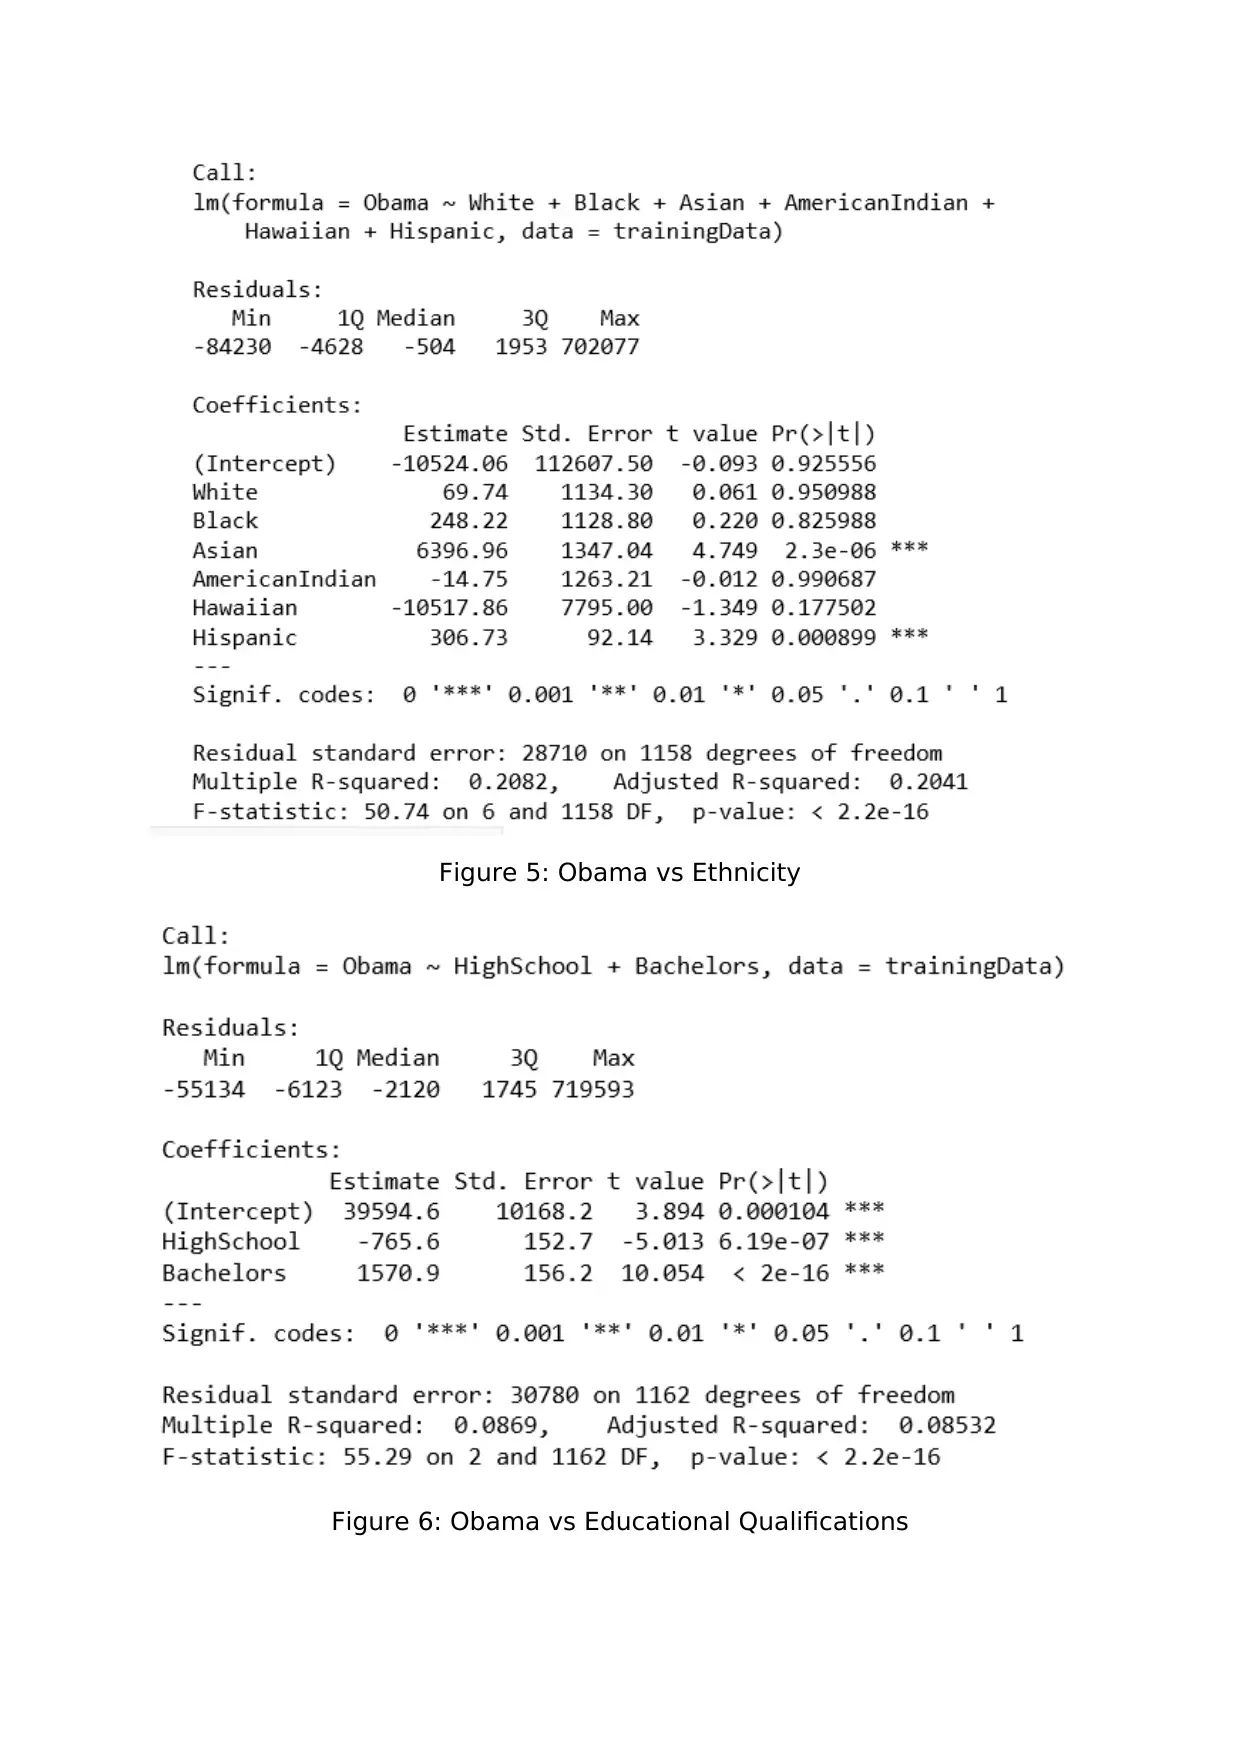
This assignment presents a comprehensive analysis of two case studies: the 2008 US Presidential primaries between Barack Obama and Hillary Clinton, and trends in US Births data, specifically focusing on the NICU (Neonatal Intensive Care Unit). The Obama-Clinton case study explores the leadership styles of the candidates and their impact on vote results, using data related to ethnicity, age, and education levels. Tableau and R visualizations are employed to understand data characteristics and correlations. Prediction models are generated to assess the influence of Obama's leadership style on different demographic groups. The NICU case study investigates trend and seasonality patterns in US Births data, analyzing variations based on socio-demographic factors. Exponential smoothing techniques in R are used for forecasting birth rates, comparing different models for seasonal and non-seasonal data. The report concludes with recommendations based on the analysis and includes a code appendix detailing the R scripts used.
Document Page
Data Analytics II: Group Assignment
Name of the Student
Name of the University
tabler-icon-diamond-filled.svg

Paraphrase This Document

Need a fresh take? Get an instant paraphrase of this document with our AI Paraphraser
Document Page
Table of Contents
2 Section 1: The Problem..........................................................................4
3 Section 2: Data Understanding..............................................................5
3.1 Tableau Visualisation:......................................................................5
3.2 R Visualisation and Aggregation Table:...........................................7
4 Section 3: Data Preparation...................................................................7
5 Section 4: Generate and Test Prediction Models...................................8
5.1 Prediction model related to Age distribution...................................8
6 Section 5: Problem Conclusions and Recommendations.....................10
7 Appendix:............................................................................................11
8 Trend or seasonality patterns in this US Births data...........................14
9 Forecasting US Birth............................................................................15
10 Comparison of seasonality pattern...................................................18
11 Recommendation..............................................................................19
12 Appendix...........................................................................................19
Document Page
PART I: OBAMA-
CLINTON CASE STUDY
Document Page
Section 1: The Problem
The 2008 US Presidential primaries evidenced candidates from the
Democratic Party, Barack Obama and Hillary Clinton in genuine dispute,
with various administration styles. Their methodologies reflected
contending hypotheses of 'administrative' and 'transformational' authority
styles. Hillary Clinton's methodology was visionary, yet she additionally
had confidence in controlling and guaranteeing that approaches were
actualized dependably. Barack Obama's methodology was by giving
vision, judgment and motivation. He trusted in appointing obligations and
achieving change by accord. Some administration specialists felt that a
micromanaging approach has only occasionally been powerful in realizing
change. Agreement building and helping individuals to accomplish shared
objectives was seen to be compelling in change the executives.
Obama's 2008 crusade was one of a kind and to some degree non-
replicable. Regardless of whether the enthusiastic inclusion Obama made
around himself will barely be accomplished by competitors in the next
years, there are numerous exercises to be gained from his battle that
can't be disregarded. After Kennedy, no political competitor could prevail
without a fruitful TV technique, by a similar token after Obama no
applicant will prevail without putting resources into online innovation. We
recognized five manners by which Obama changed political battles and
five advancements that each future competitor should remember. The
primary exercise respects Obama's focusing on systems, the second is
tied in with marking. The third area will inspect the accomplishment of
Obama's online correspondence. The fourth exercises is tied in with fund-
raising utilizing new Medias, the fifth and last exercise is tied in with
running a development not a battle.
The case starts exchange on various authority styles and their effect on
change the executives. The objectives of this study was:
ï‚· To analyse the leadership styles of Barack Obama.
ï‚· To understand the impact of leadership style on vote results.
tabler-icon-diamond-filled.svg

Paraphrase This Document

Need a fresh take? Get an instant paraphrase of this document with our AI Paraphraser
Document Page
Section 2: Data Understanding
Here, the data set contains series of variables related to 2008 US election.
The data were gathered post election and related to both Clinton and
Obama. However, all variables were not included in the analysis. To
understand the leadership style of Barak Obama as well as its impact on
voting results, data related to ethnicity, that is, white, black, Asian,
American Indian, Hawaiian, and Hispanic variables were taken into
considered as one set of variable. On the other hand, data related age
specification and educational qualifications were also taken into account.
Both tableau visualisation as well as R modelling have been used to
understand the nature and characteristic of data set.
Tableau Visualisation:
The first visualisation is all about plotting number of votes Barak Obama
received in different states. The colour combination has shown the volume
of votes he received.
Figure 1: States vs Votes [Obama]
The below dashboard is a combination of scatter plots of different
variable. Taken for example, if the number of votes and Ethnicity is
considered here, then it can be seen that there is a positive association
between number of votes Barak Obama has received and Asian people,
Black people, Hawaiian people and Hispanic people. On the other hand,
Document Page
American Indian, and white people has negative association with number
of votes he received.
Similarly, while educational qualifications are taken into consideration,
then it can be found that both High school as well as bachelors have
supported positively. Finally, if the age group is taken into consideration,
then it can be said that above 65 age group people has shown negative
attitude in terms of giving votes to Barak Obama.
figure 2: Correlations
Document Page
Figure 3: Box Plot
It seems, the leadership style of Barak Obama positively influenced
young, non white people mostly and resulted a huge figure in terms of
getting votes.
R Visualisation and Aggregation Table:
Regio
n
Clinton_
total
Obama_
total
Total_
Vote
South 3191621 3773425 758085
9
West 3338179 2988643 666908
6
North
east
2666392 2050694 490813
5
Midw
est
1180191 1918637 318633
4
Table 1: Voting Details with respect to Region
ElectionT
ype
Clinton_t
otal
Obama_t
otal
Total_V
ote
Primary 10257607 10497560 2198224
1
Caucuses 118776 233839 362173
Table 2: Voting Details with respect to Election Type
Obama
AgeBelow35 0.09033594
tabler-icon-diamond-filled.svg

Paraphrase This Document

Need a fresh take? Get an instant paraphrase of this document with our AI Paraphraser
Document Page
Age35to65 0.0244918
Age65andAbov
e -0.14266704
White -0.12931663
Black 0.07053961
Asian 0.43500642
AmericanIndian -0.03471812
Hawaiian 0.17710619
Hispanic 0.17864521
HighSchool 0.09687217
Bachelors 0.26673084
Table 3: Correlation Table
Section 3: Data Preparation
Considering the above mentioned result, the study has subdivided into
three segments, number of votes Obama has received with respect to
ethnicity, age group and educational qualification. This has been
considered in attempts to understand how the leadership style of Obama
has influenced people with different ethnicity, different age group and
qualifications. As a next step, 80% of the data has been considered as
training data and rest 20% data has been considered as test data for
prediction purpose. The detailed predicted model after classifying into
training and test data has been performed with the help of R statistical
software.
Document Page
Section 4: Generate and Test Prediction
Models
Prediction model related to Age distribution
Figure 4: Obama vs Age Distribution
Document Page
Figure 5: Obama vs Ethnicity
Figure 6: Obama vs Educational Qualifications
tabler-icon-diamond-filled.svg

Paraphrase This Document

Need a fresh take? Get an instant paraphrase of this document with our AI Paraphraser
Document Page
Section 5: Problem Conclusions and
Recommendations
On the basis of analysis done in the above section, it can be concluded
that prior to the election, President Barack Obama pulled in the
consideration of American's and outsiders alike with an apparently alluring
nature. However, post election, it has become apparent that an appealing
pioneer has an uncanny capacity to attract others to his side and move
them to achieve a reason greater than themselves. A charming
methodology is transformational in the event that it summons a perpetual
change in the general population who grasp the pioneer's vision. Amid his
first term, President Obama charmed probably some to his vision by
appearing potential to have a tremendous effect in both local and outside
issues. In his second term, he appeared to be all the more detached and
showed less capacity to attract others to his motivation. Some even feel
that he has not satisfied full desires.
Document Page
Appendix:
library(dplyr)
data<-read.csv("Obama.csv")
x<-na.omit(data)
Voting_details<- x %>%
group_by(Region) %>%
summarise(Clinton_total=sum(Clinton),Obama_total=sum(Obama),Total_
Vote=sum(TotalVote)) %>%
arrange(desc(Total_Vote))
Voting_details
Voting_details1<- x %>%
group_by(ElectionType) %>%
summarise(Clinton_total=sum(Clinton),Obama_total=sum(Obama),Total_
Vote=sum(TotalVote)) %>%
arrange(desc(Total_Vote))
Voting_details1
cor(x[,9:24])
set.seed(100)
trainingRowIndex <- sample(1:nrow(x), 0.8*nrow(x)) # row indices for
training data
trainingData <- x[trainingRowIndex, ] # model training data
testData <- x[-trainingRowIndex, ] # test data
lmMod <- lm(Obama ~ AgeBelow35 + Age35to65 + Age65andAbove,
data=trainingData) # build the model
distPred <- predict(lmMod, testData) # predict distance
summary (lmMod) # model summary
lmMod1 <- lm(Obama ~ White + Black + Asian + AmericanIndian +
Hawaiian + Hispanic, data=trainingData) # build the model
chevron_up_icon
1 out of 25
circle_padding
hide_on_mobile
zoom_out_icon
[object Object]