Data Analysis and Forecasting Report: Expenditure Over Time

Verified

Added on  2022/12/27

|11
|1315
|63
Report
AI Summary
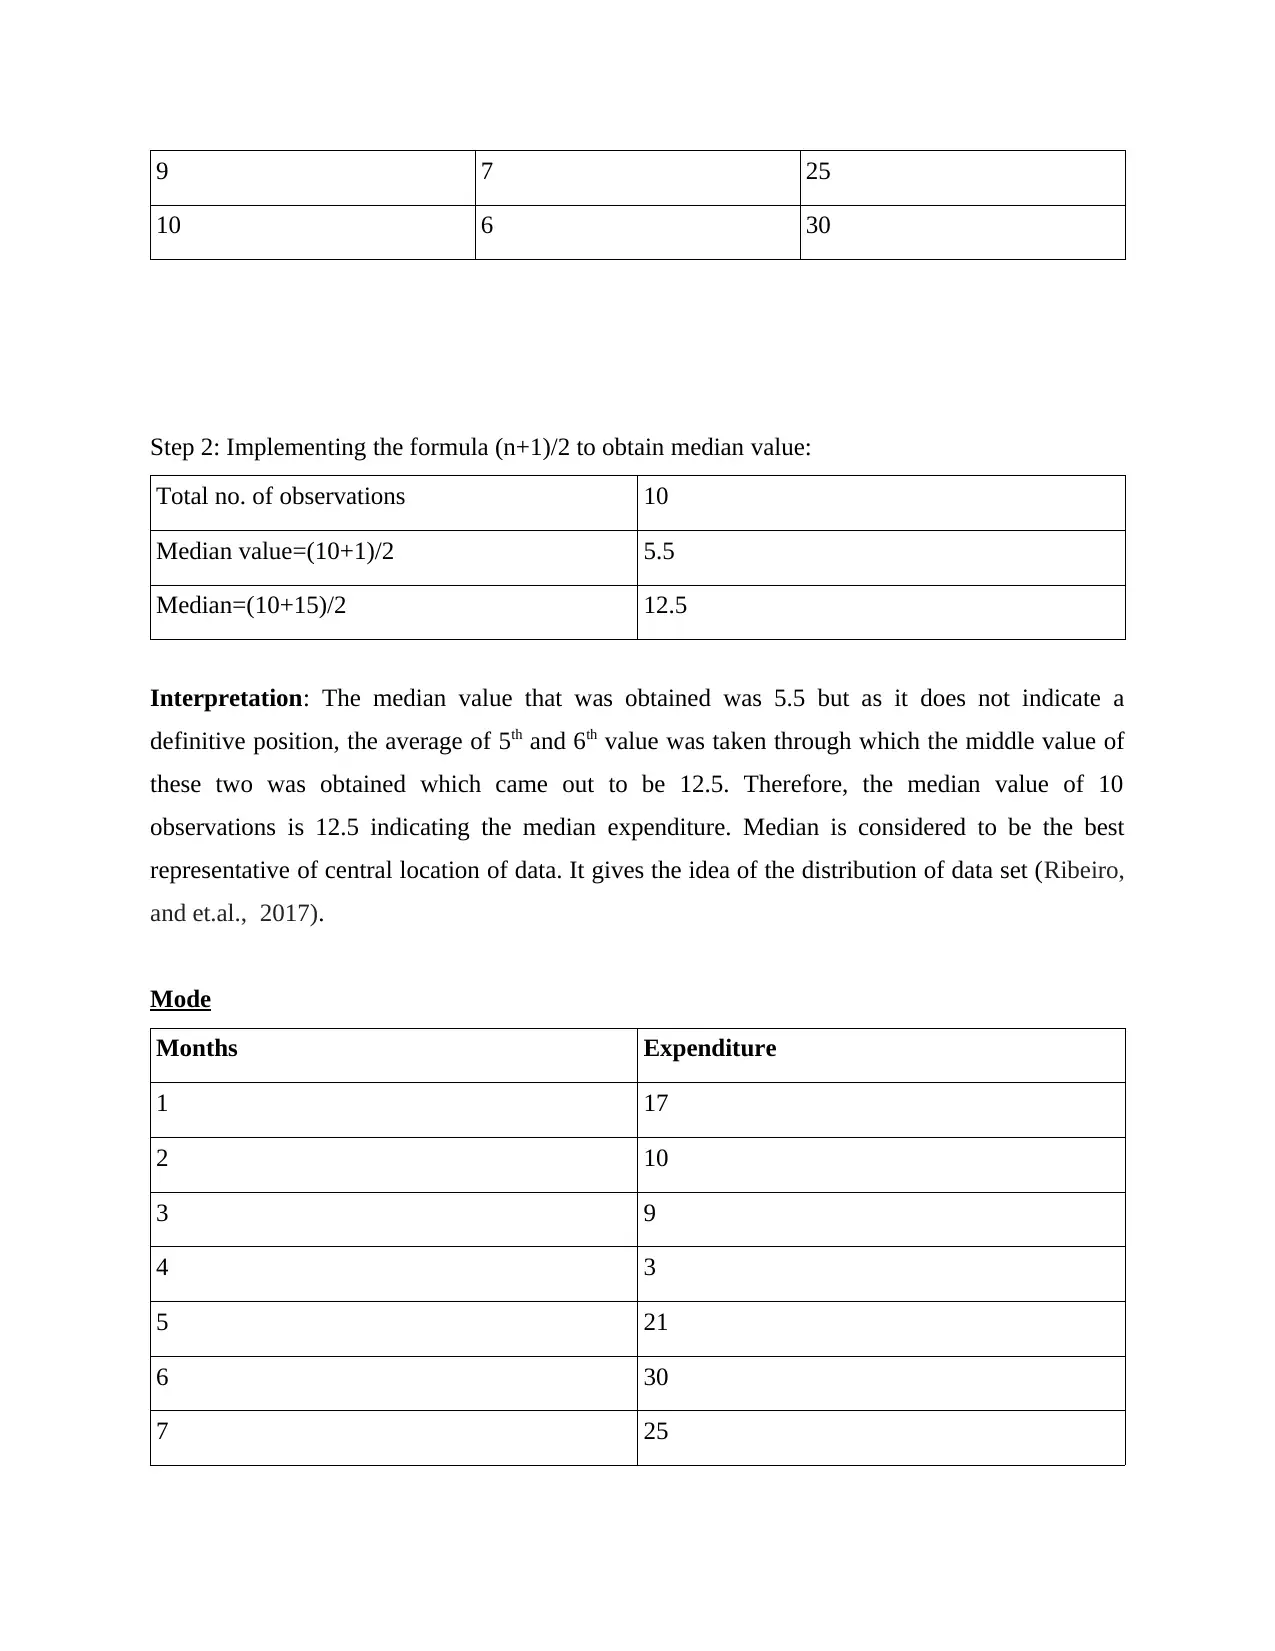
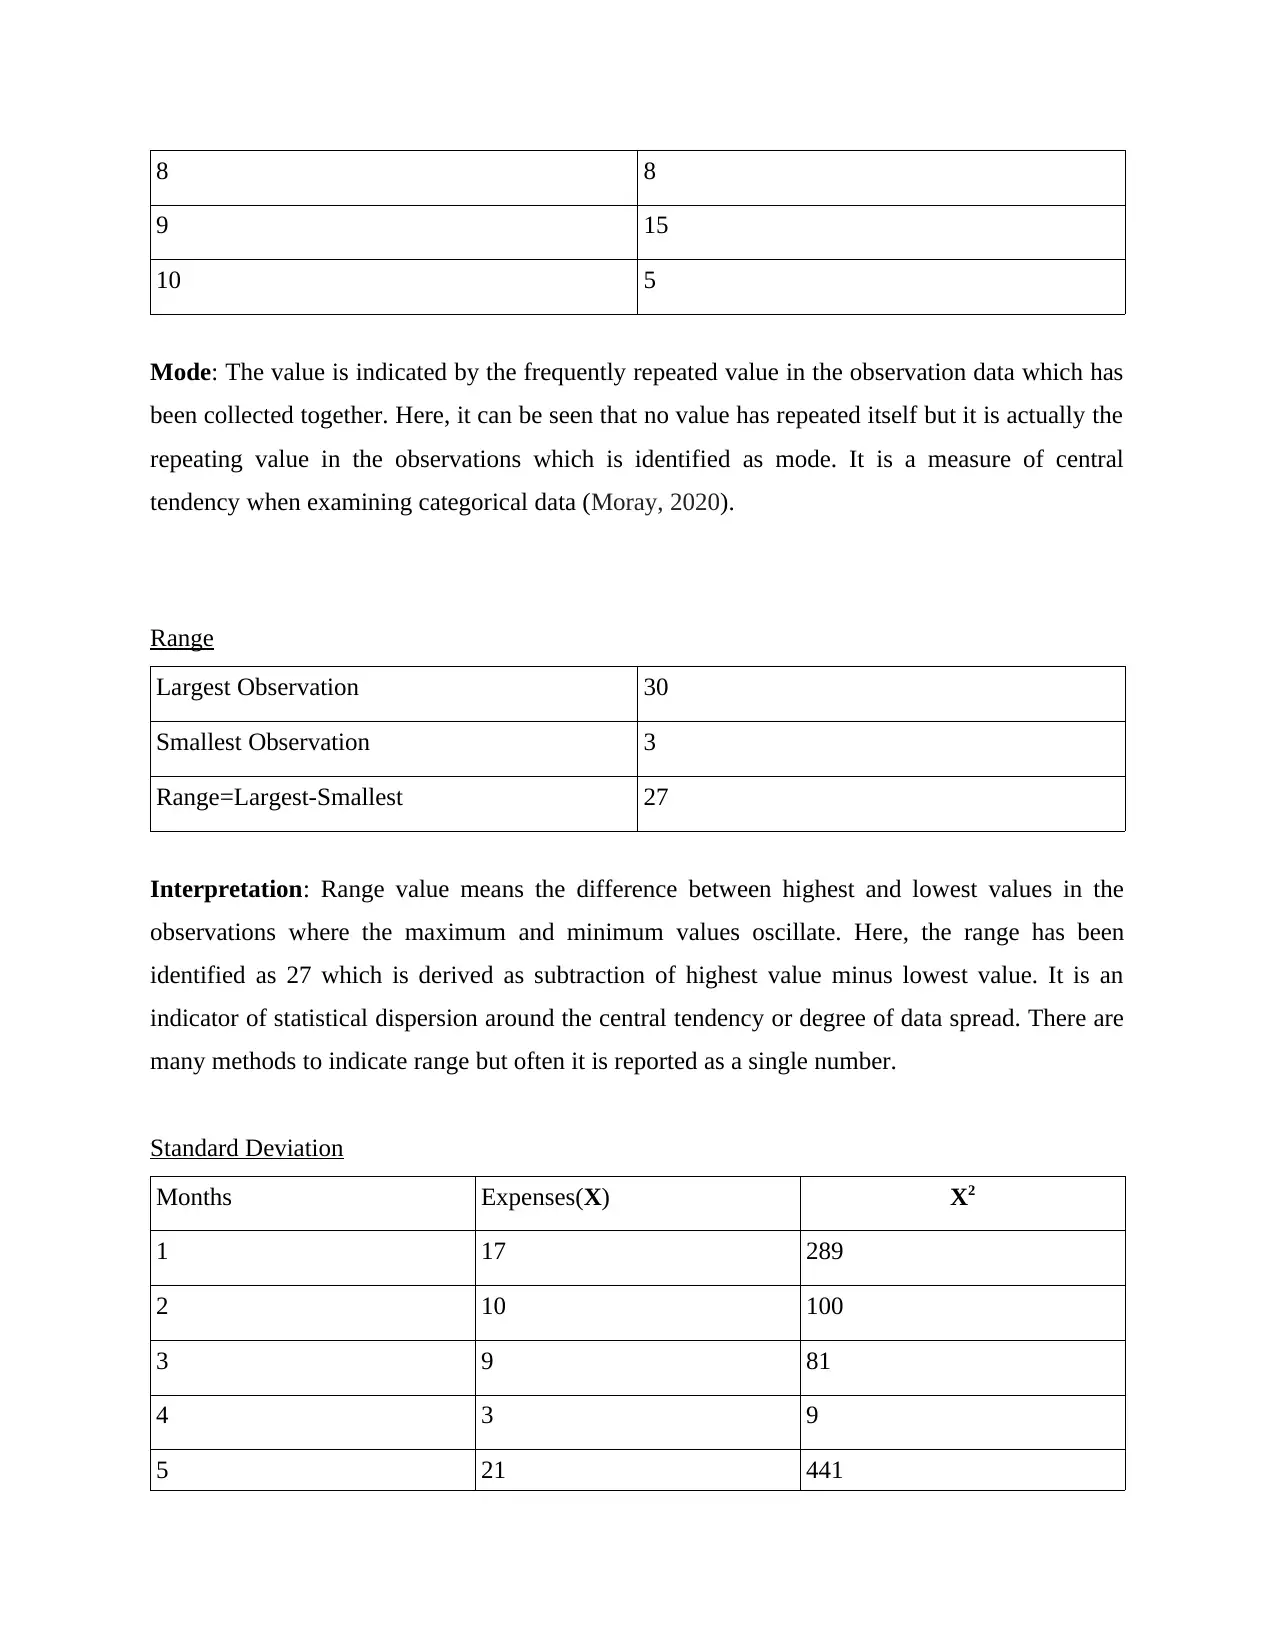
This report provides a comprehensive analysis of expenditure data, employing various statistical methods for forecasting and trend identification. It begins with data arrangement and chart preparation, followed by detailed calculations of mean, median, mode, range, and standard deviation. The interpretation of each statistical measure is provided to show their relevance in understanding expenditure patterns. The report then delves into forecasting techniques, utilizing linear regression to predict future expenditure based on historical data. The forecasting for the 11th and 12th months is calculated, providing insights into potential future expenses. The conclusion emphasizes the importance of these analytical parameters for effective forecasting. The references section includes relevant books and journals to support the analysis.
Document Page
Data Analysis and
Forecasting
tabler-icon-diamond-filled.svg

Paraphrase This Document

Need a fresh take? Get an instant paraphrase of this document with our AI Paraphraser
Document Page
Table of Contents
INTRODUCTION...........................................................................................................................3
Data Arrangement.......................................................................................................................4
Preparation of Charts...................................................................................................................4
Calculations.................................................................................................................................4
Mean............................................................................................................................................4
Median.........................................................................................................................................5
Mode...........................................................................................................................................6
Range...........................................................................................................................................6
Standard Deviation......................................................................................................................7
Forecasting .................................................................................................................................8
CONCLUSION................................................................................................................................9
REFERENCES................................................................................................................................9
Document Page
INTRODUCTION
The file represents data analysis and forecasting as the study. The data collected of expenditure
of various months is used for calculating statistics which help in forecasting the future trends and
decision-making. Businesses get help in budget forecasting and also in anticipating the expenses
over a period of time. The statistics calculation and interpretation has been discussed to show
their relevance.
Data Arrangement
Months Expenditure
1 17
2 10
3 9
4 3
5 25
6 30
7 25
8 8
9 15
10 5
Preparation of Charts
The data recorded can be presented in form of chart as below:
Document Page
Calculations
Mean
Months Expenditure
1 17
2 10
3 9
4 3
5 21
tabler-icon-diamond-filled.svg

Paraphrase This Document

Need a fresh take? Get an instant paraphrase of this document with our AI Paraphraser
Document Page
6 30
7 25
8 8
9 15
10 5
Total expenditure(x) 143
Total observations(n) 10
Mean(x/n) 14.3
Interpretation: The calculation done by dividing total expenditure by observations is 14.3 or 14
which is the mean here. It can be thus said that average expenditure done in a month is around
14. The mean serves as a yardstick for all observations and is mostly used as a general indicator
of data. It is an important tool used in computing statistical data (Ribeiro and et.al., 2017).
Median
These are the two steps that need to be performed in order to calculate the median value.
Step 1: Arranging data in ascending order:
S.no. Months Expenses
1 4 3
2 10 5
3 8 8
4 3 9
5 2 10
6 9 15
7 1 17
8 5 21
Document Page
9 7 25
10 6 30
Step 2: Implementing the formula (n+1)/2 to obtain median value:
Total no. of observations 10
Median value=(10+1)/2 5.5
Median=(10+15)/2 12.5
Interpretation: The median value that was obtained was 5.5 but as it does not indicate a
definitive position, the average of 5th and 6th value was taken through which the middle value of
these two was obtained which came out to be 12.5. Therefore, the median value of 10
observations is 12.5 indicating the median expenditure. Median is considered to be the best
representative of central location of data. It gives the idea of the distribution of data set (Ribeiro,
and et.al., 2017).
Mode
Months Expenditure
1 17
2 10
3 9
4 3
5 21
6 30
7 25
Document Page
8 8
9 15
10 5
Mode: The value is indicated by the frequently repeated value in the observation data which has
been collected together. Here, it can be seen that no value has repeated itself but it is actually the
repeating value in the observations which is identified as mode. It is a measure of central
tendency when examining categorical data (Moray, 2020).
Range
Largest Observation 30
Smallest Observation 3
Range=Largest-Smallest 27
Interpretation: Range value means the difference between highest and lowest values in the
observations where the maximum and minimum values oscillate. Here, the range has been
identified as 27 which is derived as subtraction of highest value minus lowest value. It is an
indicator of statistical dispersion around the central tendency or degree of data spread. There are
many methods to indicate range but often it is reported as a single number.
Standard Deviation
Months Expenses(X) X2
1 17 289
2 10 100
3 9 81
4 3 9
5 21 441
tabler-icon-diamond-filled.svg

Paraphrase This Document

Need a fresh take? Get an instant paraphrase of this document with our AI Paraphraser
Document Page
6 30 900
7 25 625
8 8 64
9 15 225
10 5 25
Total 143 2759
The formula of standard deviation is as below:
Standard Deviation=SQRT [(∑X2 / N) – (∑X / N)2]
=SQRT[(2794/10)-(143/10)^2]
=8.65.
Interpretation: By use of the formula above, the value of standard deviation was calculated which
indicates the standard deviation to be 8.65 points. This actually indicates the overall deviation
that has occurred in the observations from the mean i.e. average value point. Standard deviation
is measure of amount of variation or dispersion occurring in a set of values. A lower standard
deviation is an indicator of the values being close to the mean of set, while a higher standard
deviation means that the values have been spread over a wide range (Silvestre and Meireles,
2020).
Forecasting
Forecasting is a process of making predictions of future based on previous as well as present
data. Forecasting is done to reduce risks in future by making use of data for estimations and
making judgments. It can also be said that forecasting helps in decision-making and also making
management of an organization aware of the rectifiable measures to be taken to avoid losses
which can occur if measures are bot taken in advance (Moray, 2020).
The relevant values can be calculated as follows:
Months X Expenses(y) x*y x2
Document Page
1 1 17 17 289
2 2 10 20 400
3 3 9 27 729
4 4 3 12 144
5 5 21 105 11025
6 6 30 180 32400
7 7 25 175 30625
8 8 8 64 4096
9 9 15 135 18225
10 10 5 50 2500
Total 55 143 785 100433
I.) Calculating m
m = [(n*Σxy) – (Σx*Σy)] / [(n*Σx2) – (Σx)2] -15
m= [(10*785)-(55*143)]/[(10*3025)- 3025]
m= -0.00055.
ii) Calculating c
c= [Σy – (m * Σx)] / n
c=[143-(-0.00055*55)]/10=14.30
Forecasting for 11th and 12th month
The linear forecasting equation of y=mx+c is used in order to obtain the values of 11th and 12th
month in order to forecast their expenditures.
Forecasting expenses on 11th
month
y=mx+c Here,
x=11
y=-0.00055(11)+14.30
y=14.2939
Document Page
Forecasting on 12th month y=mx+c Here,
x=12
y=-0.00055(12)+14.30
y=14.2934
CONCLUSION
The research done in the report indicates different parameters used with different results but with
a common goal in forecasting. The results are interpreted to lead to help in forecasting measures.
REFERENCES
Books and Journals
Ribeiro, V. and et.al., 2017, August. Importance of statistics for data mining and data science.
In 2017 5th International Conference on Future Internet of Things and Cloud Workshops
(FiCloudW)(pp. 156-163). IEEE.
Moray, R., 2020. Role and Importance of Statistics in Business Management. FOUNDED 1998,
p.175.
Fries, F. and et.al., 2020, March. The importance of statistics for photoluminescence quantum
yield measurements (Conference Presentation). In Organic Photonic Materials and
Devices XXII (Vol. 11277, p. 1127708). International Society for Optics and Photonics.
tabler-icon-diamond-filled.svg

Paraphrase This Document

Need a fresh take? Get an instant paraphrase of this document with our AI Paraphraser
Document Page
Silvestre, C. and Meireles, A., 2020, October. Statistics for communication students. In Program
and Book of Abstracts XXVII Meeting of the Portuguese Association for Classification
and Data Analysis (CLAD) (p. 73).
chevron_up_icon
1 out of 11
circle_padding
hide_on_mobile
zoom_out_icon
[object Object]