Data-Driven Decision Making: Ford Australia Case Study Analysis
VerifiedAdded on 2021/02/20
|9
|2522
|63
Report
AI Summary
This report presents a comprehensive data analysis case study focused on Ford Australia. It begins with an introduction defining data analytics and its importance in business decision-making, specifically for Ford Australia. The main body delves into Ford Australia's current operational modes, including repetitive, discrete, job shop, and process manufacturing, highlighting the company's adoption of process manufacturing. The report identifies potential inefficiencies, such as energy losses and driving energy inefficiencies. It then explores available data sources, including the company's website and articles. The core of the report focuses on how data can be used to provide efficiencies through regression analysis, explaining its types and benefits like making predictions, improving business efficiency, supporting decision-making, and determining outcomes. Finally, it discusses methods for communicating outcomes to stakeholders, including multidimensional visualizations and various visualization techniques like Google Charts, Many Eyes, and Tableau Public. The report concludes by summarizing the findings and emphasizing the value of data analytics for business optimization.
Data Analysis
Case Study
Case Study
Paraphrase This Document
Need a fresh take? Get an instant paraphrase of this document with our AI Paraphraser
Table of Contents
INTRODUCTION...........................................................................................................................1
MAIN BODY...................................................................................................................................1
Current mode of operation...........................................................................................................1
Possible inefficiencies..................................................................................................................2
Available data sources.................................................................................................................3
The way in which data could be used to provide efficiencies based on the concepts and
techniques....................................................................................................................................3
Outcome and methods of communication to stakeholders..........................................................4
CONCLUSION................................................................................................................................5
REFERENCES................................................................................................................................7
INTRODUCTION
Data analytics can be defined as the process which is used by analysers to monitor and
examine sets of information so that a conclusion could be formed. It is mainly used in
commercial industries in order to formulate highly informed decisions according to market
situations. Scientists also use it for the purpose of verifying or disproving the scientific theories,
hypothesis and models (Agneeswaran, 2014). Main aim of this report is to determine the steps
which are needs to enable data driven decision making in business entities. The organisation
which is selected for this project is Ford Australia which is a subsidiary of Ford Motor Company.
It was founded in year 1925 by Henry Ford. This assignment covers various topics such as
current mode of operation, available data sources, possible inefficiencies and use of information
to provide efficiencies based on the concept and techniques. Along with this, outcomes and
methods of communication to stakeholders are also discussed under this assignment.
MAIN BODY
Current mode of operation
There are various types of mode of operations which are used by car manufacturing
companies. All of them are as follows:
Repetitive: It can be defined as such type of mode of operation in which organisations
keep the product lines same and manufacture the same product. There is a very low
requirements of change over or set up. It could be used by Ford Australia to execute all
its operations if same cars are manufactured by it again and again (Different modes of
operations, 2019).
Discrete: It is a type of assemble line process and it is highly diverse process which
requires variation in set up and change over frequencies. The variation in this mode of
operation are very disrate. It could be used by Ford Australia to produce such cars which
are alike (Chia and Ramsay, 2016).
Job Shop: In this mode of operations organisations have different areas for production
rather than lines. In this type of mode single or various version of cars could be
assembles by the companies involved in their manufacturing processes. It could be
converted to the discrete mode of operation if the demand deems necessary. While
focusing on the production of different versions of the cars Ford Australia can use this
1
⊘ This is a preview!⊘
Do you want full access?
Subscribe today to unlock all pages.
Trusted by 1+ million students worldwide
mode of operation. With the help of it the organisation will be able to attract large
number of customers who are willing to buy new and innovative cars.
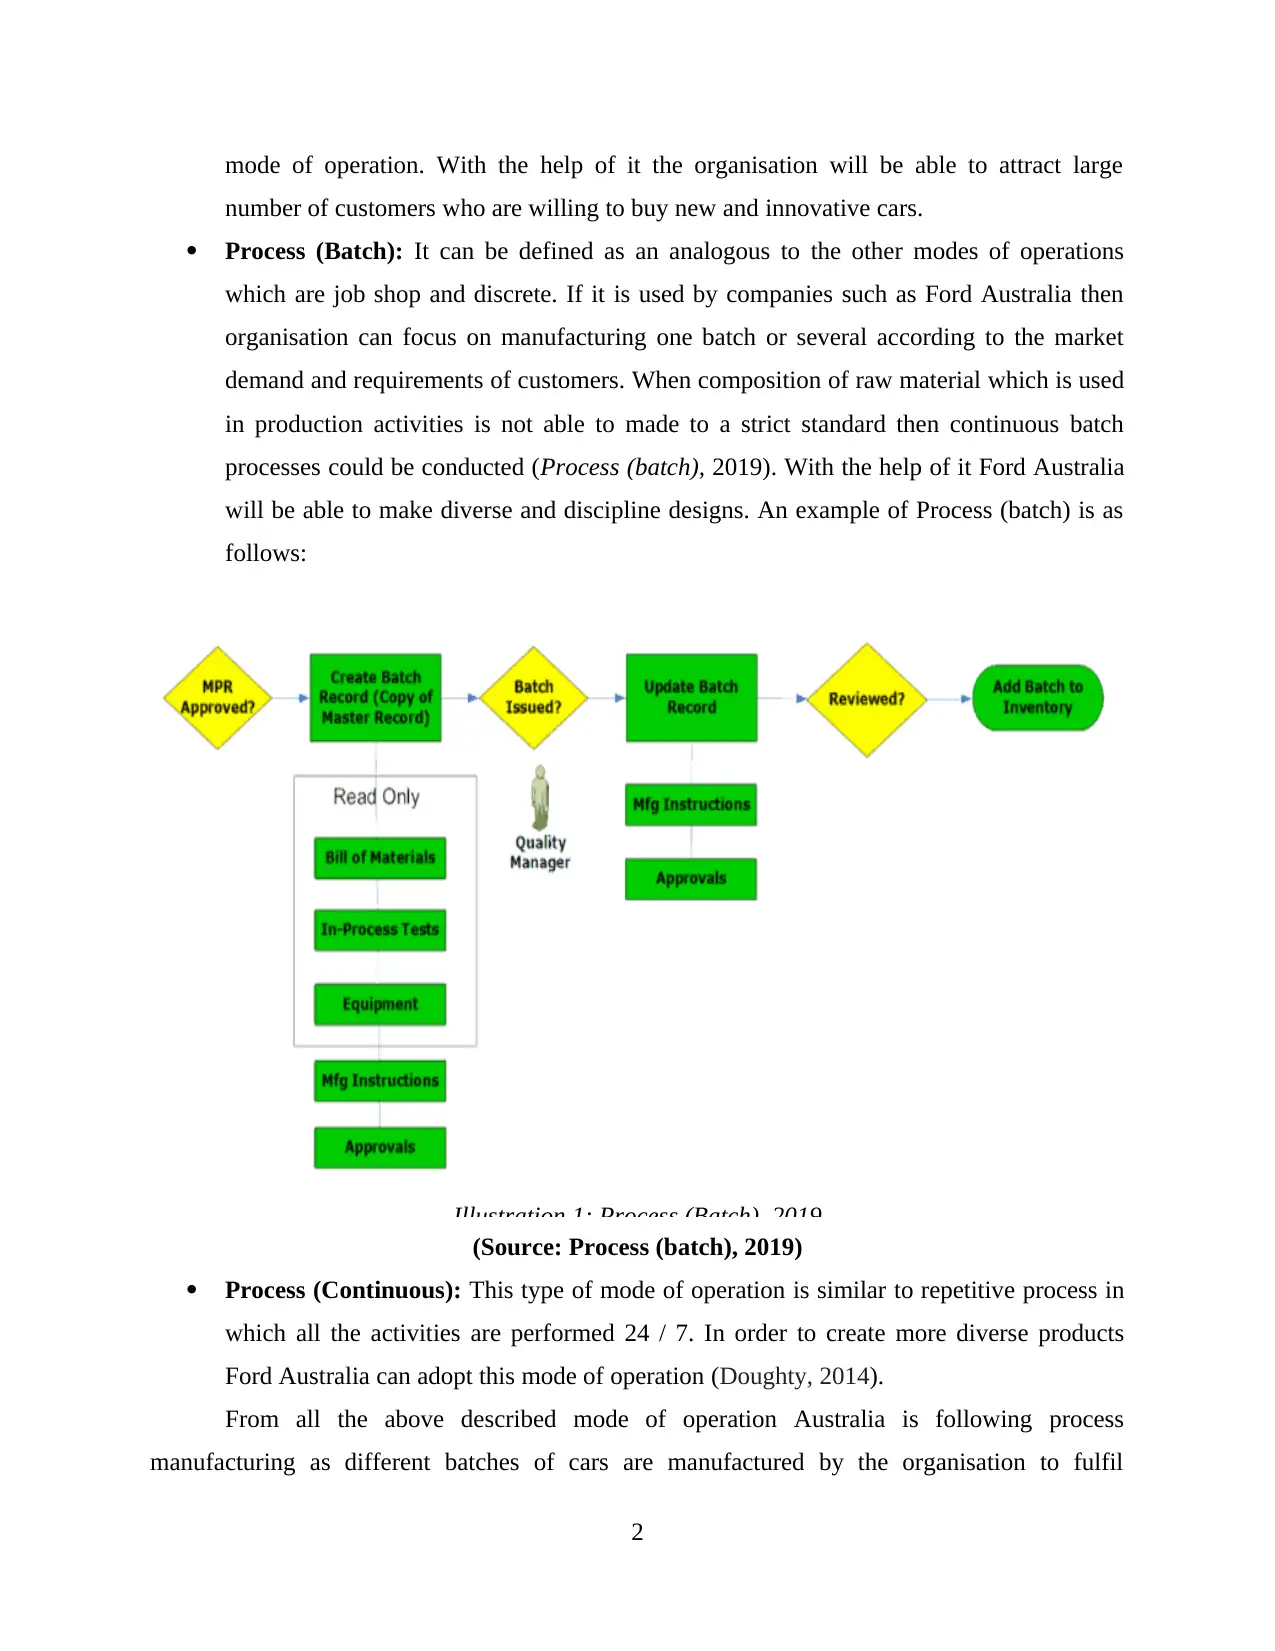
Process (Batch): It can be defined as an analogous to the other modes of operations
which are job shop and discrete. If it is used by companies such as Ford Australia then
organisation can focus on manufacturing one batch or several according to the market
demand and requirements of customers. When composition of raw material which is used
in production activities is not able to made to a strict standard then continuous batch
processes could be conducted (Process (batch), 2019). With the help of it Ford Australia
will be able to make diverse and discipline designs. An example of Process (batch) is as
follows:
Illustration 1: Process (Batch), 2019
(Source: Process (batch), 2019)
Process (Continuous): This type of mode of operation is similar to repetitive process in
which all the activities are performed 24 / 7. In order to create more diverse products
Ford Australia can adopt this mode of operation (Doughty, 2014).
From all the above described mode of operation Australia is following process
manufacturing as different batches of cars are manufactured by the organisation to fulfil
2
number of customers who are willing to buy new and innovative cars.
Process (Batch): It can be defined as an analogous to the other modes of operations
which are job shop and discrete. If it is used by companies such as Ford Australia then
organisation can focus on manufacturing one batch or several according to the market
demand and requirements of customers. When composition of raw material which is used
in production activities is not able to made to a strict standard then continuous batch
processes could be conducted (Process (batch), 2019). With the help of it Ford Australia
will be able to make diverse and discipline designs. An example of Process (batch) is as
follows:
Illustration 1: Process (Batch), 2019
(Source: Process (batch), 2019)
Process (Continuous): This type of mode of operation is similar to repetitive process in
which all the activities are performed 24 / 7. In order to create more diverse products
Ford Australia can adopt this mode of operation (Doughty, 2014).
From all the above described mode of operation Australia is following process
manufacturing as different batches of cars are manufactured by the organisation to fulfil
2
Paraphrase This Document
Need a fresh take? Get an instant paraphrase of this document with our AI Paraphraser
requirements of clients. It also helps to attract large number of clients by offering them new
designs of cars.
Possible inefficiencies
Possible inefficiencies in the cars of Ford Australia are listed below:
Energy losses: It is a type of inefficiency which may take place such vehicles which are
powered by gasoline. Due to this more than 62% of fuel's energy could be lost in the
internal combustion engine. Most of the electric cars may get affected due to this which
may result in higher losses for the organisation which is manufacturing them. There is
high possibility of this inefficiency for Ford Australia because various electric cars are
manufactured by the organisation.
Driving energy inefficiencies: In order to reduce the fuel usage the manufactures of cars
such as Ford Australia use techniques such as hypermiling which helps to provide energy
efficient driving. If it gets failed then it may result in increased possibility of driving
energy inefficiencies which affects sales of cars of the organisations. It is a possible
inefficiency for Ford Australia because in order to provide better experience to customers
this technique is used by it (Lupton, 2015).
Available data sources
In order to gather information regarding Ford Australia different sources could be used
which are discussed below:
Company's website: It is one of the main sources which can provide detailed
information regarding the company. Overview of the organisation could be gathered from this
sources (Website of Ford Australia, 2019.).
Articles about company: Another main source of collecting data regarding the
organisation is article which is related to the company and help researcher to gather detailed
information about Ford Australia (Article of Ford Australia, 2019).
The way in which data could be used to provide efficiencies based on the concepts and
techniques
The analytic technique which is used for the purpose of analysis is regression which is a
statistical measure utilised in investing, finance and other activities in order to determine
relationship between two different factors. These are dependent and independent.
3
Regression analysis: A method for assessing the statistical connection among two or
more factors when a shift in a dependent factors (usually denoted by Y) is equal with a shift in
one or even more independent factors and relies on that shift. This analysis also enables capital
and financial directors to assess property and to comprehend the interactions among variables
like product prices as well as business stocks in respective markets. In context of Ford Australia,
regression analysis measures the dependent factors conditional interest provided by the
autonomous factors which is consider to be the dependent variable's median value in case when
the interdependent factors are fixed.
There are basically two type of regression such as multiple liner regression under which
at least two or even more interdependent factors are used in order to estimate the possible
outcome and liner regression that have only one main independent variable that is used to
explain and estimate the consequences of respective variable Y. There are number of important
uses of regression analysis such as:
It is used to interpret the effective relation between dependent and independent factors
and also define the type of relationship.
Analysis of regression could be used to indicate causal relationships among independent
and depended variables. This may though contribute to false impressions or fake
connections, so it is advisable to be careful (Mazumder, Bhadoria and Deka, 2017).
By using regression analysis Ford Australia can attain the number of advantages that help
in doing business in more profitable manner and increase overall efficiency. Some of these
benefit of this analysis is discussed below:
Making Predictions and Forecasts: This is the most common application of this
analysis because predicting in advance help company to deal with more advance method
to accomplish targets. It also enables company to use particular policies to deliver
significant data on such projections as sales revenues, future labour or supply demands,
or even potential difficulties. For example, regression methods in Ford Australia is used
to make estimation about a dependent factors that is sales in this case, if a outcome of
modification in an independent variable technology.
Improving business efficiency: This support in improving business profitability such as
manager with the help of regression analysis determine the ways to improve business. For
4
⊘ This is a preview!⊘
Do you want full access?
Subscribe today to unlock all pages.
Trusted by 1+ million students worldwide
example, manager used to find more economical order quantities depending upon
technology forecasts.
Support in decision making: This analysis can improve decision making that gives
better future outcome suppose in Ford Australia marketing team wants to make increase
in sales than they make decision to increase the frequency of television advertisements
that help to increase the total sales.
Determining results and correcting issues: Regression models are helpful in analysing
the real outcomes of decision that may seem abstractly right at first.
Outcome and methods of communication to stakeholders
There are various types of visualisations which could be used for the purpose of
communicating outcomes with shareholders. These are 1D/ Linear, 2D/Planar, 3D/ Volumetric,
Temporal, Multidimensional, Tree/ hierarchical and Network. For this purpose of
communication Multidimensional visualisation will be used.
There can be two major Multidimensional Visualizations types. The very first considers
ratios or proportions of categories, or counts of categories (O’Keefe, 2014). The other examines
variables ' relationships. Illustration of visualizations which exhibit counts or category
proportions: Wordless, histogram, rank-plot, bar-chart, tree-map, pie-chart. Instances of
visualizations showing relationships among factors: line chart, area-chart, scatter plot, matrices,
thermal map, parallel coordinates, sets, spider chart, mosaic display, tree chart, radar, pixel bar
chart, comparison tabular chart.
Multidimensional visualization could be achieved with assistance of three-dimensional
plane or two-dimensional least squares set interchange structures as well as set of manufacturing
possibilities (Shao and et.al., 2018). It may be worth noting which intersections acquired are
generalisation of well-known theory of economics features like isocost, production matrix,
isoquant output or input etc.
Techniques for Multidimensional Visualizations
Google Charts
Demonstration of live information on Ford Australia's website. It mainly covers
introduction, Chart, Quick Start, Gallery for thoughts.
Many Eyes
5
Paraphrase This Document
Need a fresh take? Get an instant paraphrase of this document with our AI Paraphraser
It view other' different visualizations, Ford company can upload their own information
and develop its own visualizations.
Tableau Public
Tableau Public implies to a free specific tool which "brings data or information to life"
(as per company's website).
Weave
It refers to Web-based Analysis and Visualization Environment which is specifically
configured to allow visualization of any accessible information. WEAVE contain broad vesture
of choices for operating with various data variety (Wu, Chen and Tsau, 2017).
Wordle
It render “word-clouds” via textual matter which company furnish. Clouds supply greater
importance to words which happen more often-times in source text. Company can squeeze their
clouds via various fonts, colour dodge and layouts.
With the help of all the above described methods Ford Australia will be able to
communicate organisation's information to all its stakeholders such as investors, shareholders,
creditors, suppliers, customers. In order to attract more and more investors for the organisation it
is very important for top level executives of Ford Australia to make sure that detailed
information regarding company's situation and current status is shared with stakeholders.
CONCLUSION
From the above project report it has been concluded that data analytics is a technique
which is used by organisations to monitor and analyse the information so that current situation of
business could be analysed. There are various modes of operations such as repetitive, discrete,
job shop, process (batch and continuous) which are followed by companies. The possible
inefficiencies which may affect automotive sector companies are energy losses and driving
energy inefficiency. Th data sources which could be used to gather information regarding
company are website, annual report, published articles etc. Regression is the best technique
which helps use the data to provide efficiencies.
6
REFERENCES
Books and Journals:
Agneeswaran, V. S., 2014. Big data analytics beyond hadoop: real-time applications with storm,
spark, and more hadoop alternatives. FT Press.
Chia, H. and Ramsay, I., 2016. An analysis of shareholder resolutions involving Australian listed
companies from 2004 to 2013. Company and Securities Law Journal. 34(8). pp.618-
624.
Doughty, H. A., 2014. Surveillance, Big Data Analytics and the Death of Privacy. College
Quarterly. 17(3). p.n3.
Lupton, D., 2015. Data assemblages, sentient schools and digitised health and physical education
(response to Gard). Sport, Education and Society. 20(1). pp.122-132.
Mazumder, S., Bhadoria, R. S. and Deka, G. C., 2017. Distributed Computing in Big Data
Analytics. AG: Springer International Publishing.
O’Keefe, C. M., 2014, September. Privacy and Confidentiality in Service Science and Big Data
Analytics. In IFIP International Summer School on Privacy and Identity
Management (pp. 54-70). Springer, Cham.
Shao, B. B. and et.al., 2018. A data-analytics approach to identifying hidden critical suppliers in
supply networks: Development of nexus supplier index. Decision Support Systems. 114.
pp.37-48.
Wu, P. J., Chen, M. C. and Tsau, C. K., 2017. The data-driven analytics for investigating cargo
loss in logistics systems. International Journal of Physical Distribution & Logistics
Management. 47(1). pp.68-83.
Online
Different modes of operations. 2019. [Online]. Available through:
<http://www.e3businessconsultants.com/erp-consulting/5-types-manufacturing-
processing-theyre-different/>
Website of Ford Australia. 2019. [Online]. Available through:
<https://www.ford.com.au/>
Article of Ford Australia. 2019. [Online]. Available through:
<https://www.ft.com/content/e853f1da-c359-11e2-9bcb-00144feab7de>
Process (batch). 2019. [Online]. Available through:
<https://www.instantgmp.com/feat/batch-production-record/>
7
⊘ This is a preview!⊘
Do you want full access?
Subscribe today to unlock all pages.
Trusted by 1+ million students worldwide
1 out of 9
Related Documents


Your All-in-One AI-Powered Toolkit for Academic Success.
+13062052269
info@desklib.com
Available 24*7 on WhatsApp / Email
![[object Object]](/_next/static/media/star-bottom.7253800d.svg)
Unlock your academic potential
Copyright © 2020–2026 A2Z Services. All Rights Reserved. Developed and managed by ZUCOL.