Numeracy and Data Analysis Report: Statistical Analysis & Forecasting
VerifiedAdded on 2023/06/05
|10
|1399
|70
Report
AI Summary
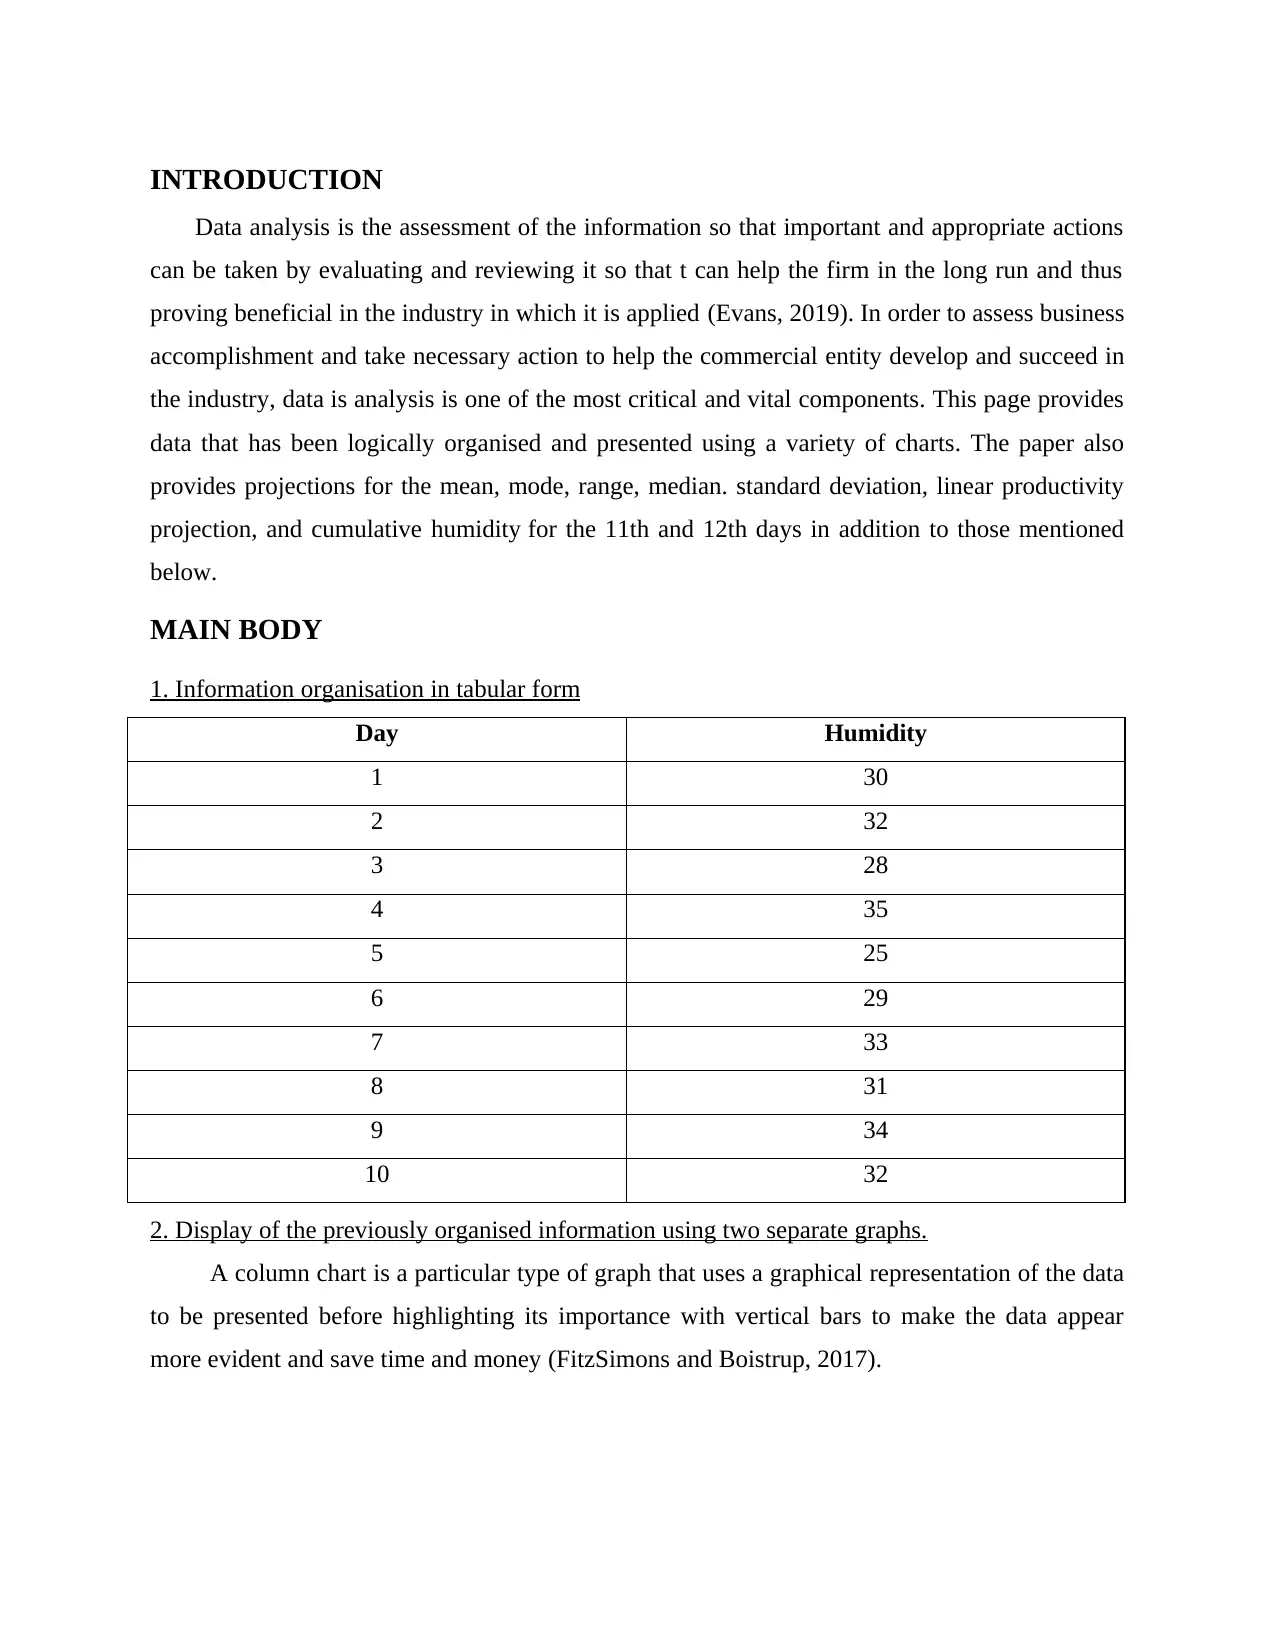
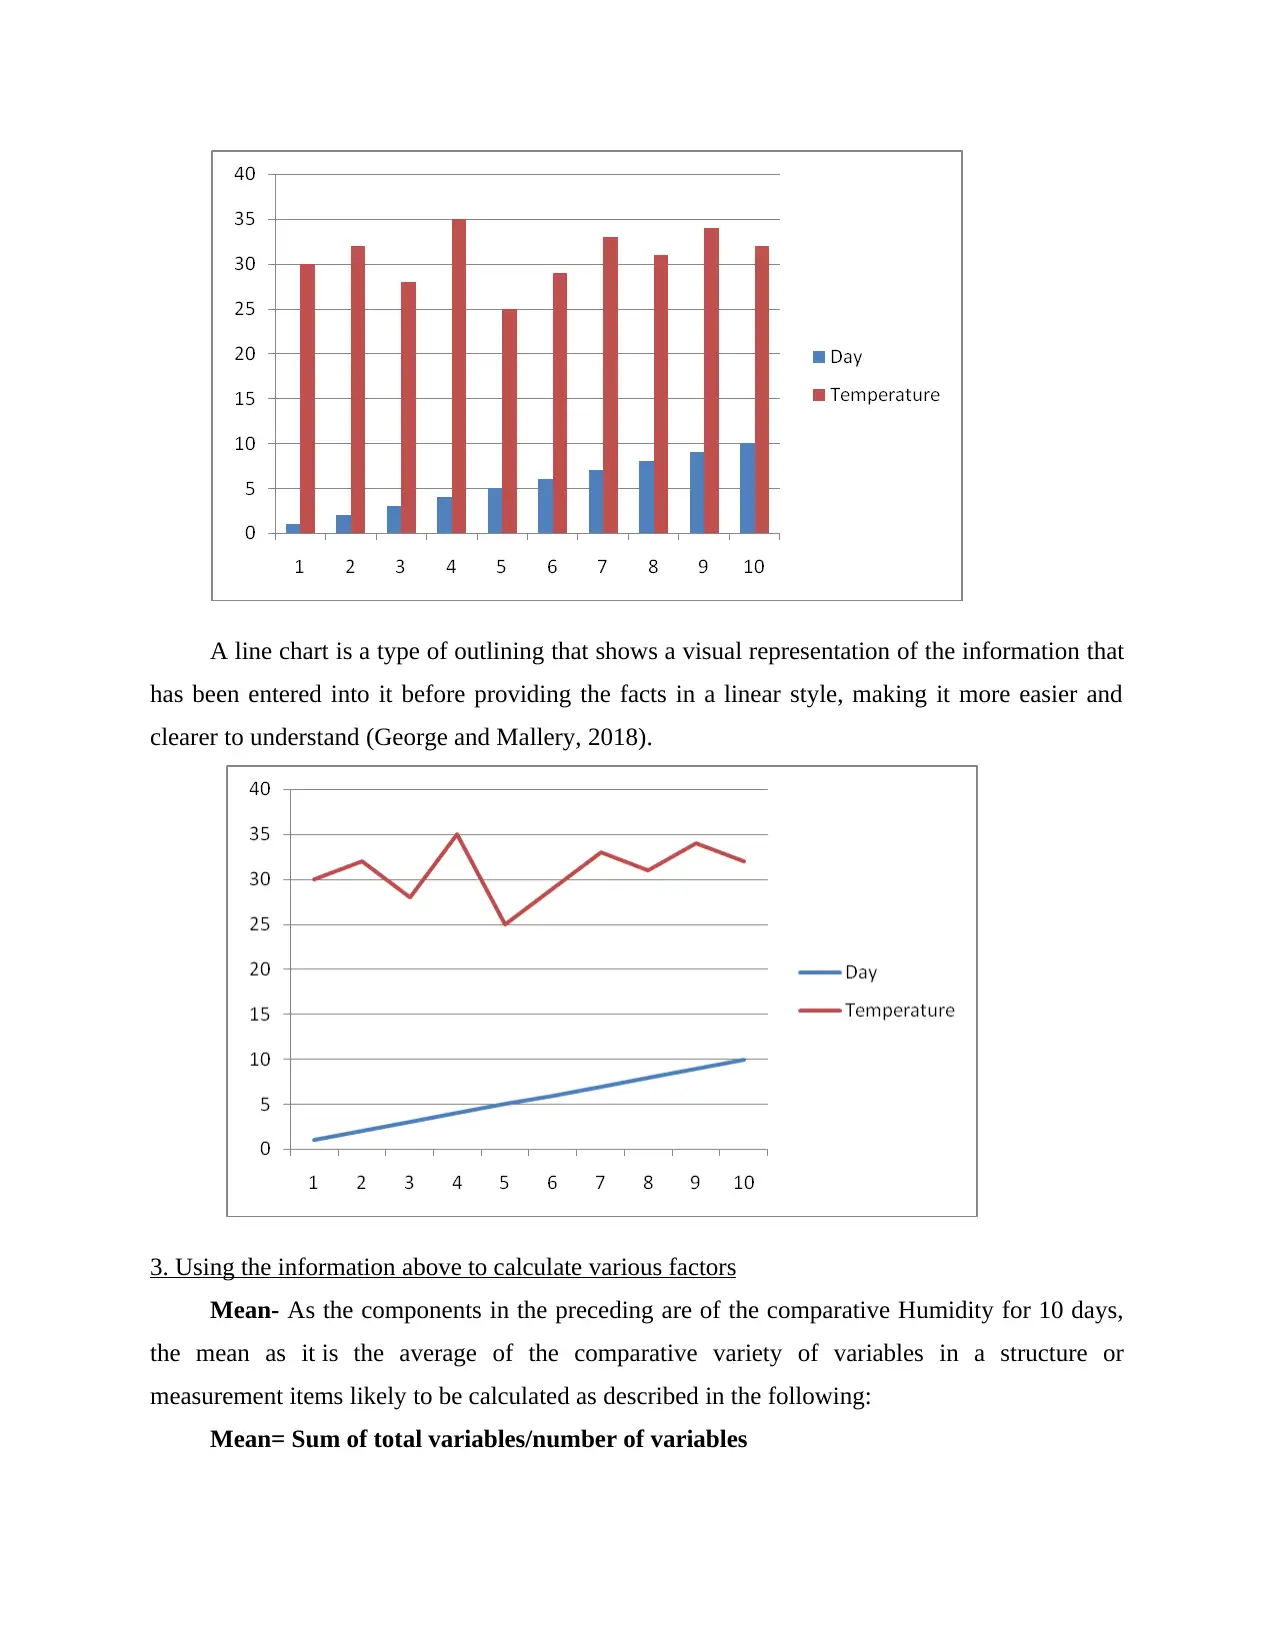
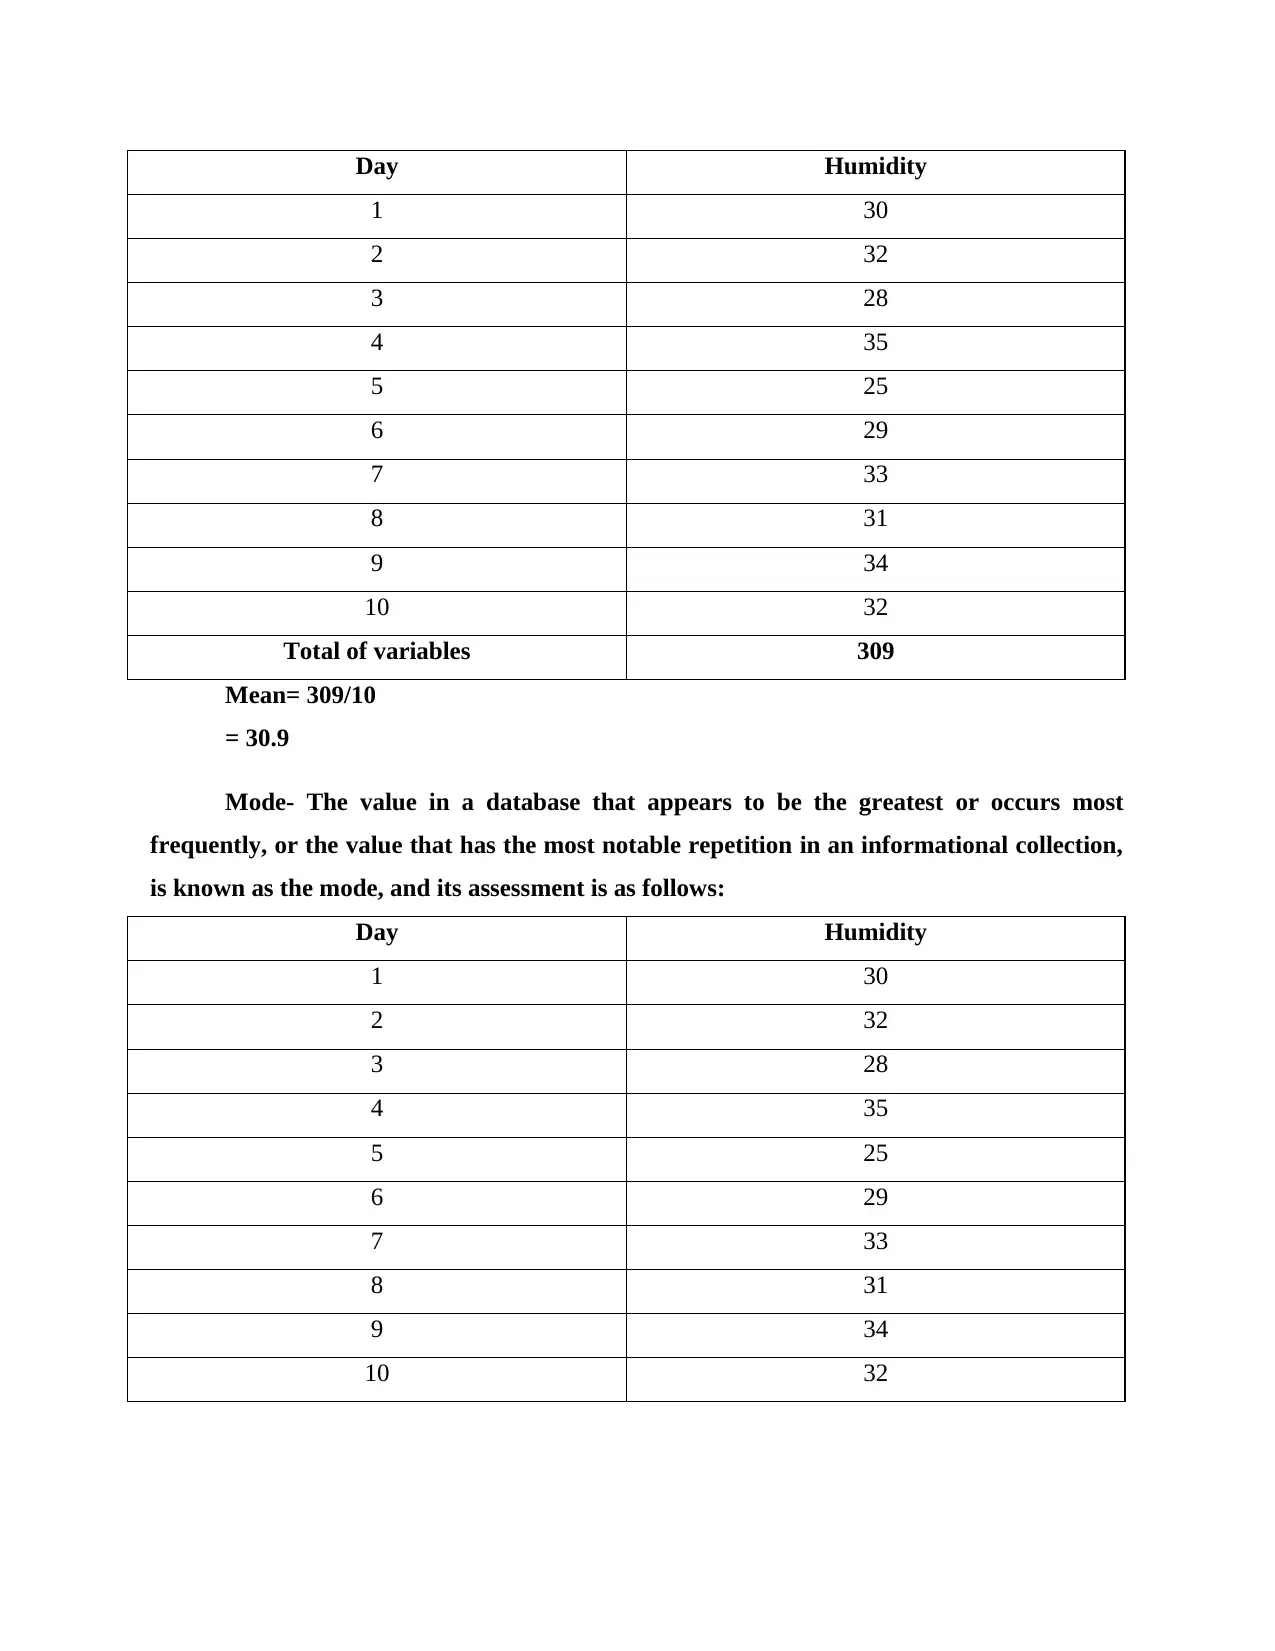
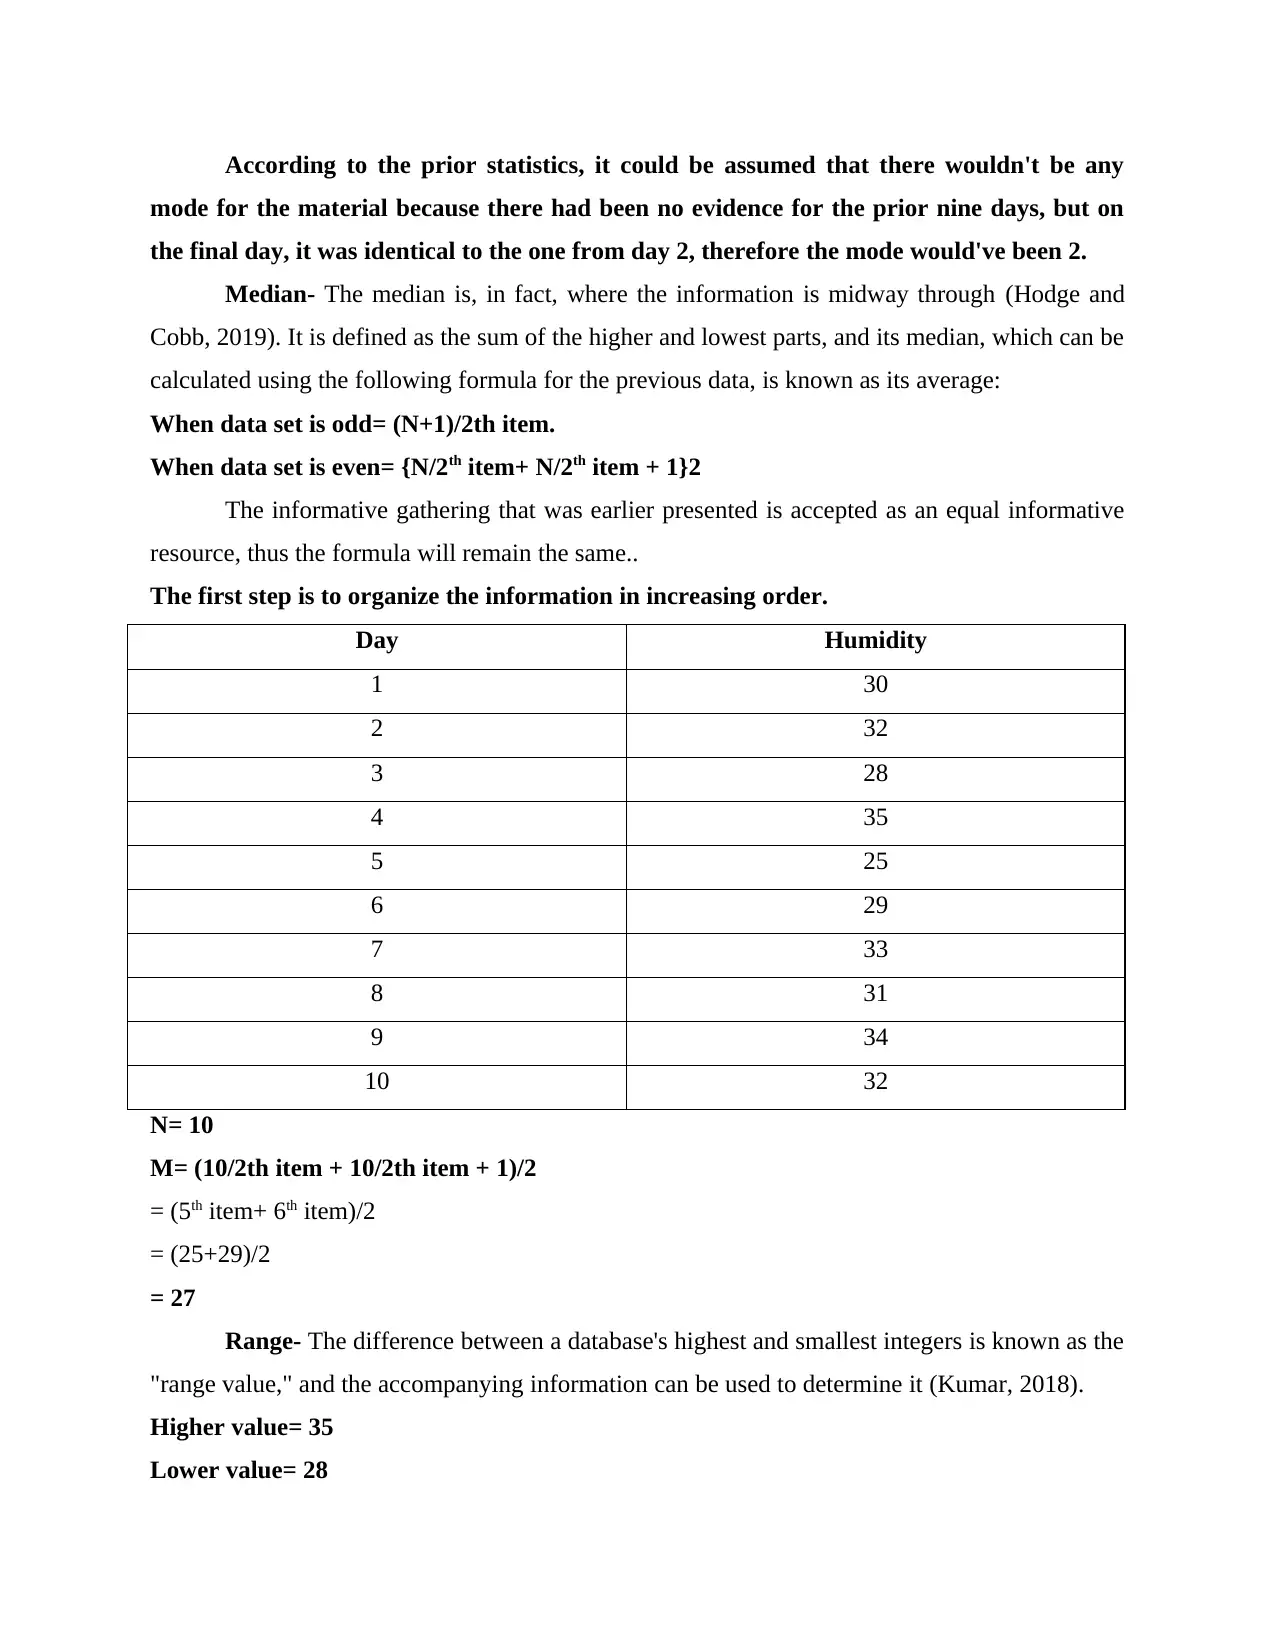
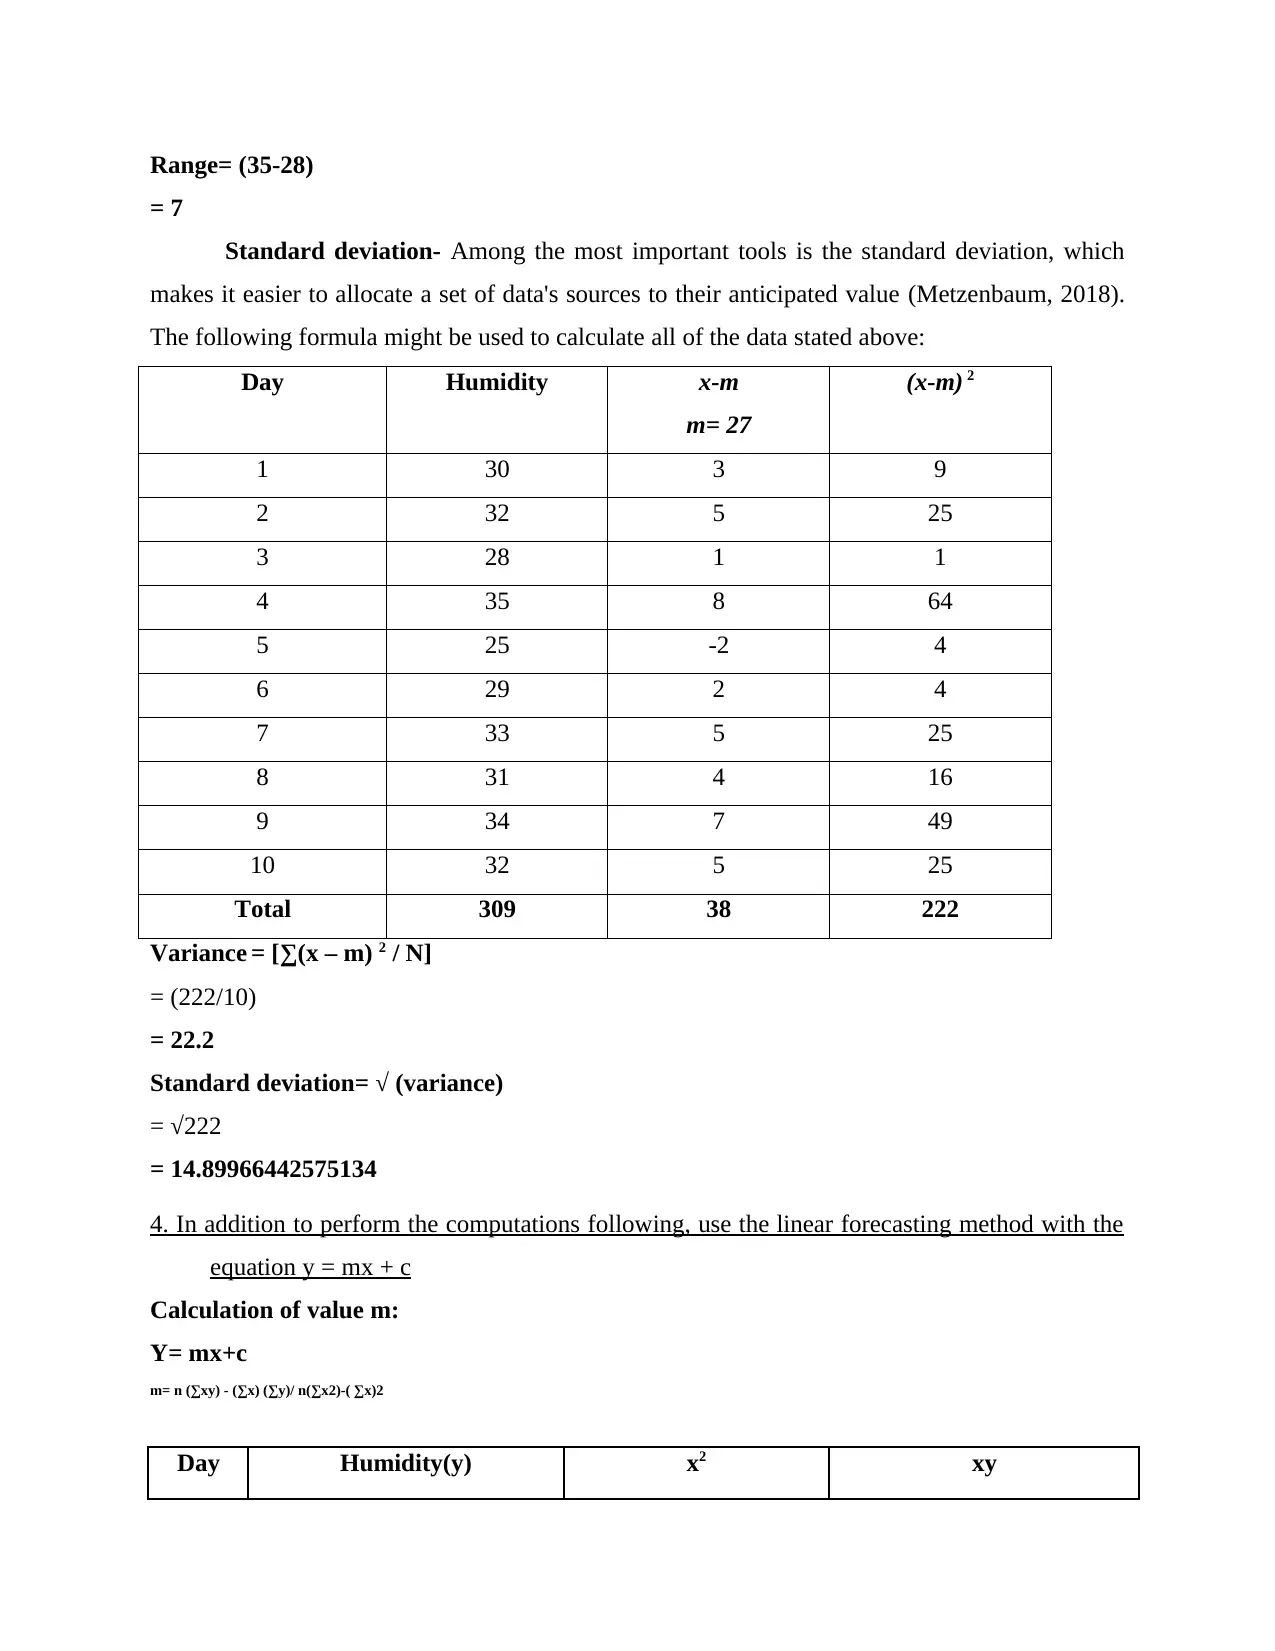
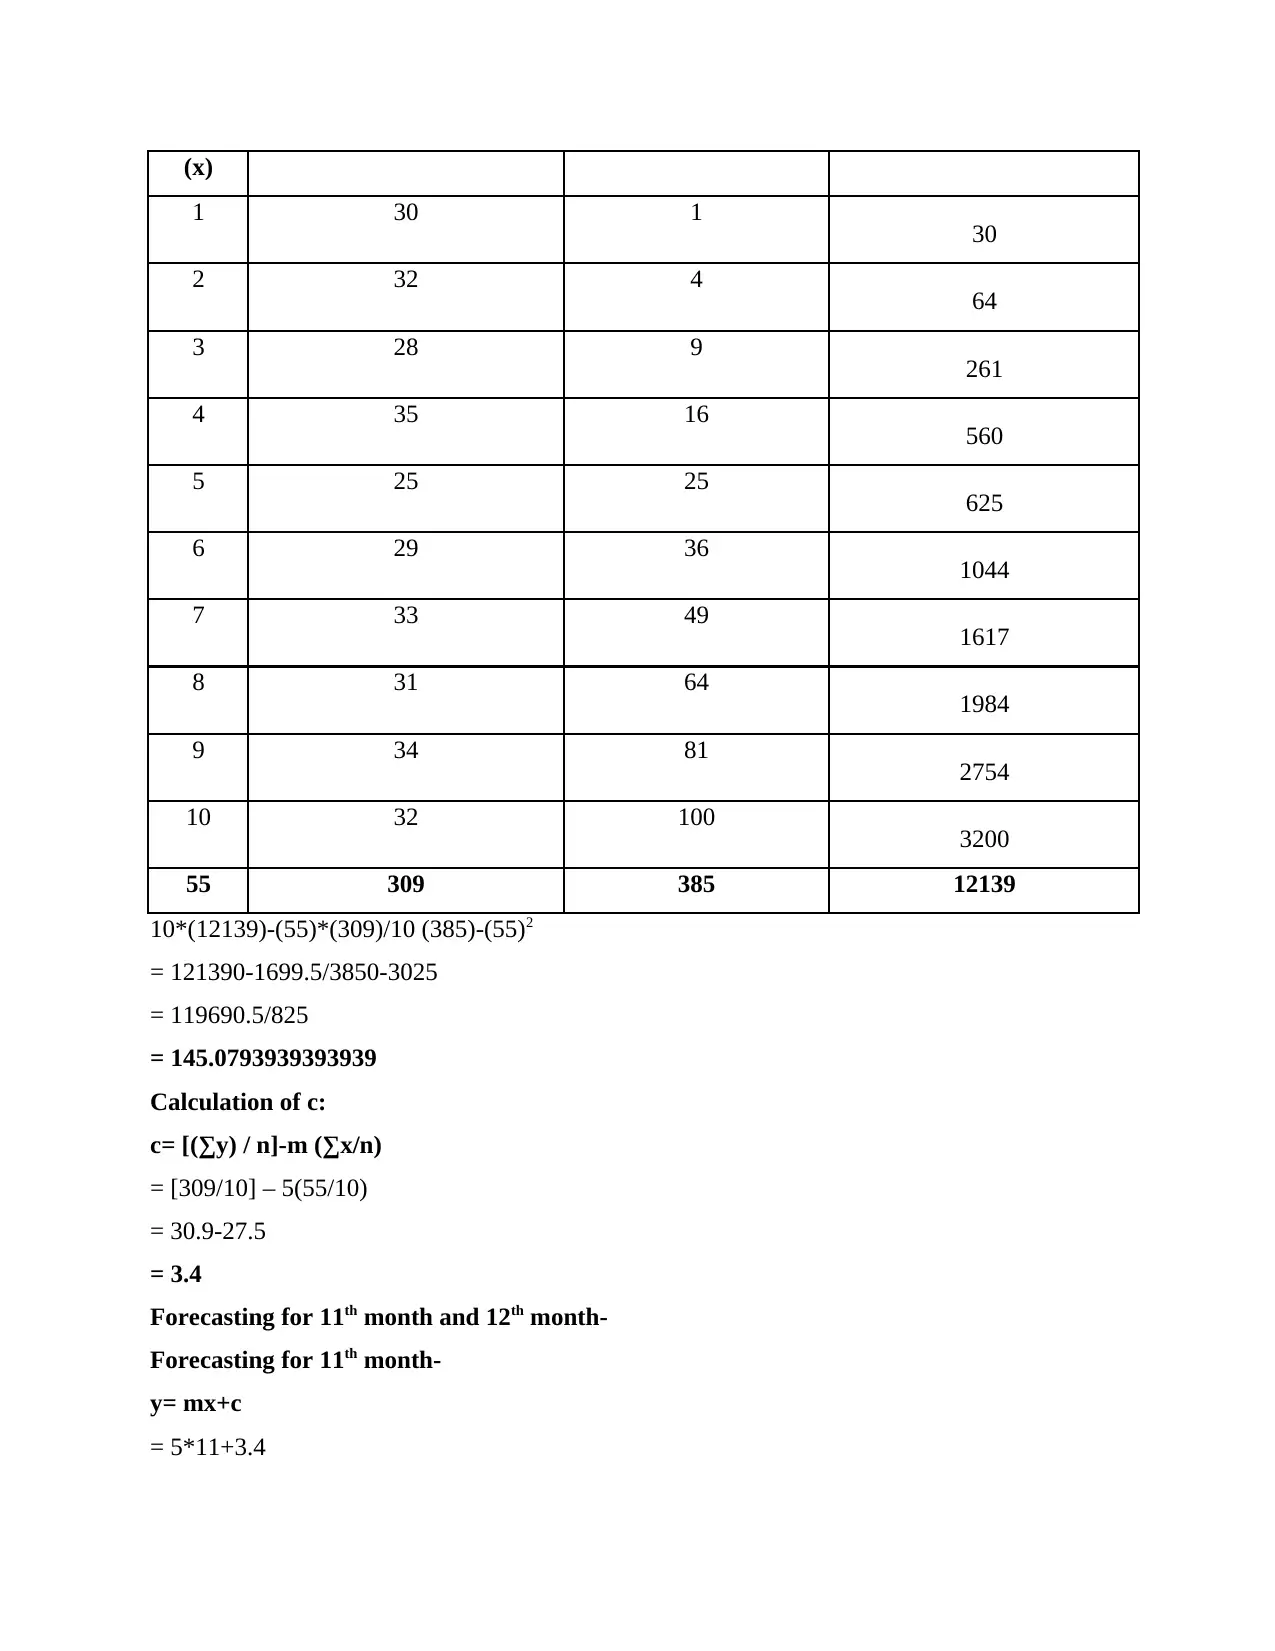
This report provides a comprehensive analysis of a given dataset using various statistical methods. It begins by organizing the data in a tabular format and then visually represents it using column and line charts. The report calculates key statistical measures such as mean, mode, median, range, and standard deviation. Furthermore, it employs linear forecasting using the equation y = mx + c to predict values for the 11th and 12th periods. The analysis aims to evaluate factors influencing daily operations, enabling informed decision-making and adjustments for organizational improvement. The report concludes by emphasizing the significance of quantitative analysis in assessing a firm's position and guiding strategic actions.

Numeracy and data
analysis
analysis
Paraphrase This Document
Need a fresh take? Get an instant paraphrase of this document with our AI Paraphraser

Contents
Contents...........................................................................................................................................2
INTRODUCTION...........................................................................................................................1
MAIN BODY..................................................................................................................................1
1. Information organisation in tabular form................................................................................1
2. Display of the previously organised information using two separate graphs..........................1
3. Using the information above to calculate various factors.......................................................2
4. In addition to perform the computations following, use the linear forecasting method with
the equation y = mx + c...............................................................................................................5
CONCLUSION................................................................................................................................7
REFERENCES................................................................................................................................8

INTRODUCTION
Data analysis is the assessment of the information so that important and appropriate actions
can be taken by evaluating and reviewing it so that t can help the firm in the long run and thus
proving beneficial in the industry in which it is applied (Evans, 2019). In order to assess business
accomplishment and take necessary action to help the commercial entity develop and succeed in
the industry, data is analysis is one of the most critical and vital components. This page provides
data that has been logically organised and presented using a variety of charts. The paper also
provides projections for the mean, mode, range, median. standard deviation, linear productivity
projection, and cumulative humidity for the 11th and 12th days in addition to those mentioned
below.
MAIN BODY
1. Information organisation in tabular form
Day Humidity
1 30
2 32
3 28
4 35
5 25
6 29
7 33
8 31
9 34
10 32
2. Display of the previously organised information using two separate graphs.
A column chart is a particular type of graph that uses a graphical representation of the data
to be presented before highlighting its importance with vertical bars to make the data appear
more evident and save time and money (FitzSimons and Boistrup, 2017).
⊘ This is a preview!⊘
Do you want full access?
Subscribe today to unlock all pages.

Trusted by 1+ million students worldwide

A line chart is a type of outlining that shows a visual representation of the information that
has been entered into it before providing the facts in a linear style, making it more easier and
clearer to understand (George and Mallery, 2018).
3. Using the information above to calculate various factors
Mean- As the components in the preceding are of the comparative Humidity for 10 days,
the mean as it is the average of the comparative variety of variables in a structure or
measurement items likely to be calculated as described in the following:
Mean= Sum of total variables/number of variables
Paraphrase This Document
Need a fresh take? Get an instant paraphrase of this document with our AI Paraphraser

Day Humidity
1 30
2 32
3 28
4 35
5 25
6 29
7 33
8 31
9 34
10 32
Total of variables 309
Mean= 309/10
= 30.9
Mode- The value in a database that appears to be the greatest or occurs most
frequently, or the value that has the most notable repetition in an informational collection,
is known as the mode, and its assessment is as follows:
Day Humidity
1 30
2 32
3 28
4 35
5 25
6 29
7 33
8 31
9 34
10 32
1 30
2 32
3 28
4 35
5 25
6 29
7 33
8 31
9 34
10 32
Total of variables 309
Mean= 309/10
= 30.9
Mode- The value in a database that appears to be the greatest or occurs most
frequently, or the value that has the most notable repetition in an informational collection,
is known as the mode, and its assessment is as follows:
Day Humidity
1 30
2 32
3 28
4 35
5 25
6 29
7 33
8 31
9 34
10 32

According to the prior statistics, it could be assumed that there wouldn't be any
mode for the material because there had been no evidence for the prior nine days, but on
the final day, it was identical to the one from day 2, therefore the mode would've been 2.
Median- The median is, in fact, where the information is midway through (Hodge and
Cobb, 2019). It is defined as the sum of the higher and lowest parts, and its median, which can be
calculated using the following formula for the previous data, is known as its average:
When data set is odd= (N+1)/2th item.
When data set is even= {N/2th item+ N/2th item + 1}2
The informative gathering that was earlier presented is accepted as an equal informative
resource, thus the formula will remain the same..
The first step is to organize the information in increasing order.
Day Humidity
1 30
2 32
3 28
4 35
5 25
6 29
7 33
8 31
9 34
10 32
N= 10
M= (10/2th item + 10/2th item + 1)/2
= (5th item+ 6th item)/2
= (25+29)/2
= 27
Range- The difference between a database's highest and smallest integers is known as the
"range value," and the accompanying information can be used to determine it (Kumar, 2018).
Higher value= 35
Lower value= 28
⊘ This is a preview!⊘
Do you want full access?
Subscribe today to unlock all pages.

Trusted by 1+ million students worldwide

Range= (35-28)
= 7
Standard deviation- Among the most important tools is the standard deviation, which
makes it easier to allocate a set of data's sources to their anticipated value (Metzenbaum, 2018).
The following formula might be used to calculate all of the data stated above:
Day Humidity x-m
m= 27
(x-m) 2
1 30 3 9
2 32 5 25
3 28 1 1
4 35 8 64
5 25 -2 4
6 29 2 4
7 33 5 25
8 31 4 16
9 34 7 49
10 32 5 25
Total 309 38 222
Variance = [∑(x – m) 2 / N]
= (222/10)
= 22.2
Standard deviation= √ (variance)
= √222
= 14.89966442575134
4. In addition to perform the computations following, use the linear forecasting method with the
equation y = mx + c
Calculation of value m:
Y= mx+c
m= n (∑xy) - (∑x) (∑y)/ n(∑x2)-( ∑x)2
Day Humidity(y) x2 xy
Paraphrase This Document
Need a fresh take? Get an instant paraphrase of this document with our AI Paraphraser

(x)
1 30 1 30
2 32 4 64
3 28 9 261
4 35 16 560
5 25 25 625
6 29 36 1044
7 33 49 1617
8 31 64 1984
9 34 81 2754
10 32 100 3200
55 309 385 12139
10*(12139)-(55)*(309)/10 (385)-(55)2
= 121390-1699.5/3850-3025
= 119690.5/825
= 145.0793939393939
Calculation of c:
c= [(∑y) / n]-m (∑x/n)
= [309/10] – 5(55/10)
= 30.9-27.5
= 3.4
Forecasting for 11th month and 12th month-
Forecasting for 11th month-
y= mx+c
= 5*11+3.4

= 58.4
Forecasting for 12th month-
= 5*12+3.4
= 63.4
CONCLUSION
Regardless of the sector in which an organisation operates, quantitative analysis is essential
since it aids in carefully evaluating all of the factors which have an influence on everyday
operations and enables prompt implementation of required adjustments. Additionally, it is
possible to deduce that each and every calculation made earlier, including mean, mode, median,
range, and standard deviation, will be significant in determining the firm's existing and true
position.
⊘ This is a preview!⊘
Do you want full access?
Subscribe today to unlock all pages.

Trusted by 1+ million students worldwide

REFERENCES
Books and journals
Evans, I.S., 2019. General geomorphometry, derivatives of altitude, and descriptive statistics.
In Spatial analysis in geomorphology (pp. 17-90). Routledge.
FitzSimons, G. E. and Boistrup, L. B., 2017. In the workplace mathematics does not announce
itself: Towards overcoming the hiatus between mathematics education and work.
Educational Studies in Mathematics. 95(3). pp.329-349.
George, D. and Mallery, P., 2018. Descriptive statistics. In IBM SPSS Statistics 25 Step by
Step (pp. 126-134). Routledge.
Hodge, L. L. and Cobb, P., 2019. Two views of culture and their implications for mathematics
teaching and learning. Urban Education. 54(6). pp.860-884.
Kumar, A., 2018. Implementation core Business Intelligence System using modern IT
Development Practices (Agile & DevOps). International Journal of Management, IT
and Engineering. 8(9). pp.444-464.
Metzenbaum, S.H., 2018. CHAPTER SIXTEEN The Future of Data and Analytics. Government
for the Future: Reflection and Vision for Tomorrow's Leaders, p.241.
1 out of 10
Related Documents
Your All-in-One AI-Powered Toolkit for Academic Success.
+13062052269
info@desklib.com
Available 24*7 on WhatsApp / Email
Unlock your academic potential
Copyright © 2020–2025 A2Z Services. All Rights Reserved. Developed and managed by ZUCOL.


