Numeracy and Data Analysis: Phone Call Data Analysis and Forecasting

Verified

Added on  2023/01/07

|9
|1485
|61
Homework Assignment
AI Summary
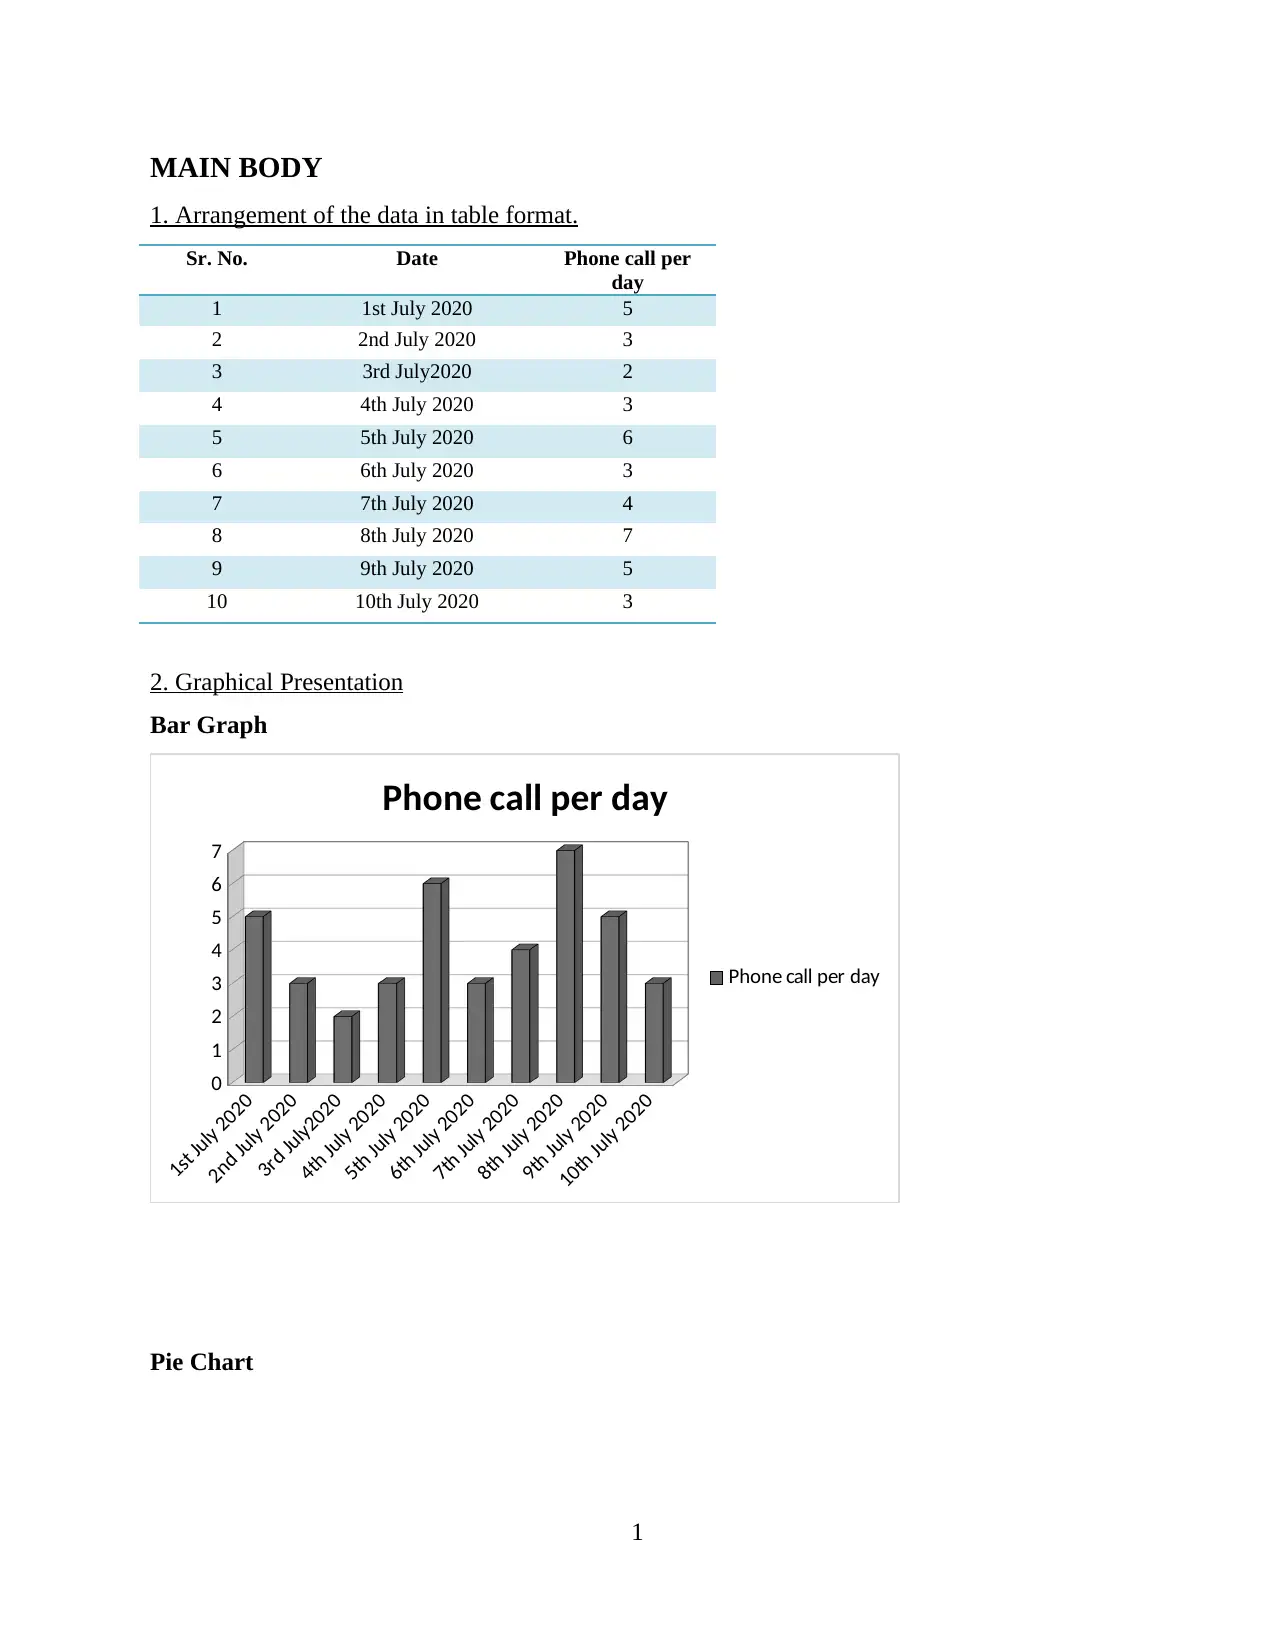
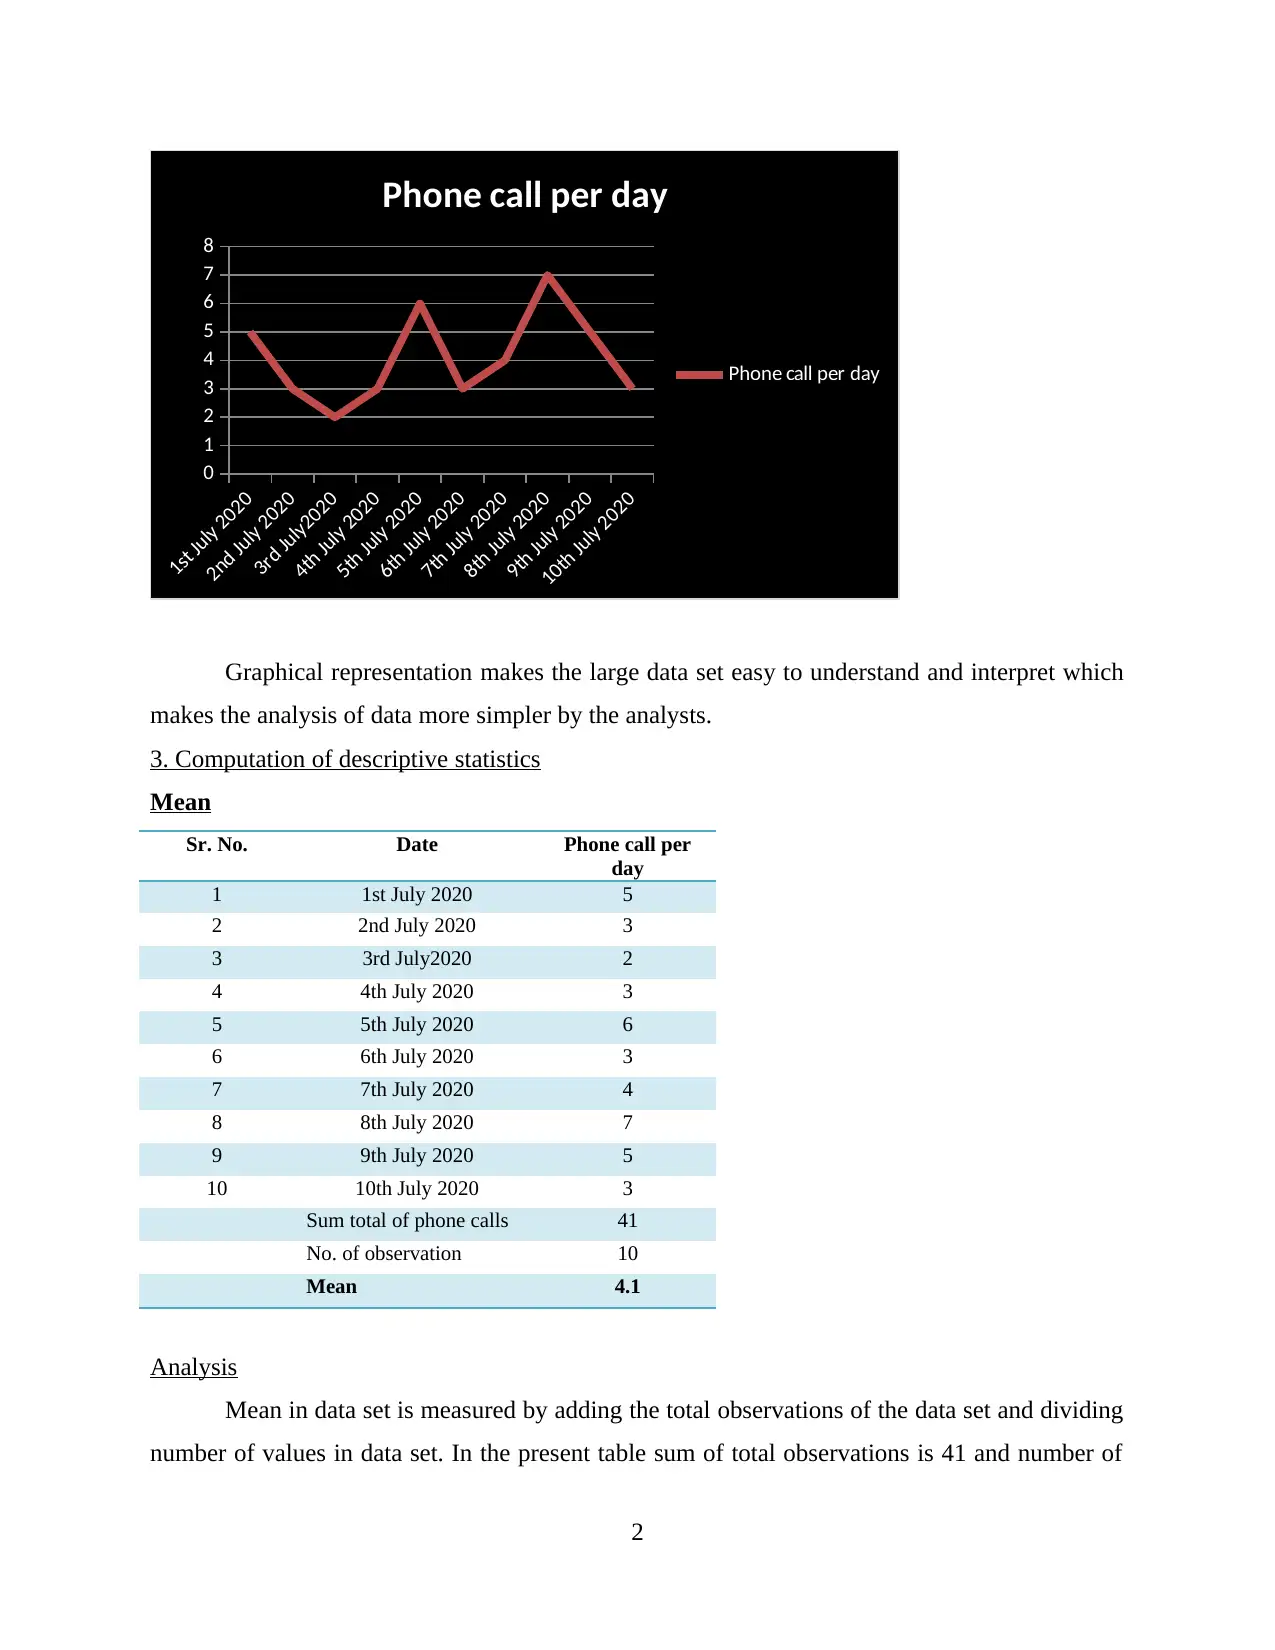
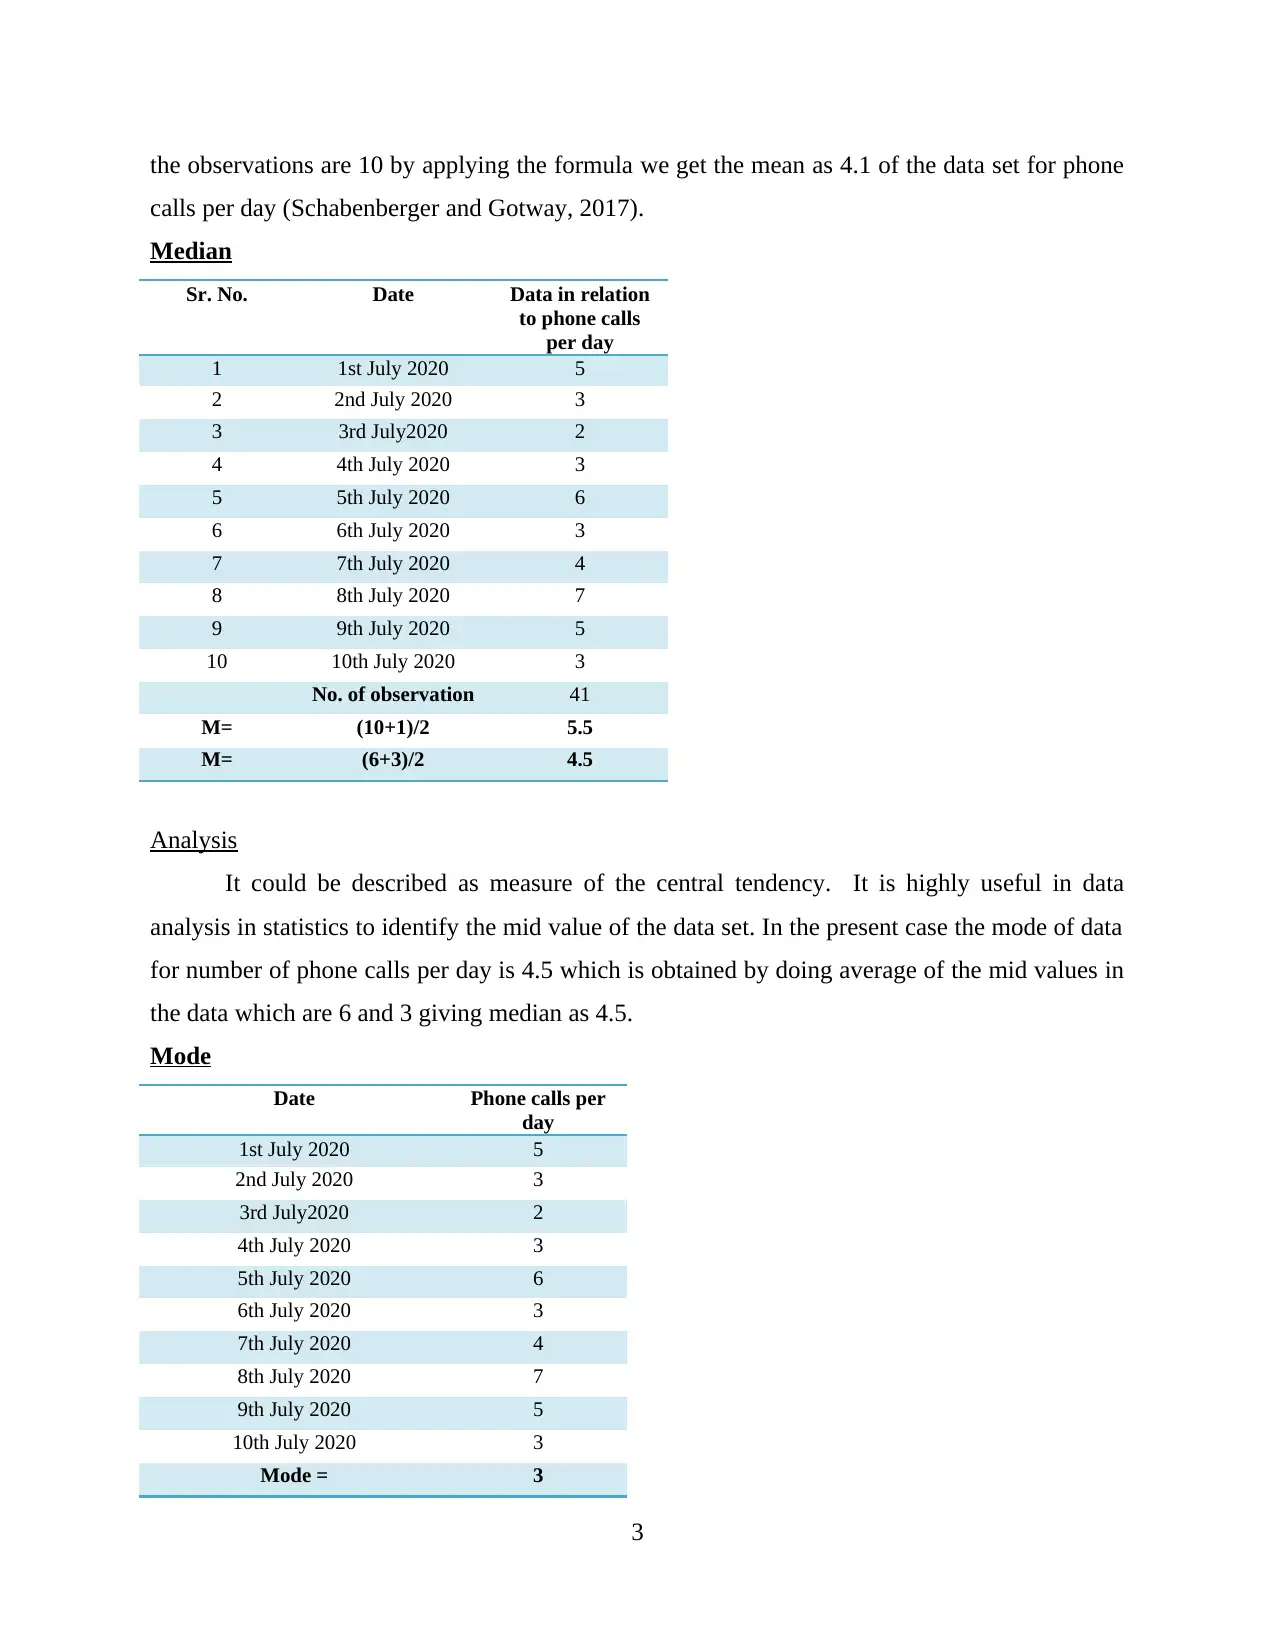
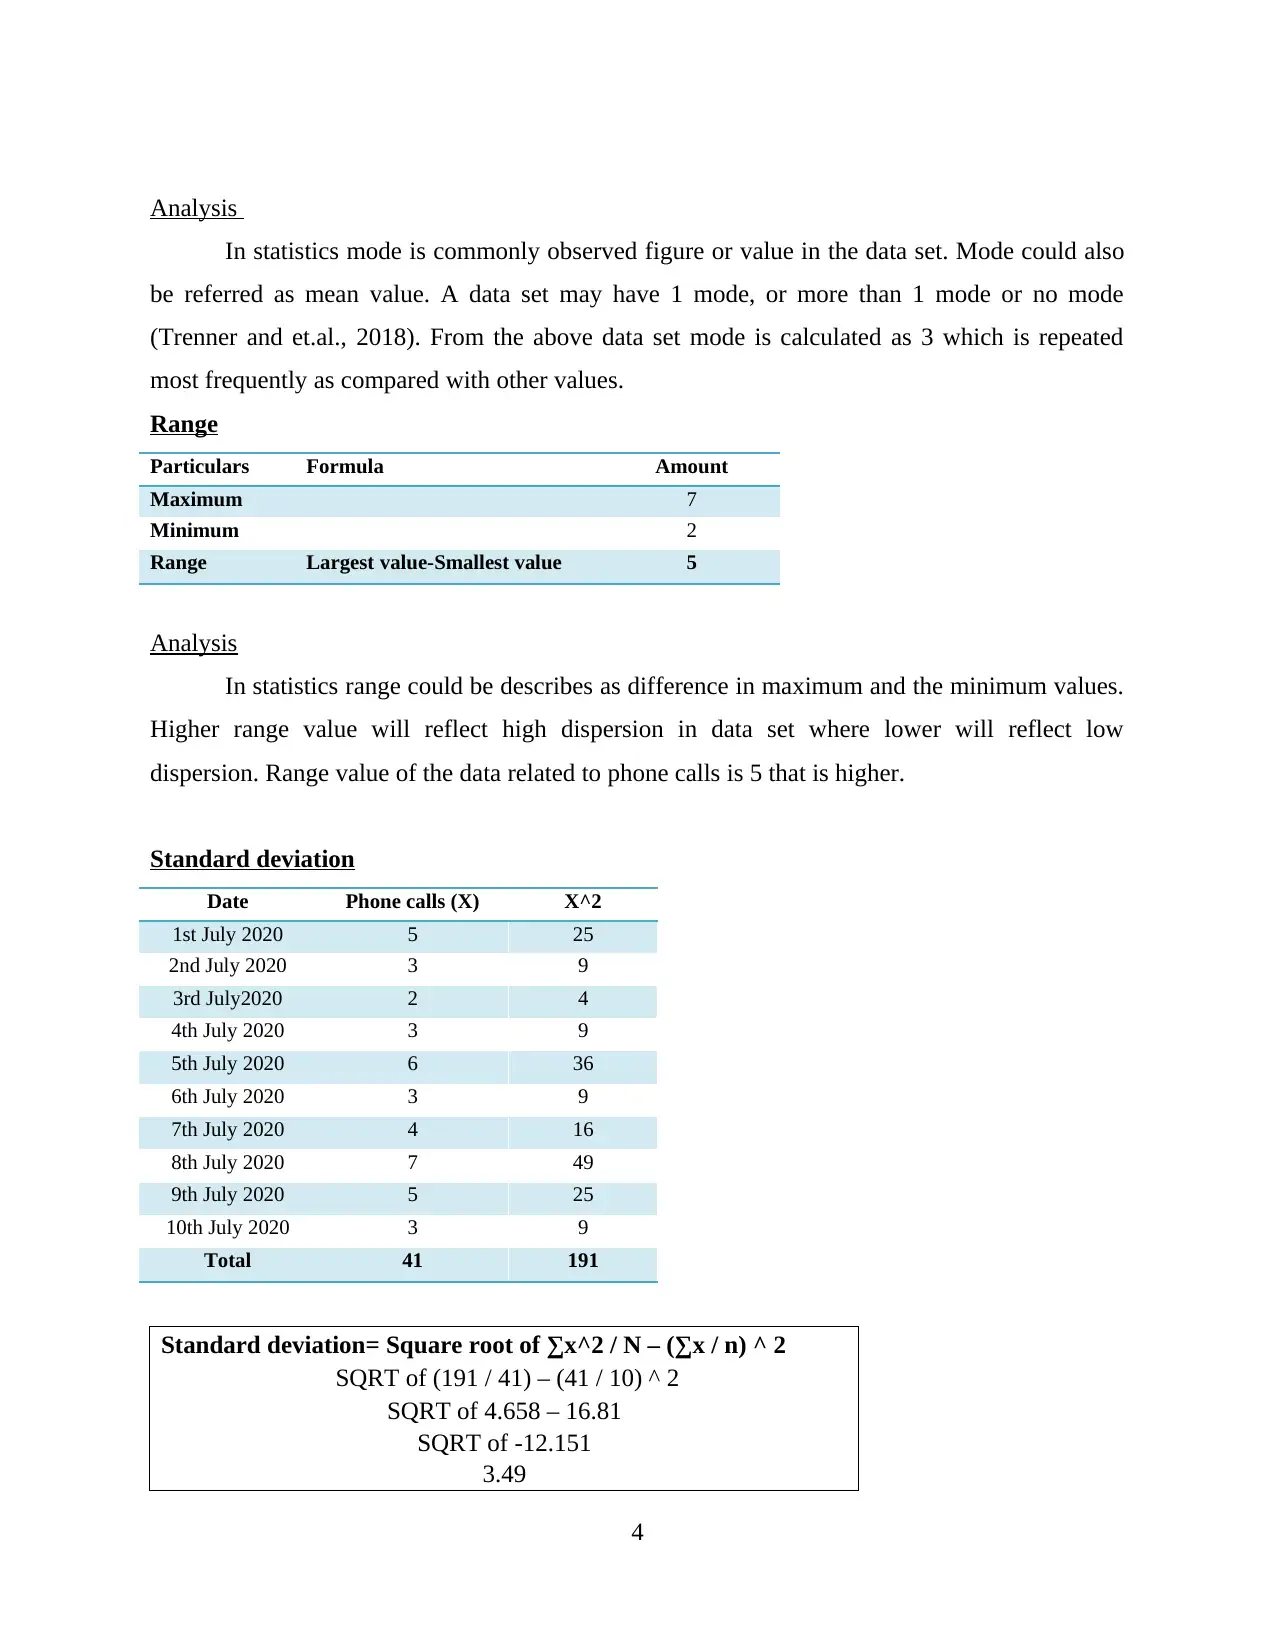
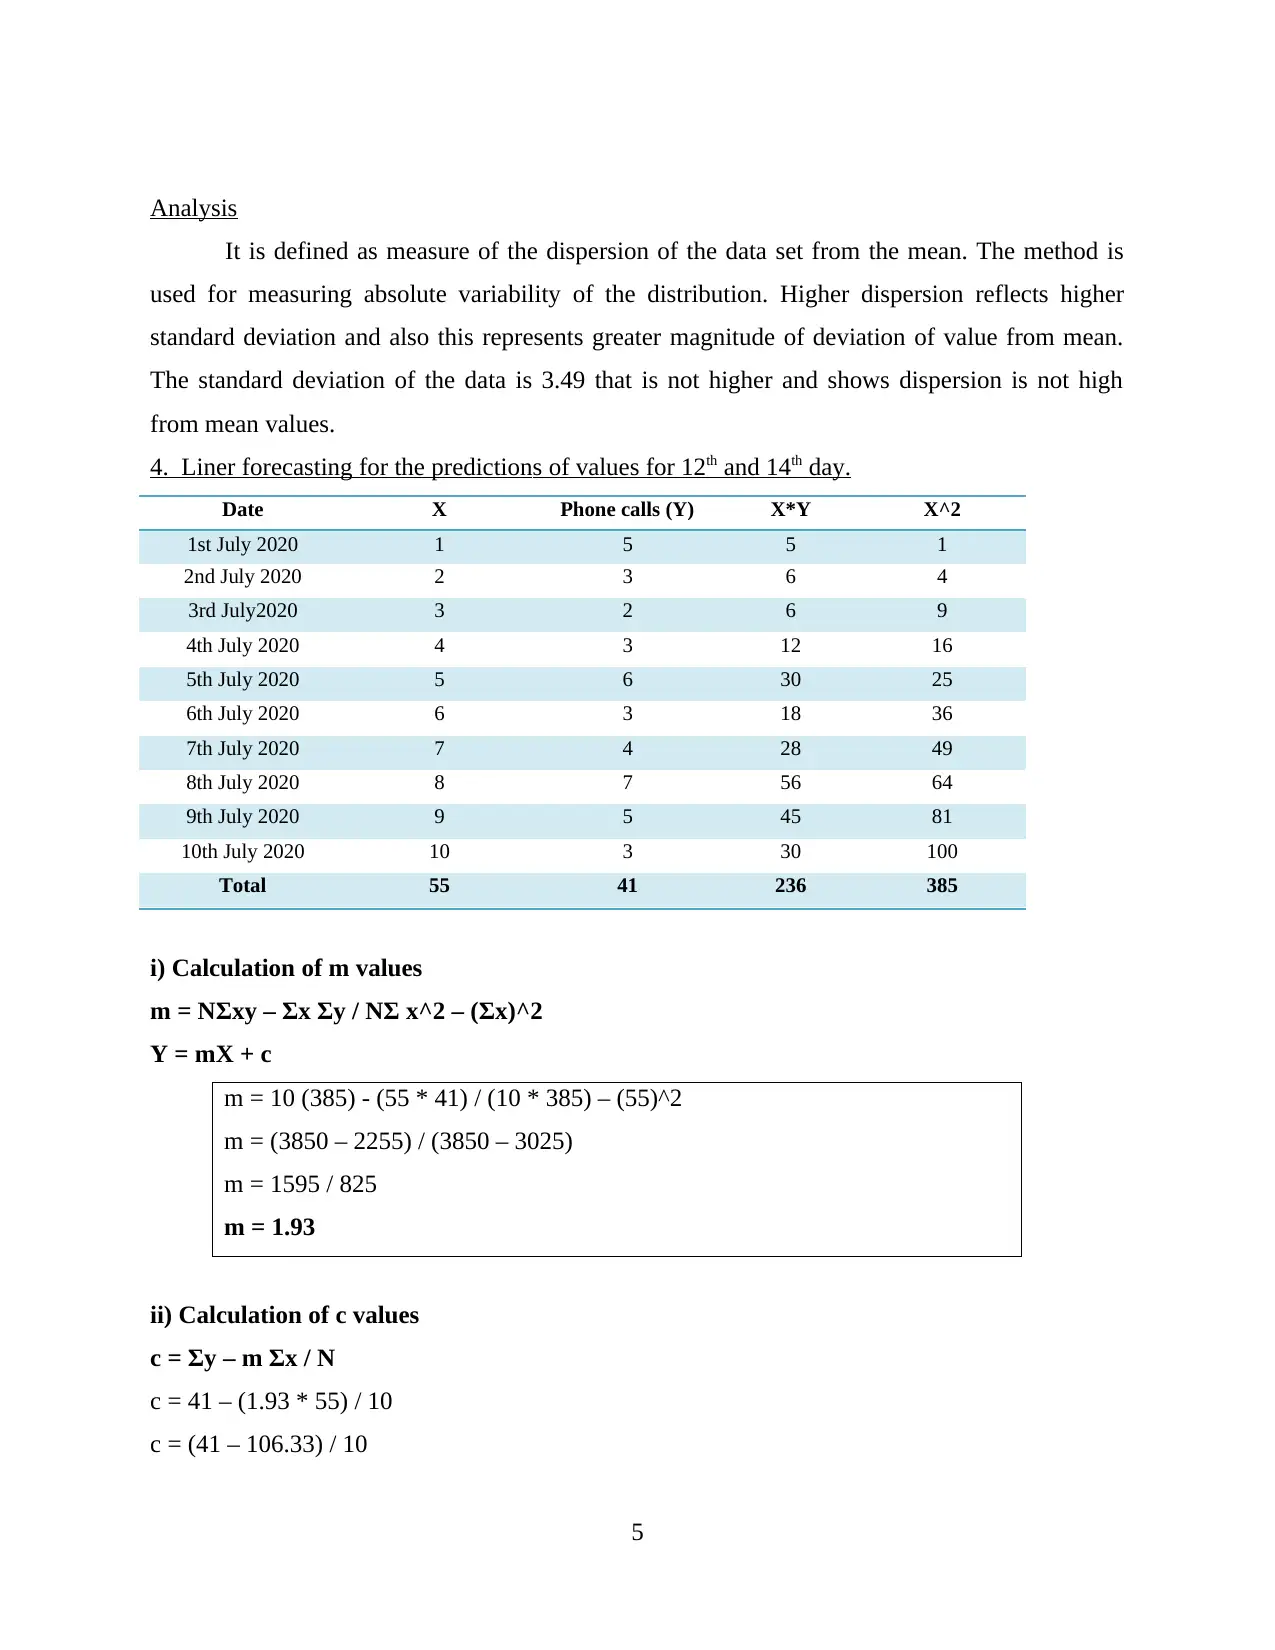
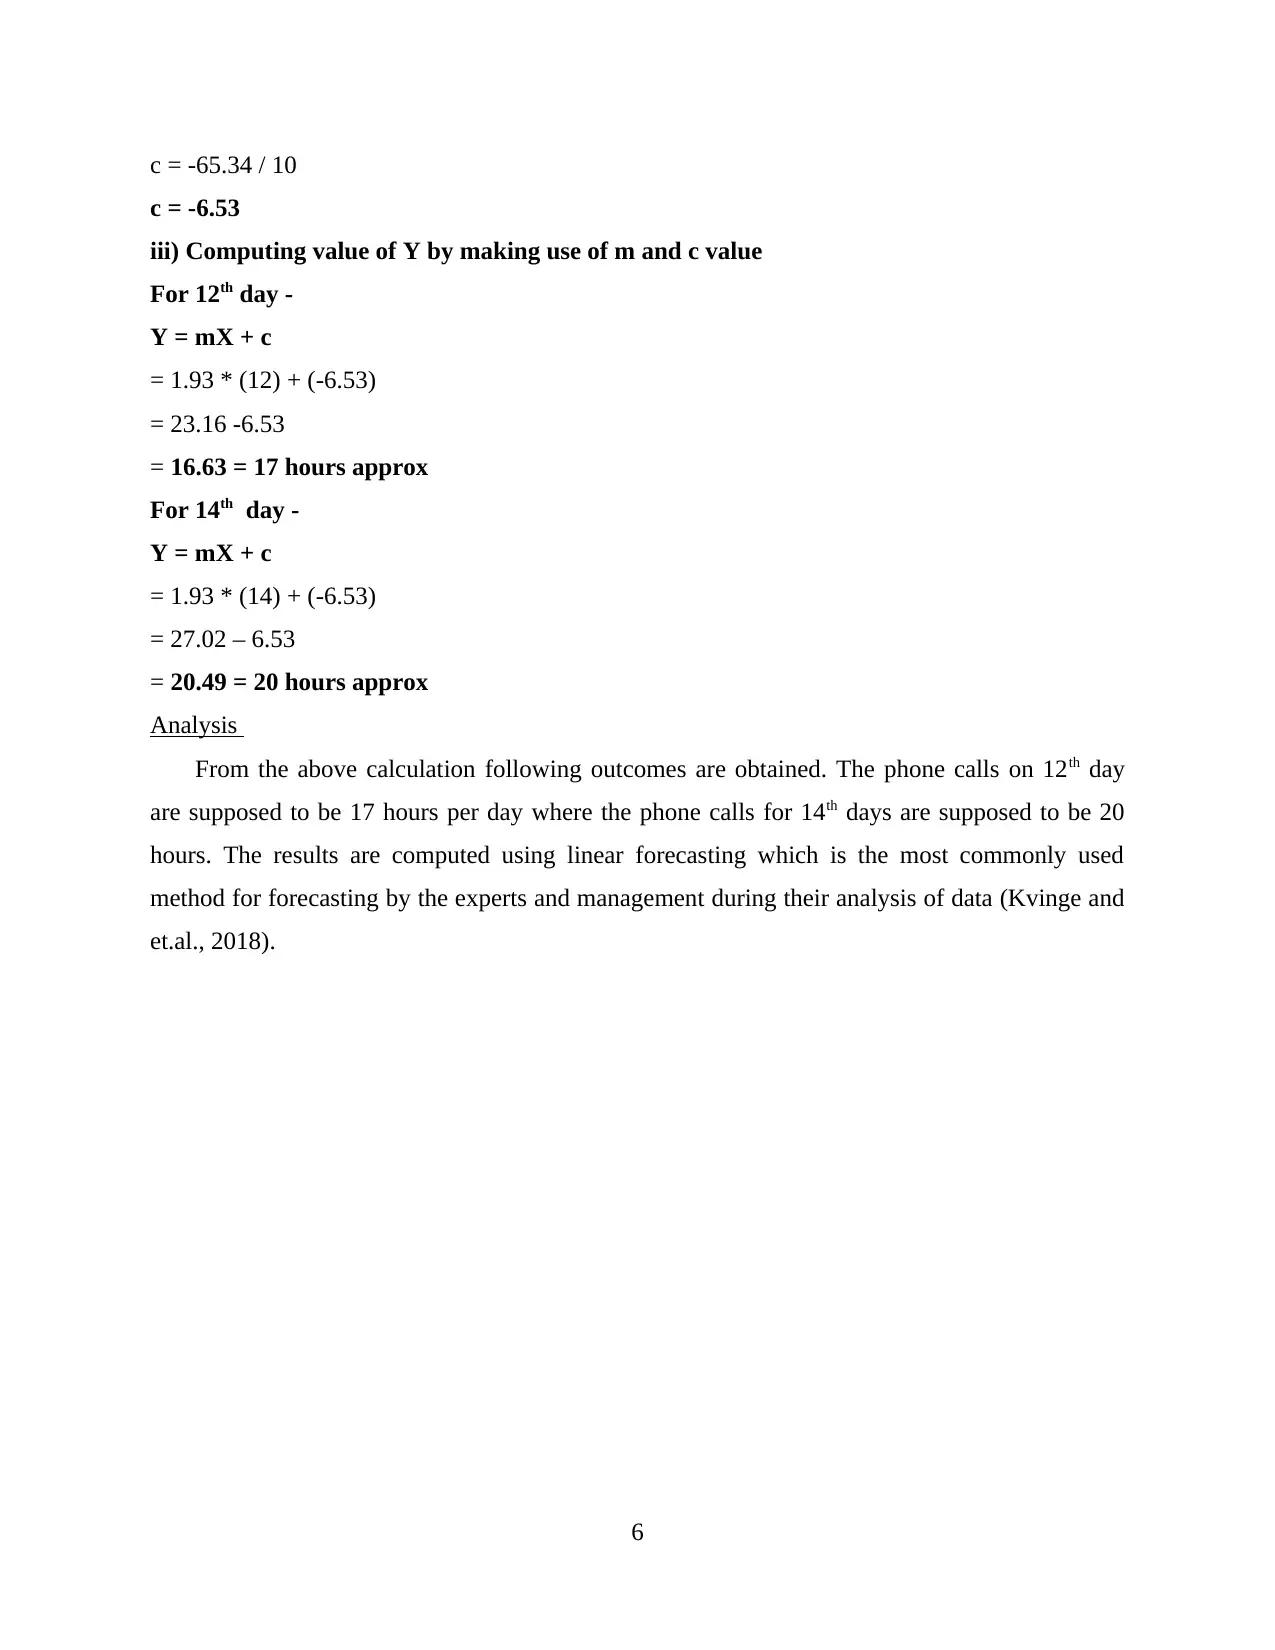
This assignment analyzes phone call data using various data analysis techniques. It begins by arranging the data in a table format and then presents the data graphically using bar and pie charts for easy interpretation. Descriptive statistics, including mean, median, mode, range, and standard deviation, are computed to summarize the data's central tendency and dispersion. Finally, the assignment employs linear forecasting to predict the number of phone calls on the 12th and 14th days, providing insights into future trends. The analysis incorporates relevant formulas and interpretations, referencing statistical methods for a comprehensive understanding of the data.
Document Page
NUMERACY AND DATA
ANALYSIS
tabler-icon-diamond-filled.svg

Secure Best Marks with AI Grader

Need help grading? Try our AI Grader for instant feedback on your assignments.
Document Page
TABLE OF CONTENTS
TABLE OF CONTENTS................................................................................................................2
MAIN BODY..................................................................................................................................1
1. Arrangement of the data in table format..................................................................................1
2. Graphical Presentation.............................................................................................................1
3. Computation of descriptive statistics.......................................................................................2
4. Liner forecasting for the predictions of values for 12th and 14th day......................................5
REFERENCES................................................................................................................................7
Document Page
MAIN BODY
1. Arrangement of the data in table format.
Sr. No. Date Phone call per
day
1 1st July 2020 5
2 2nd July 2020 3
3 3rd July2020 2
4 4th July 2020 3
5 5th July 2020 6
6 6th July 2020 3
7 7th July 2020 4
8 8th July 2020 7
9 9th July 2020 5
10 10th July 2020 3
2. Graphical Presentation
Bar Graph
1st July 2020
2nd July 2020
3rd July2020
4th July 2020
5th July 2020
6th July 2020
7th July 2020
8th July 2020
9th July 2020
10th July 2020
0
1
2
3
4
5
6
7
Phone call per day
Phone call per day
Pie Chart
1
Document Page
1st July 2020
2nd July 2020
3rd July2020
4th July 2020
5th July 2020
6th July 2020
7th July 2020
8th July 2020
9th July 2020
10th July 2020
0
1
2
3
4
5
6
7
8
Phone call per day
Phone call per day
Graphical representation makes the large data set easy to understand and interpret which
makes the analysis of data more simpler by the analysts.
3. Computation of descriptive statistics
Mean
Sr. No. Date Phone call per
day
1 1st July 2020 5
2 2nd July 2020 3
3 3rd July2020 2
4 4th July 2020 3
5 5th July 2020 6
6 6th July 2020 3
7 7th July 2020 4
8 8th July 2020 7
9 9th July 2020 5
10 10th July 2020 3
Sum total of phone calls 41
No. of observation 10
Mean 4.1
Analysis
Mean in data set is measured by adding the total observations of the data set and dividing
number of values in data set. In the present table sum of total observations is 41 and number of
2
tabler-icon-diamond-filled.svg

Secure Best Marks with AI Grader

Need help grading? Try our AI Grader for instant feedback on your assignments.
Document Page
the observations are 10 by applying the formula we get the mean as 4.1 of the data set for phone
calls per day (Schabenberger and Gotway, 2017).
Median
Sr. No. Date Data in relation
to phone calls
per day
1 1st July 2020 5
2 2nd July 2020 3
3 3rd July2020 2
4 4th July 2020 3
5 5th July 2020 6
6 6th July 2020 3
7 7th July 2020 4
8 8th July 2020 7
9 9th July 2020 5
10 10th July 2020 3
No. of observation 41
M= (10+1)/2 5.5
M= (6+3)/2 4.5
Analysis
It could be described as measure of the central tendency. It is highly useful in data
analysis in statistics to identify the mid value of the data set. In the present case the mode of data
for number of phone calls per day is 4.5 which is obtained by doing average of the mid values in
the data which are 6 and 3 giving median as 4.5.
Mode
Date Phone calls per
day
1st July 2020 5
2nd July 2020 3
3rd July2020 2
4th July 2020 3
5th July 2020 6
6th July 2020 3
7th July 2020 4
8th July 2020 7
9th July 2020 5
10th July 2020 3
Mode = 3
3
Document Page
Analysis
In statistics mode is commonly observed figure or value in the data set. Mode could also
be referred as mean value. A data set may have 1 mode, or more than 1 mode or no mode
(Trenner and et.al., 2018). From the above data set mode is calculated as 3 which is repeated
most frequently as compared with other values.
Range
Particulars Formula Amount
Maximum 7
Minimum 2
Range Largest value-Smallest value 5
Analysis
In statistics range could be describes as difference in maximum and the minimum values.
Higher range value will reflect high dispersion in data set where lower will reflect low
dispersion. Range value of the data related to phone calls is 5 that is higher.
Standard deviation
Date Phone calls (X) X^2
1st July 2020 5 25
2nd July 2020 3 9
3rd July2020 2 4
4th July 2020 3 9
5th July 2020 6 36
6th July 2020 3 9
7th July 2020 4 16
8th July 2020 7 49
9th July 2020 5 25
10th July 2020 3 9
Total 41 191
Standard deviation= Square root of ∑x^2 / N – (∑x / n) ^ 2
SQRT of (191 / 41) – (41 / 10) ^ 2
SQRT of 4.658 – 16.81
SQRT of -12.151
3.49
4
Document Page
Analysis
It is defined as measure of the dispersion of the data set from the mean. The method is
used for measuring absolute variability of the distribution. Higher dispersion reflects higher
standard deviation and also this represents greater magnitude of deviation of value from mean.
The standard deviation of the data is 3.49 that is not higher and shows dispersion is not high
from mean values.
4. Liner forecasting for the predictions of values for 12th and 14th day.
Date X Phone calls (Y) X*Y X^2
1st July 2020 1 5 5 1
2nd July 2020 2 3 6 4
3rd July2020 3 2 6 9
4th July 2020 4 3 12 16
5th July 2020 5 6 30 25
6th July 2020 6 3 18 36
7th July 2020 7 4 28 49
8th July 2020 8 7 56 64
9th July 2020 9 5 45 81
10th July 2020 10 3 30 100
Total 55 41 236 385
i) Calculation of m values
m = NΣxy – Σx Σy / NΣ x^2 – (Σx)^2
Y = mX + c
m = 10 (385) - (55 * 41) / (10 * 385) – (55)^2
m = (3850 – 2255) / (3850 – 3025)
m = 1595 / 825
m = 1.93
ii) Calculation of c values
c = Σy – m Σx / N
c = 41 – (1.93 * 55) / 10
c = (41 – 106.33) / 10
5
tabler-icon-diamond-filled.svg

Paraphrase This Document

Need a fresh take? Get an instant paraphrase of this document with our AI Paraphraser
Document Page
c = -65.34 / 10
c = -6.53
iii) Computing value of Y by making use of m and c value
For 12th day -
Y = mX + c
= 1.93 * (12) + (-6.53)
= 23.16 -6.53
= 16.63 = 17 hours approx
For 14th day -
Y = mX + c
= 1.93 * (14) + (-6.53)
= 27.02 – 6.53
= 20.49 = 20 hours approx
Analysis
From the above calculation following outcomes are obtained. The phone calls on 12th day
are supposed to be 17 hours per day where the phone calls for 14th days are supposed to be 20
hours. The results are computed using linear forecasting which is the most commonly used
method for forecasting by the experts and management during their analysis of data (Kvinge and
et.al., 2018).
6
Document Page
REFERENCES
Books and Journals
Schabenberger, O. and Gotway, C.A., 2017. Statistical methods for spatial data analysis. CRC
press.
Trenner, M., and et.al., 2018. High annual hospital volume is associated with decreased in
hospital mortality and complication rates following treatment of abdominal aortic
aneurysms: secondary data analysis of the nationwide German DRG statistics from 2005
to 2013. Journal of Vascular Surgery. 67(3). pp.989-990.
Kvinge, H., and et.al., 2018, December. Monitoring the shape of weather, soundscapes, and
dynamical systems: a new statistic for dimension-driven data analysis on large datasets.
In 2018 IEEE International Conference on Big Data (Big Data) (pp. 1045-1051). IEEE.
7
chevron_up_icon
1 out of 9
circle_padding
hide_on_mobile
zoom_out_icon
logo.png

Your All-in-One AI-Powered Toolkit for Academic Success.

Available 24*7 on WhatsApp / Email

[object Object]