Data Analysis and Forecasting: Phone Call Data Analysis

Verified

Added on  2023/01/09

|10
|1407
|43
Homework Assignment
AI Summary
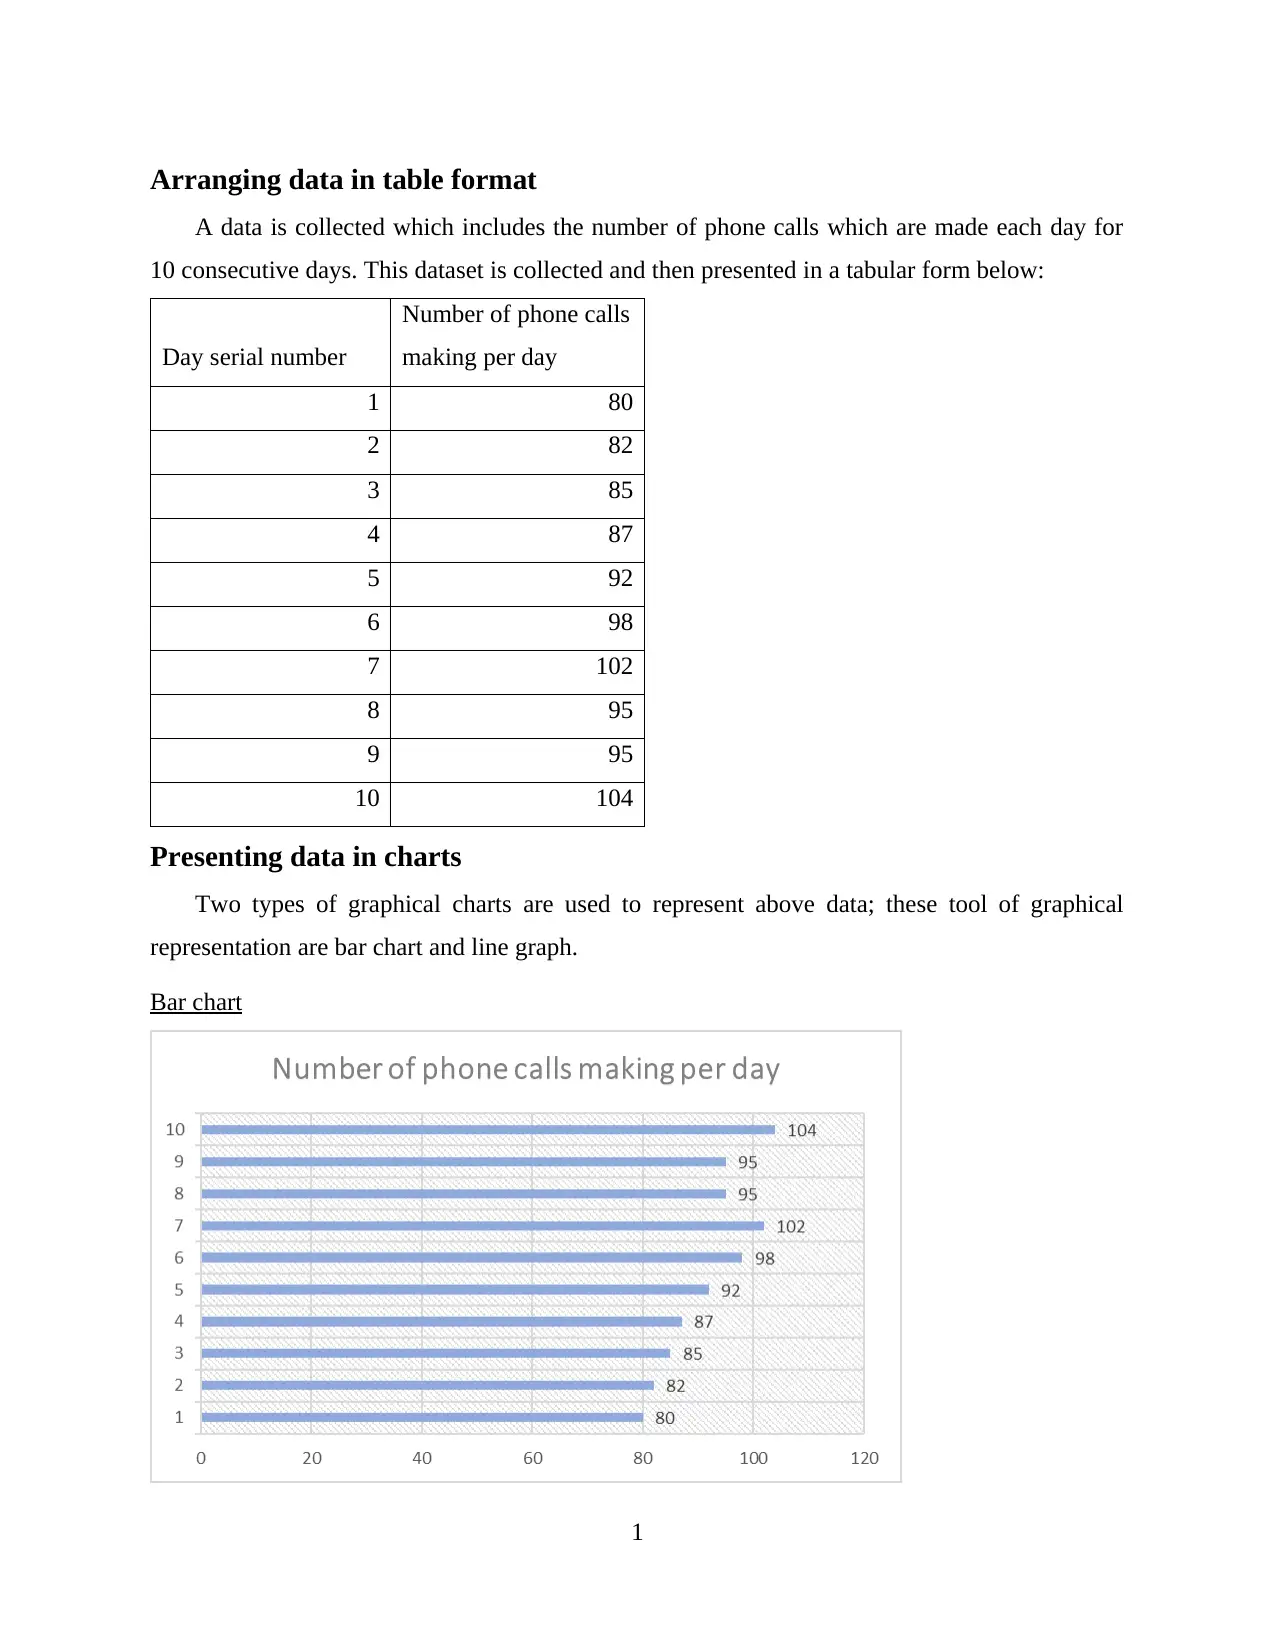
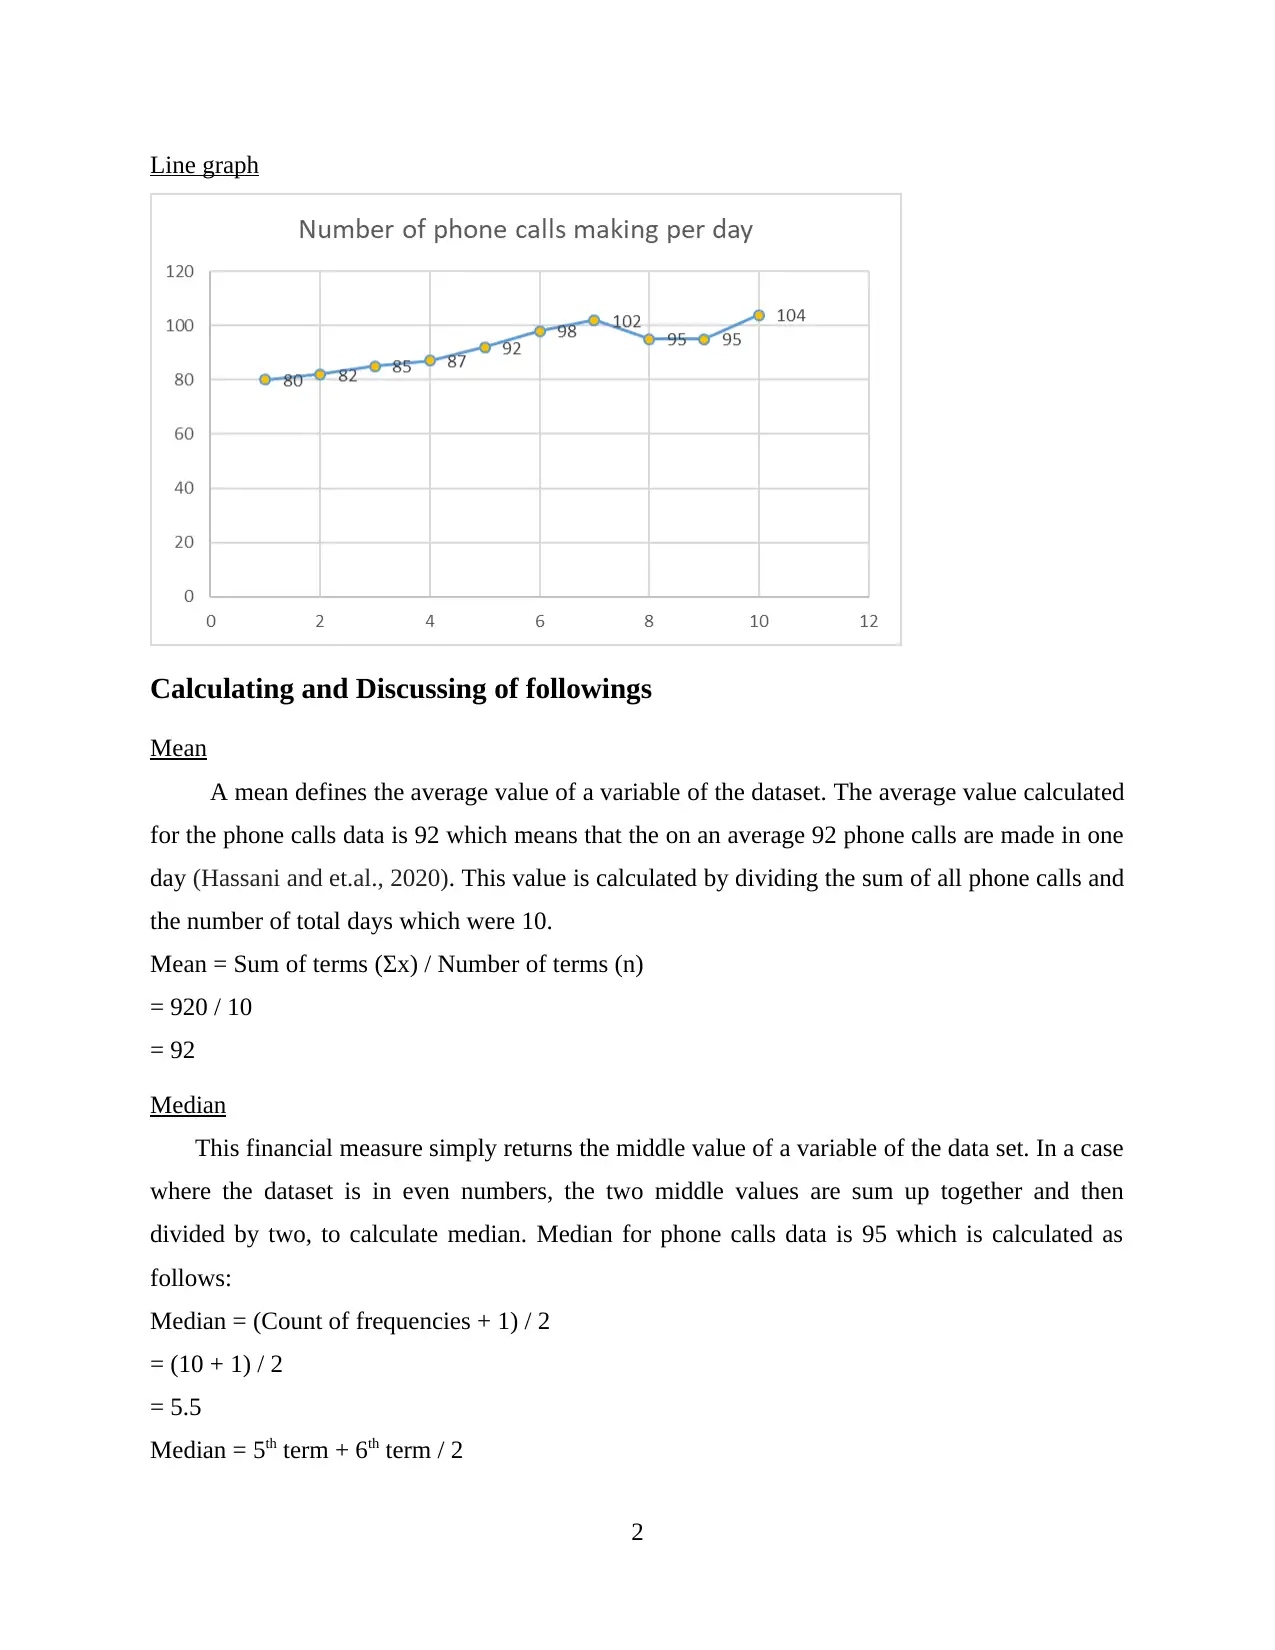
This assignment presents a detailed analysis of phone call data collected over ten consecutive days. The solution begins by organizing the data in a tabular format and visualizing it using bar charts and line graphs. It then proceeds to calculate and discuss various statistical measures, including the mean, median, mode, range, and standard deviation, providing insights into the dataset's characteristics. Furthermore, the assignment delves into linear trend forecasting, calculating the 'm' and 'c' values to predict future phone call numbers. The solution forecasts the number of calls on day 12 and day 14, demonstrating the application of the linear trend forecasting equation. The analysis also acknowledges the potential for variations between predicted and actual values, highlighting the practical aspects of forecasting. References to relevant sources are included at the end.
Document Page
Data Analysis and
Forecasting
tabler-icon-diamond-filled.svg

Paraphrase This Document

Need a fresh take? Get an instant paraphrase of this document with our AI Paraphraser
Document Page
Contents
Arranging data in table format.........................................................................................................1
Presenting data in charts..................................................................................................................1
Bar chart.......................................................................................................................................1
Line graph....................................................................................................................................2
Calculating and Discussing of followings.......................................................................................2
Mean............................................................................................................................................2
Median.........................................................................................................................................2
Mode............................................................................................................................................3
Range...........................................................................................................................................3
Standard Deviation......................................................................................................................3
Calculation of followings................................................................................................................4
Steps of calculation of 'm' value and discussion..........................................................................4
Steps of calculation of 'c' value and discussion...........................................................................5
Forecasting the number of calls making on day 12.....................................................................5
Forecasting the number of calls making on day 14.....................................................................5
REFERENCES................................................................................................................................7
Document Page
Document Page
Arranging data in table format
A data is collected which includes the number of phone calls which are made each day for
10 consecutive days. This dataset is collected and then presented in a tabular form below:
Day serial number
Number of phone calls
making per day
1 80
2 82
3 85
4 87
5 92
6 98
7 102
8 95
9 95
10 104
Presenting data in charts
Two types of graphical charts are used to represent above data; these tool of graphical
representation are bar chart and line graph.
Bar chart
1
tabler-icon-diamond-filled.svg

Paraphrase This Document

Need a fresh take? Get an instant paraphrase of this document with our AI Paraphraser
Document Page
Line graph
Calculating and Discussing of followings
Mean
A mean defines the average value of a variable of the dataset. The average value calculated
for the phone calls data is 92 which means that the on an average 92 phone calls are made in one
day (Hassani and et.al., 2020). This value is calculated by dividing the sum of all phone calls and
the number of total days which were 10.
Mean = Sum of terms (Σx) / Number of terms (n)
= 920 / 10
= 92
Median
This financial measure simply returns the middle value of a variable of the data set. In a case
where the dataset is in even numbers, the two middle values are sum up together and then
divided by two, to calculate median. Median for phone calls data is 95 which is calculated as
follows:
Median = (Count of frequencies + 1) / 2
= (10 + 1) / 2
= 5.5
Median = 5th term + 6th term / 2
2
Document Page
= (92 + 98) / 2
= 190 / 2
= 95
Mode
Mode is a French word which means popular; this origination of this word implies that the
value which is most popular in the dataset is mode (Wagner-Muns and et.al., 2017). By
observing the dataset of phone calls, it has been seen that the most popular value is 95 which is
recurring two times in the dataset. So, mode is 95.
Range
Range is a measure of variability which represents the spread of entire data. In order to
calculate range of a dataset, it is important to first ascertain the maximum and minimum valued
phone calls from the dataset. By subtracting maximum and minimum value, the range is
calculated as 24.
Range = Maximum valued term – Minimum valued term
= 104 – 80
= 24
Standard Deviation
This is also a measure of variance which helps to calculate the difference between the
values of a dataset (Yang and et.al., 2017). For the dataset of phone calls the standard deviation
is calculated by using square root of variance. The calculated standard deviation value of the data
set is 7.84
Standard Deviations = (variance)
Variance 2 = {∑ (x – mean) / N}2
= {∑ (x2 / N – (mean)2}
= {85256 / 10 – (92)2}
= {8525.6 – 8464}
= 61.6
Std. Dev. = 61.6
= 7.84
Working notes:
3
Document Page
x2 = (80)2 + (82)2 + (85)2 + (87)2 + (92)2 + (98)2 + (102)2 + (95)2 + (95)2 + (104)2
x2 = 85256
Calculation of followings
Steps of calculation of 'm' value and discussion
Linear trend forecasting is best suited model of time series data which observes historical
data and then forecast future data points. This technique of making predictions is conducted
using an equation which is y = mx + c (LINEAR TREND FORECASTING, 2018). For forecasting
future values, it is important to first calculate “m” and “c” which are calculated as follows.
Day serial
number (X)
Number of
phone calls
making per
day (Y)
XY X^2
1 80 80 1
2 82 164 4
3 85 255 9
4 87 348 16
5 92 460 25
6 98 588 36
7 102 714 49
8 95 760 64
9 95 855 81
10 104 1040 100
(Total) 55 920 5264 385
Particulars Details
m NΣxy – Σx Σy / NΣ x ^ 2 – (Σx) ^ 2
(10 * 5264) - (55 * 920) / (10 * 385) -
(55) ^ 2
(52640 - 50,600) / (3850 - 3025)
4
tabler-icon-diamond-filled.svg

Paraphrase This Document

Need a fresh take? Get an instant paraphrase of this document with our AI Paraphraser
Document Page
2040 / 825
2.47
The value of m is calculated as 2.47 by using above process. This value is the factor of
change which helps to identify the factor which each data point will be variated while forecasting
future data points. This m value will be used below to calculate phone calls at 12th and 14th day.
Steps of calculation of 'c' value and discussion
Particulars Details
c Σy - m Σx / N
(920 - (2.47 * 55)) / 10
78.415
The above “c” value calculated is the constant value which intercepts the y axis and is
used to predict future values.
Forecasting the number of calls making on day 12
Forecast of 12th day
y = mx + c
y 2.47 (x) + 78.415
x 12
y 2.47 (12) + 78.415
108.05
Forecasting the number of calls making on day 14
Forecast of 14th day
y = mx + c
y 2.47 (x) + 78.415
x 14
y 2.47 (14) + 78.415
112.99
By using both m and c values, the forecasting has been undertaken by using the linear
forecasting equation. By this process, it has been seen that if all external factors are constant then
the phone calls made on 12th day will be 108 and the phone calls made on 14th day will be 113. It
5
Document Page
is clearly seen that the phone calls have increased gradually and by observing the constant rate of
change, these future predictions are made.
It is an important point of discussion that the values which are predicted are not certain or
accurate and there is a high possibility that the real values will be different from the predicted
ones but these values which are forecasted, do provide effective prediction for future values
(Zhang and et.al., 2016).
6
Document Page
REFERENCES
Books and Journals
Hassani, H. and et.al., 2020. The Effect of Data Transformation on Singular Spectrum Analysis
for Forecasting. Signals. 1(1). p.2.
Wagner-Muns, I.M. an et.al., 2017. A functional data analysis approach to traffic volume
forecasting. IEEE Transactions on Intelligent Transportation Systems. 19(3). pp.878-888.
Yang, J. and et.al., 2017. k-Shape clustering algorithm for building energy usage patterns
analysis and forecasting model accuracy improvement. Energy and Buildings. 146.
pp.27-37.
Zhang, Y. and et.al., 2016. Topic analysis and forecasting for science, technology and
innovation: Methodology with a case study focusing on big data research. Technological
Forecasting and Social Change. 105. pp.179-191.
Online
LINEAR TREND FORECASTING. 2018. [Online]. Available through:
<https://www.kbmanage.com/concept/linear-trend-forecasting>
7
chevron_up_icon
1 out of 10
circle_padding
hide_on_mobile
zoom_out_icon
[object Object]