Data Analysis and Forecasting Report on Phone Call Data

Verified

Added on  2023/01/07

|12
|1296
|56
Report
AI Summary
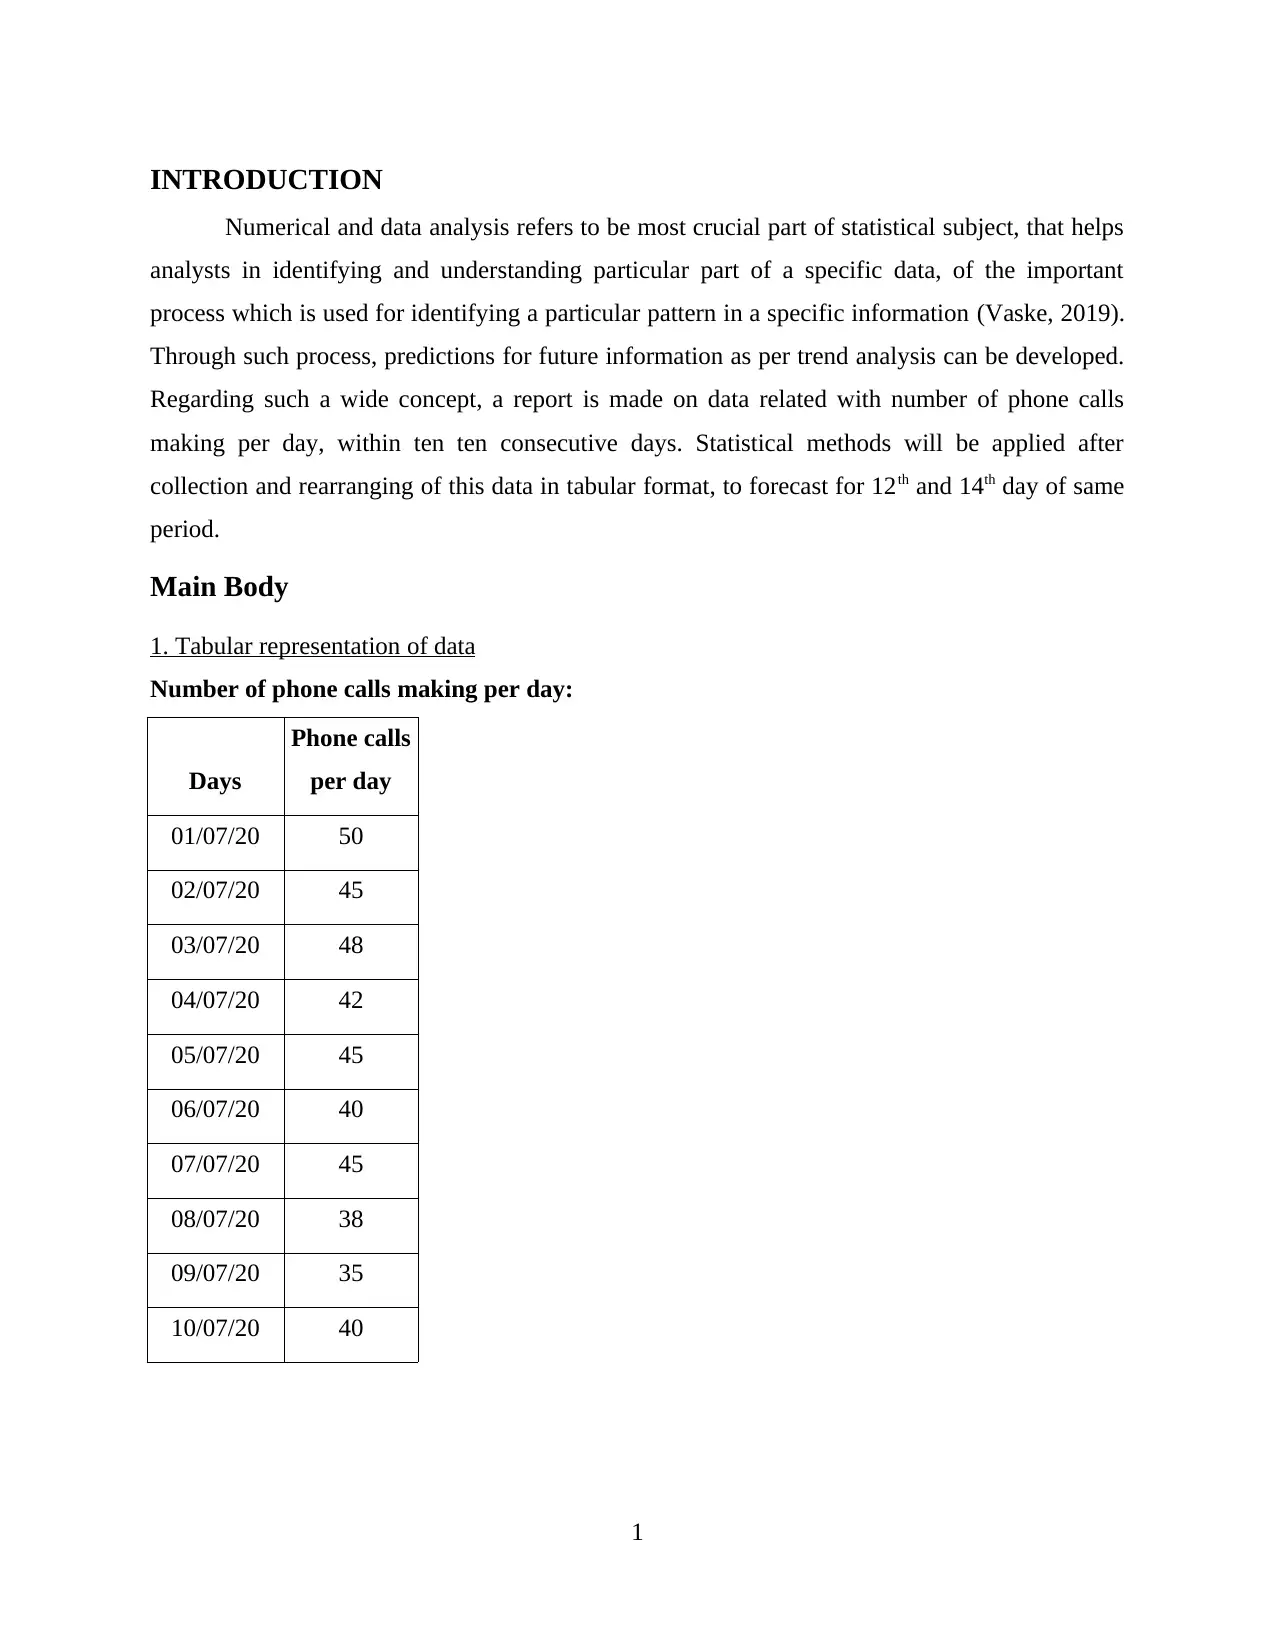
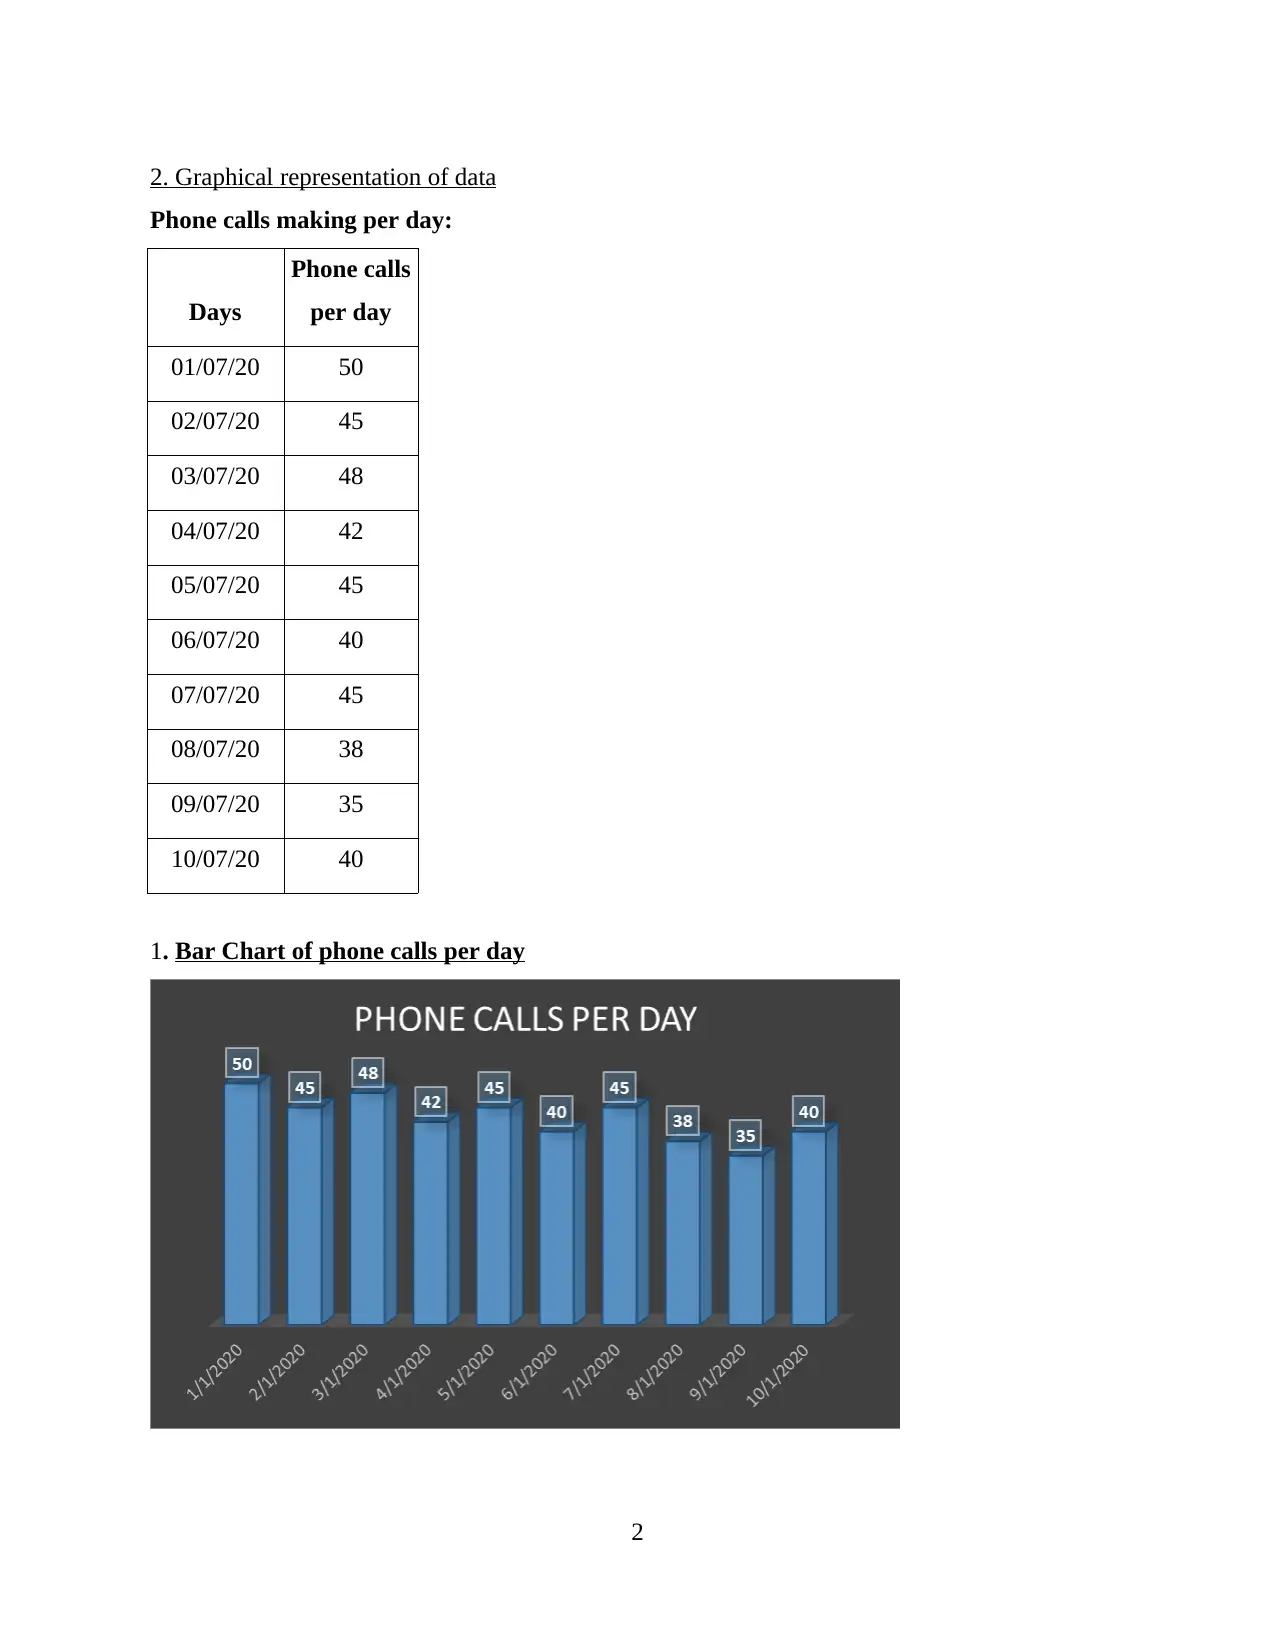
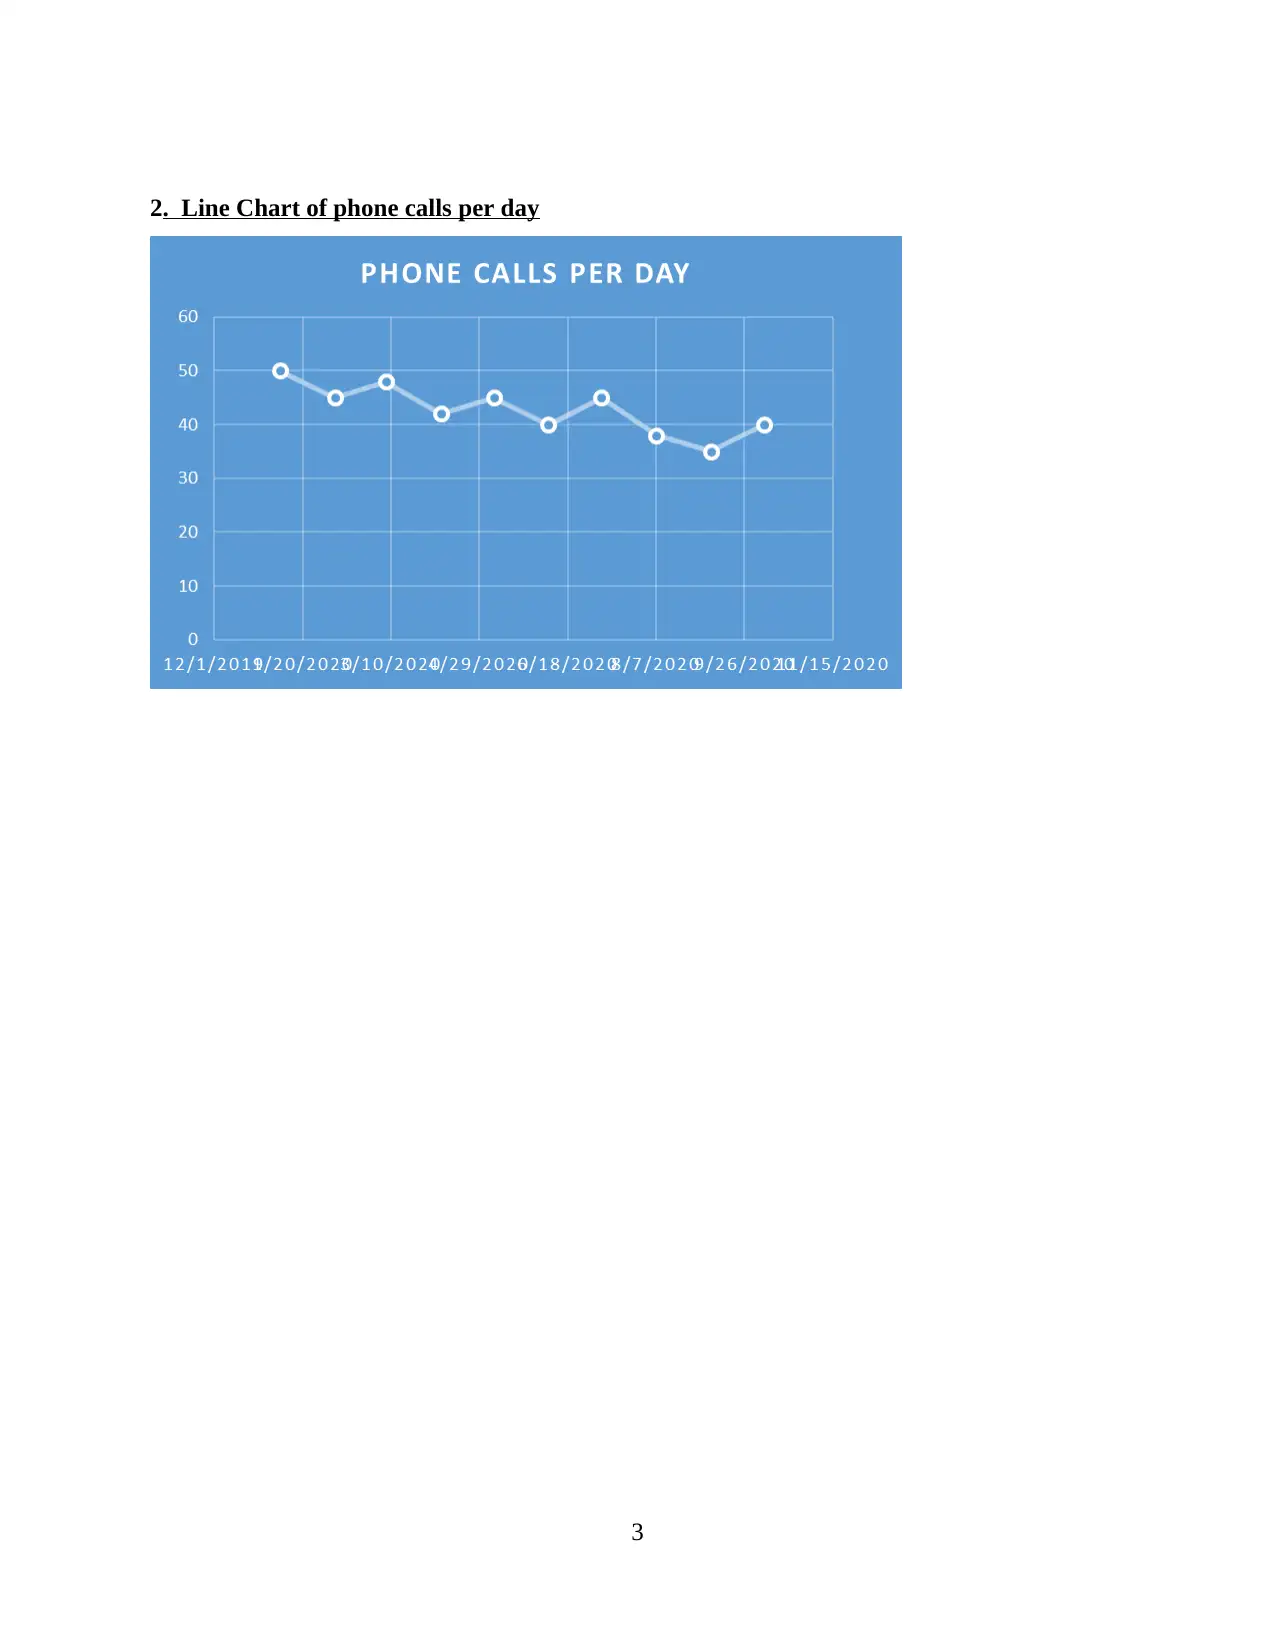
This report presents a comprehensive data analysis and forecasting study based on phone call data collected over ten consecutive days. The analysis begins with a tabular and graphical representation of the data, followed by the calculation of key statistical measures including mean, median, mode, range, and standard deviation to identify data patterns. The report then applies a linear forecasting model to predict the number of phone calls for the 12th and 14th days, providing a practical application of statistical techniques for future predictions. The methodology includes detailed calculations and discussions, offering insights into data variability and trend analysis. The report concludes with a linear forecasting model, demonstrating how to predict future outcomes based on past data. This report showcases the effective use of statistical methods in data analysis and forecasting.
Document Page
Data Analysis and
Forecasting
tabler-icon-diamond-filled.svg

Paraphrase This Document

Need a fresh take? Get an instant paraphrase of this document with our AI Paraphraser
Document Page
Table of Contents
INTRODUCTION...........................................................................................................................1
Main Body.......................................................................................................................................1
1. Tabular representation of data............................................................................................1
2. Graphical representation of data.........................................................................................2
3. Calculation and discussion of data pattern.........................................................................4
4. Liner-forecasting model.....................................................................................................8
REFERENCES..............................................................................................................................10
Document Page
INTRODUCTION
Numerical and data analysis refers to be most crucial part of statistical subject, that helps
analysts in identifying and understanding particular part of a specific data, of the important
process which is used for identifying a particular pattern in a specific information (Vaske, 2019).
Through such process, predictions for future information as per trend analysis can be developed.
Regarding such a wide concept, a report is made on data related with number of phone calls
making per day, within ten ten consecutive days. Statistical methods will be applied after
collection and rearranging of this data in tabular format, to forecast for 12th and 14th day of same
period.
Main Body
1. Tabular representation of data
Number of phone calls making per day:
Days
Phone calls
per day
01/07/20 50
02/07/20 45
03/07/20 48
04/07/20 42
05/07/20 45
06/07/20 40
07/07/20 45
08/07/20 38
09/07/20 35
10/07/20 40
1
Document Page
2. Graphical representation of data
Phone calls making per day:
Days
Phone calls
per day
01/07/20 50
02/07/20 45
03/07/20 48
04/07/20 42
05/07/20 45
06/07/20 40
07/07/20 45
08/07/20 38
09/07/20 35
10/07/20 40
1. Bar Chart of phone calls per day
2
tabler-icon-diamond-filled.svg

Paraphrase This Document

Need a fresh take? Get an instant paraphrase of this document with our AI Paraphraser
Document Page
2. Line Chart of phone calls per day
3
Document Page
3. Calculation and discussion of data pattern
For analysing trends of a particular data and interpret it correctly, so that future prediction can be
made, a number of statistical tools can be used. It includes media, mode, range, average or mean
etc. While working with a numerical data set, these techniques can be useful for representing the
entire information with a single value, which describes the "average" or "middle" value of same
observations set (Chamboko and Bravo, 2019). This single value in statistics, is known as central
tendency, where mean, median and mode etc. are some of the most common ways to describe
it. In context with present report, where data is taken about number of calls making per day, to
identify its definite pattern and forecast for upcoming days, following methods have been used -
Mean: It indicates average of a particular data, by summing up entire observations and
divide this total from number of observations. This value helps in analysing the trends and
depicts its variability as increase or decrease with time, by using following formula –
Mean = sum of total numbers
total number of numbers
or,
μ = Σx
n
Median: Statistically, median shows the middle value in a sequence of observations by
arranging each number as per order by size or in ascending terms (Silverman, 2018).
Numerically, mid value of any data can be calculated by using below mentioned formula –
If total no.in data set is odd,
Position value of Median (M) = (No. of total numbers + 1)
2
If total no.in data set is even,
M = No. of observation
2
Mode: It refers to a value that occurs most often or frequently within a set of number,
which helps in identifying the most common occurrence of the same.
Range: It reflects the variations among set of data, by calculating the difference lie
between highest to lower observation. Numerically, it can be found in following way -
Range = Maximum observation – Minimum Observation
4
Document Page
Standard Deviations: This statistical value helps in identifying how much quantity of a
data set varies from its mean value, by using below formula –
Standard Deviation = (variance)
Variance2 = {∑ (x – mean) / N} 2
Calculation:
Days
Phone calls
per day
01/07/20 50
02/07/20 45
03/07/20 48
04/07/20 42
05/07/20 45
06/07/20 40
07/07/20 45
08/07/20 38
09/07/20 35
10/07/20 40
Total 428
Mean 42.8
Median 43.5
Mode 45
Range 15
Std. dev 4.638
5
tabler-icon-diamond-filled.svg

Paraphrase This Document

Need a fresh take? Get an instant paraphrase of this document with our AI Paraphraser
Document Page
μ = Σx
n
= 428
10
= 42.8 calls
Median = 10 / 2
= 5th Observation
Now, value of 5th observation in given data set can be calculated by arranging in ascending order
- 35, 38, 40, 40, 45, 45, 45, 42, 48, 50
So, Median (M) = 45
Mode = 45 (frequently occurs three times)
Range = Max – Min
= 50 – 35
= 15 calls
Table – Calculation for standard deviation
Days
Phone
calls
per day
(x-mean) (x-
mean)2
1/7/2020 50 7.2 51.84
2/7/2020 45 2.2 4.84
3/7/2020 48 5.2 27.04
4/7/2020 42 -0.8 0.64
5/7/2020 45 2.2 4.84
6/7/2020 40 -2.8 7.84
7/7/2020 45 2.2 4.84
8/7/2020 38 -4.8 23.04
9/7/2020 35 -7.8 60.84
10/7/2020 40 -2.8 7.84
Mean
= 42.8 193.6
Variance = [ ∑(x – mean) 2 / N ]
6
Document Page
= 193.6 / 10 = 19.36
Std Dev. = variance
= 19.36 = 4.4 approx.
7
Document Page
4. Liner-forecasting model
To predicting the phone calls will make in upcoming days as per given value of data set,
linear forecasting model has been used in following manner –
y = mx + c
where, given linear equation indicates slope of a line as m and c as a constant -
m = Change in Y
Change in X
Days
Phone
calls per
day (Y) X2
XY
1 50 1 50
2 45 4 90
3 48 9 144
4 42 16 168
5 45 25 225
6 40 36 240
7 45 49 315
8 38 64 304
9 35 81 315
10 40 100 400
ΣX = 55 ΣY = 428 ΣX2 = 385 ∑XY = 2251
1. m can be calculated by using given numerical formula-
m = N * ∑XY - ∑X * ∑Y
N * ∑X2 - (∑X)2
= 10 * 2251 – 55 * 428
10 * 385 – (55)2
= (22510 – 23540) / (3850 – 3025)
= -1030/ 825 = -1.24 approx.
Taking value of m, to calculate constant value of c as -
8
tabler-icon-diamond-filled.svg

Paraphrase This Document

Need a fresh take? Get an instant paraphrase of this document with our AI Paraphraser
Document Page
c = (∑Y – m ∑x) / N
= [428 – (-1.24) * 55] / 10
= 49.62 approx.
Then, predictions for 12th and 14th day to make phone calls of same period of ten consecutive
days, can be calculated as –
For 12th day -
Y = m x + c
= (-1.24) * 12 + 49.62
= 64.5 = 65 calls approx.
While for 14th day, it is
Y = m x + c
= (-1.24) * 14 + 49.62
= 66.98 = 67 calls approx.
9
Document Page
REFERENCES
Books and Journals
Chamboko, R. and Bravo, J. M., 2019. Modelling and forecasting recurrent recovery events on
consumer loans. International Journal of Applied Decision Sciences. 12(3). pp.271-287.
Silverman, B. W., 2018. Density estimation for statistics and data analysis. Routledge.
Vaske, J. J., 2019. Survey research and analysis. Sagamore-Venture. 1807 North Federal Drive,
Urbana, IL 61801.
10
chevron_up_icon
1 out of 12
circle_padding
hide_on_mobile
zoom_out_icon
[object Object]