Data Analysis and Forecasting: Wind Speed Report and Calculations

Verified

Added on  2023/01/19

|9
|1367
|49
Report
AI Summary
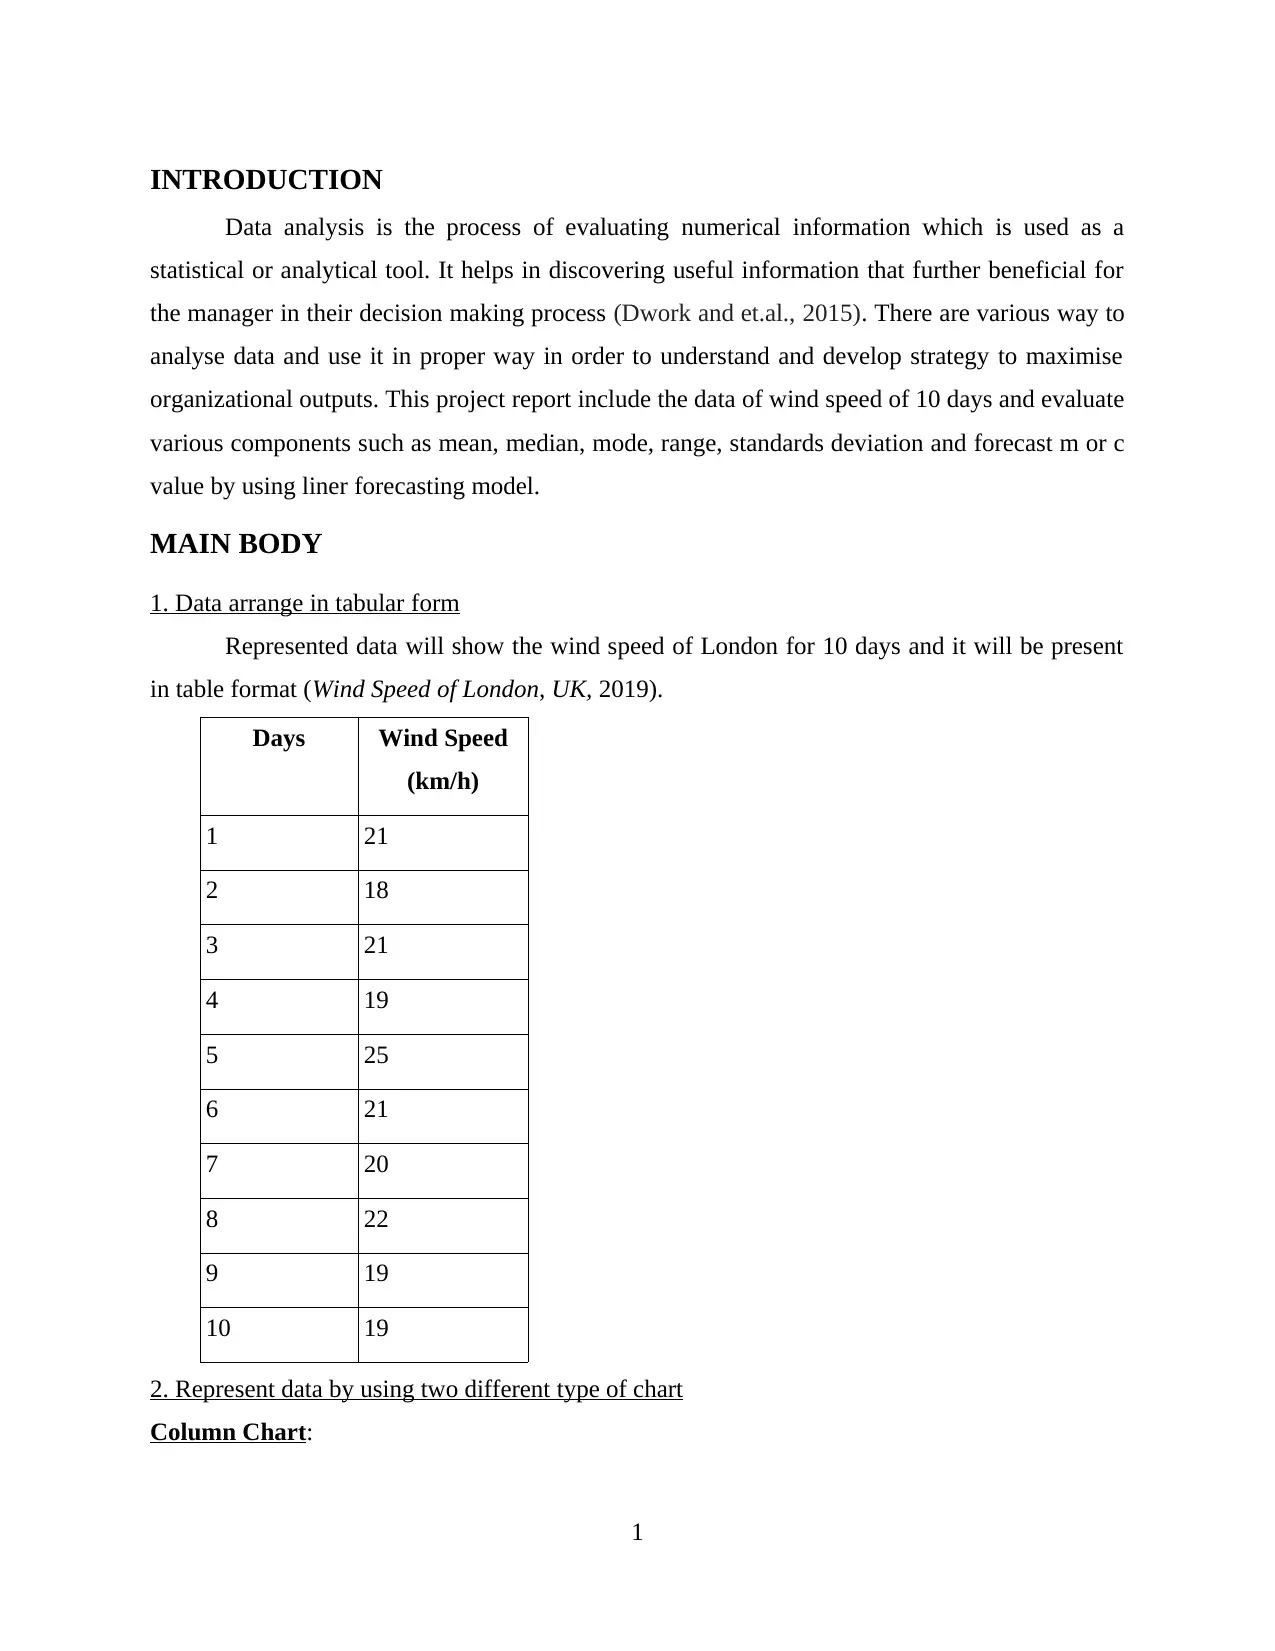
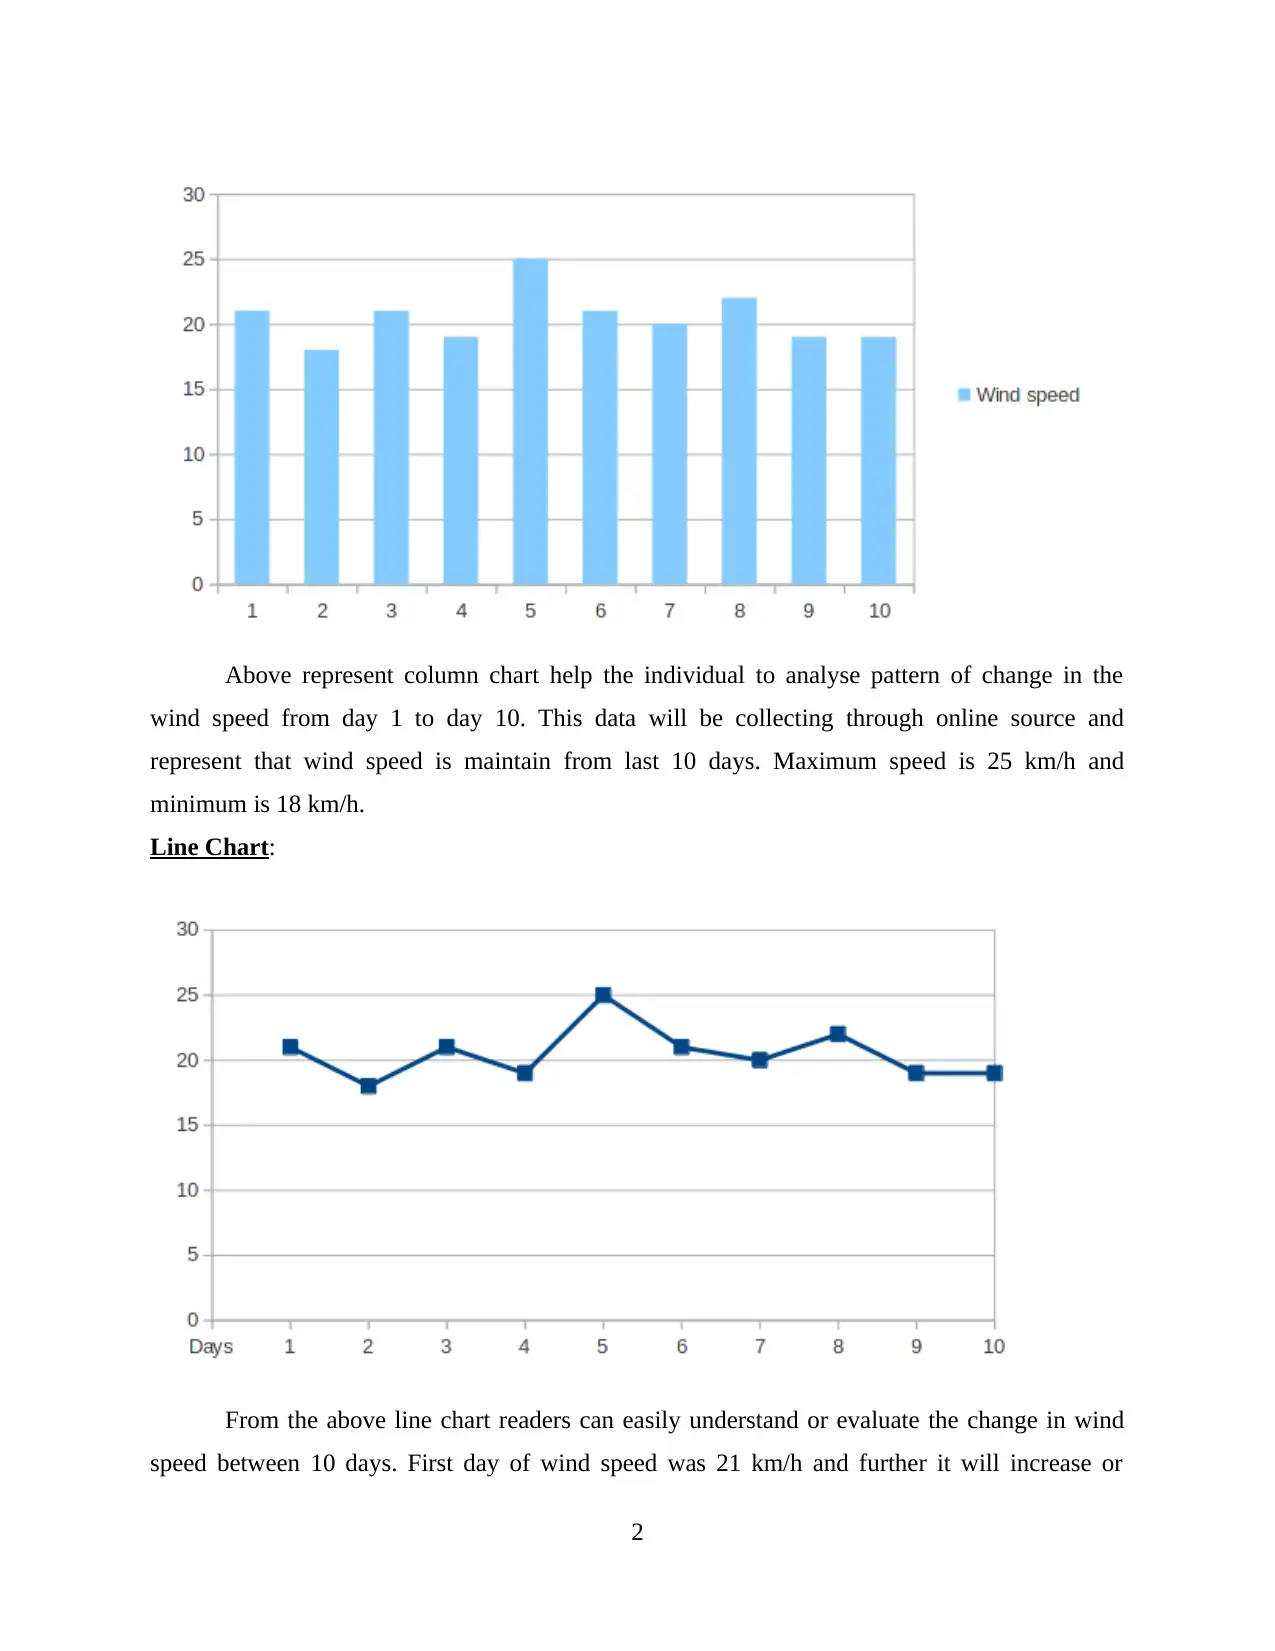
This report analyzes wind speed data collected over ten days, employing various statistical methods and data visualization techniques. The analysis includes arranging data in tabular form and representing it using column and line charts for visual interpretation of wind speed patterns. Key statistical measures such as mean, median, mode, range, and standard deviation are calculated to understand the central tendencies and variability within the dataset. Furthermore, the report utilizes a linear forecasting model to predict wind speeds on future days, specifically the 14th and 21st days, evaluating the 'm' and 'c' values to build the forecasting equation. The findings provide insights into the wind speed fluctuations and predictive capabilities based on the data, concluding with a summary of the analysis and its implications for understanding and forecasting environmental data.
tabler-icon-diamond-filled.svg

Contribute Materials

Your contribution can guide someone’s learning journey. Share your documents today.
Document Page
Numeracy and Data
Analysis
tabler-icon-diamond-filled.svg

Secure Best Marks with AI Grader

Need help grading? Try our AI Grader for instant feedback on your assignments.
Document Page
Table of Contents
INTRODUCTION...........................................................................................................................1
MAIN BODY...................................................................................................................................1
1. Data arrange in tabular form....................................................................................................1
2. Represent data by using two different type of chart................................................................1
3. Calculate following values.......................................................................................................3
4. Use liner forecasting model and evaluate m or c value...........................................................5
CONCLUSION................................................................................................................................6
REFERENCES................................................................................................................................7
Document Page
INTRODUCTION
Data analysis is the process of evaluating numerical information which is used as a
statistical or analytical tool. It helps in discovering useful information that further beneficial for
the manager in their decision making process (Dwork and et.al., 2015). There are various way to
analyse data and use it in proper way in order to understand and develop strategy to maximise
organizational outputs. This project report include the data of wind speed of 10 days and evaluate
various components such as mean, median, mode, range, standards deviation and forecast m or c
value by using liner forecasting model.
MAIN BODY
1. Data arrange in tabular form
Represented data will show the wind speed of London for 10 days and it will be present
in table format (Wind Speed of London, UK, 2019).
Days Wind Speed
(km/h)
1 21
2 18
3 21
4 19
5 25
6 21
7 20
8 22
9 19
10 19
2. Represent data by using two different type of chart
Column Chart:
1
Document Page
Above represent column chart help the individual to analyse pattern of change in the
wind speed from day 1 to day 10. This data will be collecting through online source and
represent that wind speed is maintain from last 10 days. Maximum speed is 25 km/h and
minimum is 18 km/h.
Line Chart:
From the above line chart readers can easily understand or evaluate the change in wind
speed between 10 days. First day of wind speed was 21 km/h and further it will increase or
2
tabler-icon-diamond-filled.svg

Secure Best Marks with AI Grader

Need help grading? Try our AI Grader for instant feedback on your assignments.
Document Page
decrease. But, on 10th day speed of wind was 19 km/h and there are not enough different from
day 1 to day 10.
3. Calculate following values
Days Wind speed
1 21
2 18
3 21
4 19
5 25
6 21
7 20
8 22
9 19
10 19
Mean 20.500
Mode 2
Median 20
Range 7
Maximum 25
Minimum 18
Standard
deviation 2
Mean: It is the average value of total observation and in order to calculate mean value,
firstly they have to added and then the it will be divided by total number of observation (Joustra
and et.al., 2015). For example: total values is 2000 and number of observations is 10 then mean
value will be 200. it is also known as central value and steps of calculating mean is mention
below:
Formula of mean:
= ∑X / N
3
Document Page
= 205 / 10
= 20.5
Median: It is the middle value of all the observation where value will be separated
between two parts. First one is upper and another is lower one and it will be analyse on the basis
of even or odd value of observation. Below mention following steps helps in calculating median
value of the given observation:
Formula of median:
= ( N +1 ) / 2 when data series is odd and when series is even then formula will be N / 2
= 10+1 / 2
= 5.5 observation
= 20 + 20 / 2
= 20
Mode: It is the value which repeat often time in a set of data and it is called mode. If in
the given observation, no number will be repeat then it called no mode in the range of data
(Shoro and Soomro, 2015). It will be calculated by using various steps and from the above table
mode is 19 or 21 because these two values will often use.
Range: It is the value which calculated through subtracting minimum value from the
maximum value. Steps to calculate mention below:
Formula of range:
= Max – Min
= 25 – 18
= 7
Standard deviation:
It is is a measurement tool which used to quantify the variety in the set of information
(Khani and Boyles, 2015). It is a square root of variance and all the relevant steps are followed
to calculate which mentioned below in the table format:
Days
Station
usage (x) x- mean (x-m)2
1 21 0.500 0.250
2 18 -2.500 6.250
3 21 0.500 0.250
4
Document Page
4 19 -1.500 2.250
5 25 4.500 20.250
6 21 0.500 0.250
7 20 -0.500 0.250
8 22 1.500 2.250
9 19 -1.500 2.250
10 19 -1.500 2.250
Total 37
Variance 4
Stdev 2
Formula of standard deviation: √ (variance)
Variance = {∑(x – mean) 2 / N}
= 37 / 10
= 3.7
So variance is = 3.7
Standard deviation is √ 3.7
Standard deviation = 1.923 or 2
4. Use liner forecasting model and evaluate m or c value
Evaluate the value of M or C as well as forecast the wind speed of 14th or 21st day.
(a). Table
Day (x)
Wind speed
(y) X2 xy
1 21 1 21
2 18 4 36
3 21 9 63
4 19 16 76
5 25 25 125
6 21 36 126
7 20 49 140
8 22 64 176
5
tabler-icon-diamond-filled.svg

Paraphrase This Document

Need a fresh take? Get an instant paraphrase of this document with our AI Paraphraser
Document Page
9 19 81 171
10 19 100 190
∑x= 55 ∑y= 205 X2=385 ∑xy=1124
This model helps in determining the value of m in y = mx + c by taking the following steps:-
(b). Value of M:
M = N ∑xy- ∑x∑y / N∑ X2 - (∑x)2
= 10 * 1124 – (55*205)/ 10*385- (55)2
= -35/ 825
= -0.04
(c). Value of C:
C = ( ∑y- m ∑x )/ N
= [205 - (-0.04) * 55 ] /10
= 207.2 / 10
= 20.7
(d). Wind speed of Day 14:
Y= mx+c
Y= -0.04 * 14 + (20.7)
= 20.14 So the wind speed of 14th day will be 20.14 km/h.
(e). Wind speed of Day 21:
Y= mx+c
Y= -0.04 * 21 + (20.7)
= 19.86, in 21st day speed of wind will be 19.86.
CONCLUSION
From the above discussion it has been evaluated that data analysis used to gather
information and evaluate in effective manner which provide useful outcomes. Purpose of this
analysis is to evaluate different value such as mean, median, mode, range, standard deviation etc.
These information helps in providing competitive analysis and further helps the researcher or
readers to analyse and develop their decision accordingly.
6
Document Page
REFERENCES
Books & Journals
Dwork, C. and et.al., 2015. Generalization in adaptive data analysis and holdout reuse.
In Advances in Neural Information Processing Systems (pp. 2350-2358).
Joustra, S. D. and et.al., 2015. New reference charts for testicular volume in Dutch children and
adolescents allow the calculation of standard deviation scores. Acta Paediatrica. 104(6).
pp.e271-e278.
Khani, A. and Boyles, S. D., 2015. An exact algorithm for the mean–standard deviation shortest
path problem. Transportation Research Part B: Methodological. 81. pp.252-266.
Shoro, A. G. and Soomro, T. R., 2015. Big data analysis: Apache spark perspective. Global
Journal of Computer Science and Technology.
Online
Wind Speed of London, UK. 2019. [Online]. Available Through:
<https://weather.com/en-IN/weather/tenday/l/b6dc7788d6e002abf5e28f10976ec42e171
9b1c5ebb96e9f3d1268be30303574>
7
chevron_up_icon
1 out of 9
circle_padding
hide_on_mobile
zoom_out_icon
logo.png

Your All-in-One AI-Powered Toolkit for Academic Success.

Available 24*7 on WhatsApp / Email

[object Object]