Data Analysis and Forecasting Report: Wind Speed Data and Forecasting
VerifiedAdded on 2023/06/10
|11
|1407
|319
Report
AI Summary
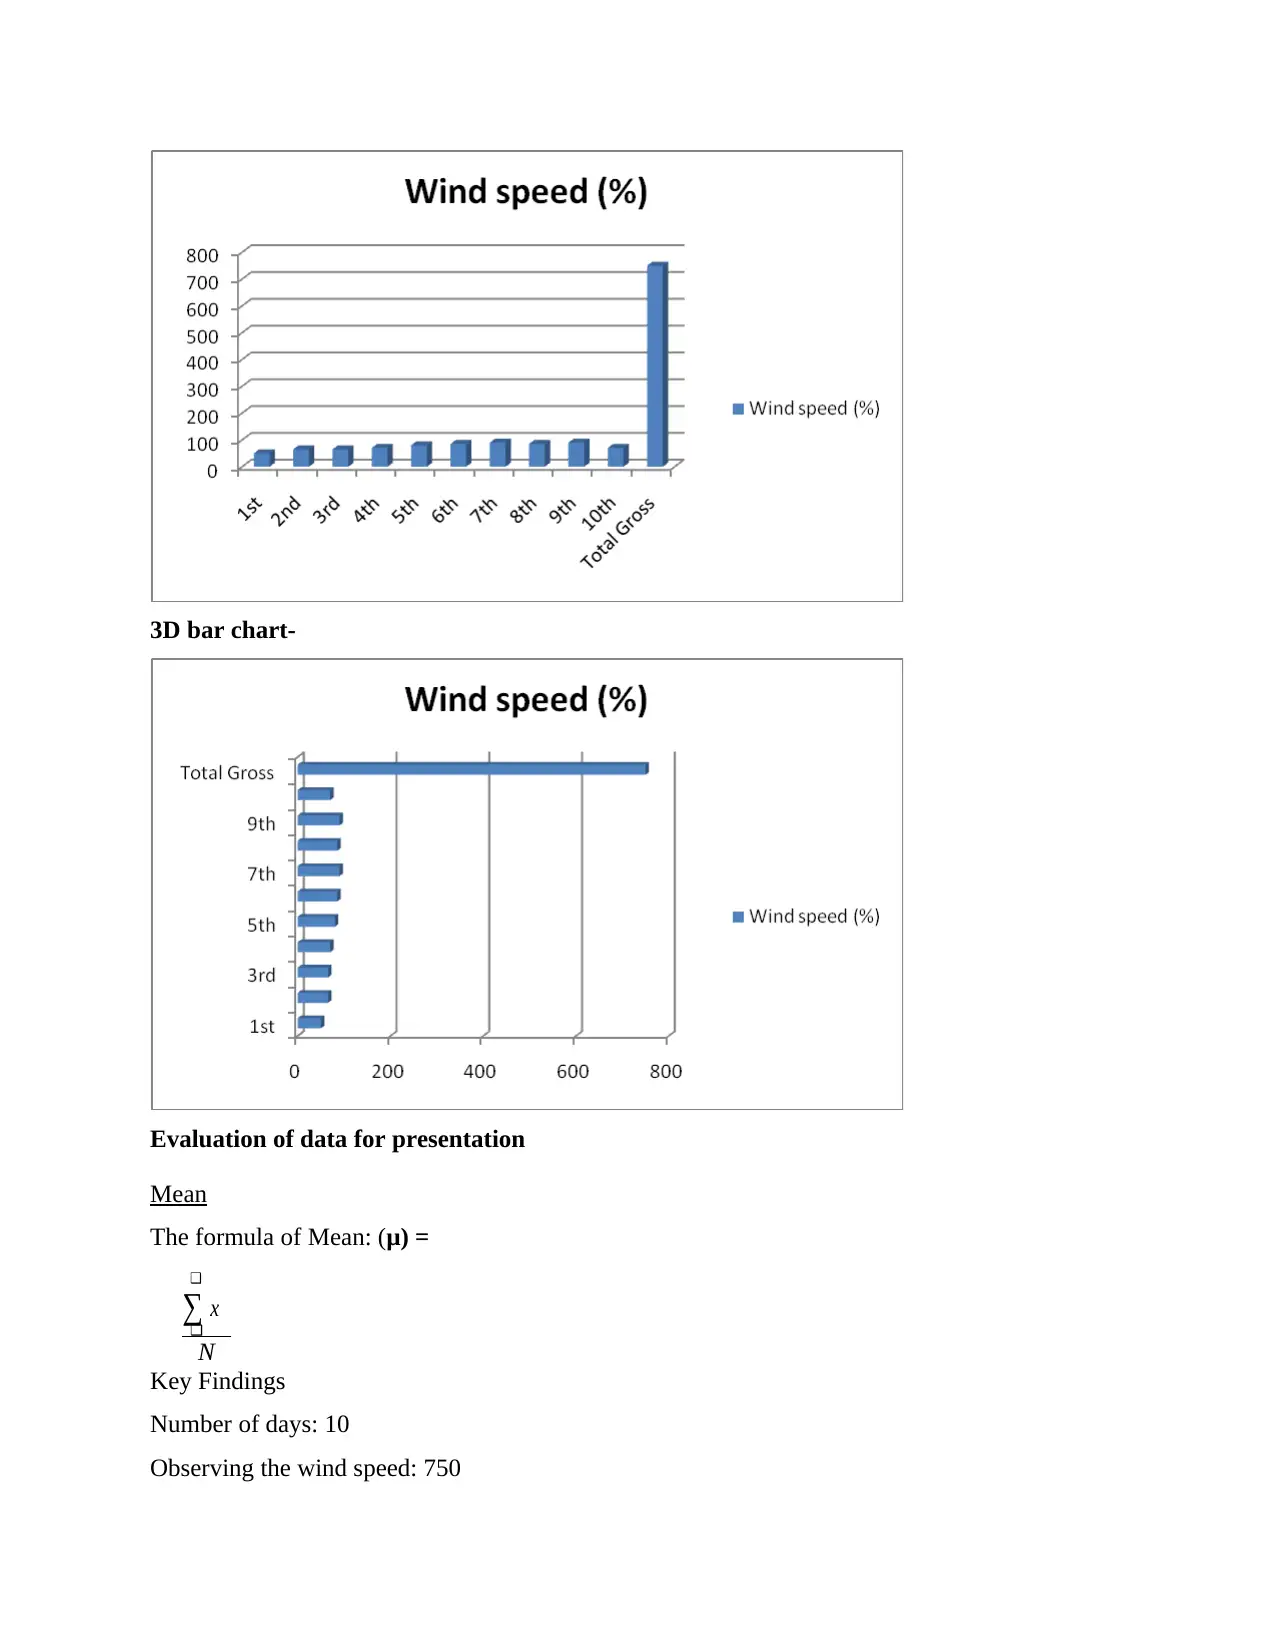
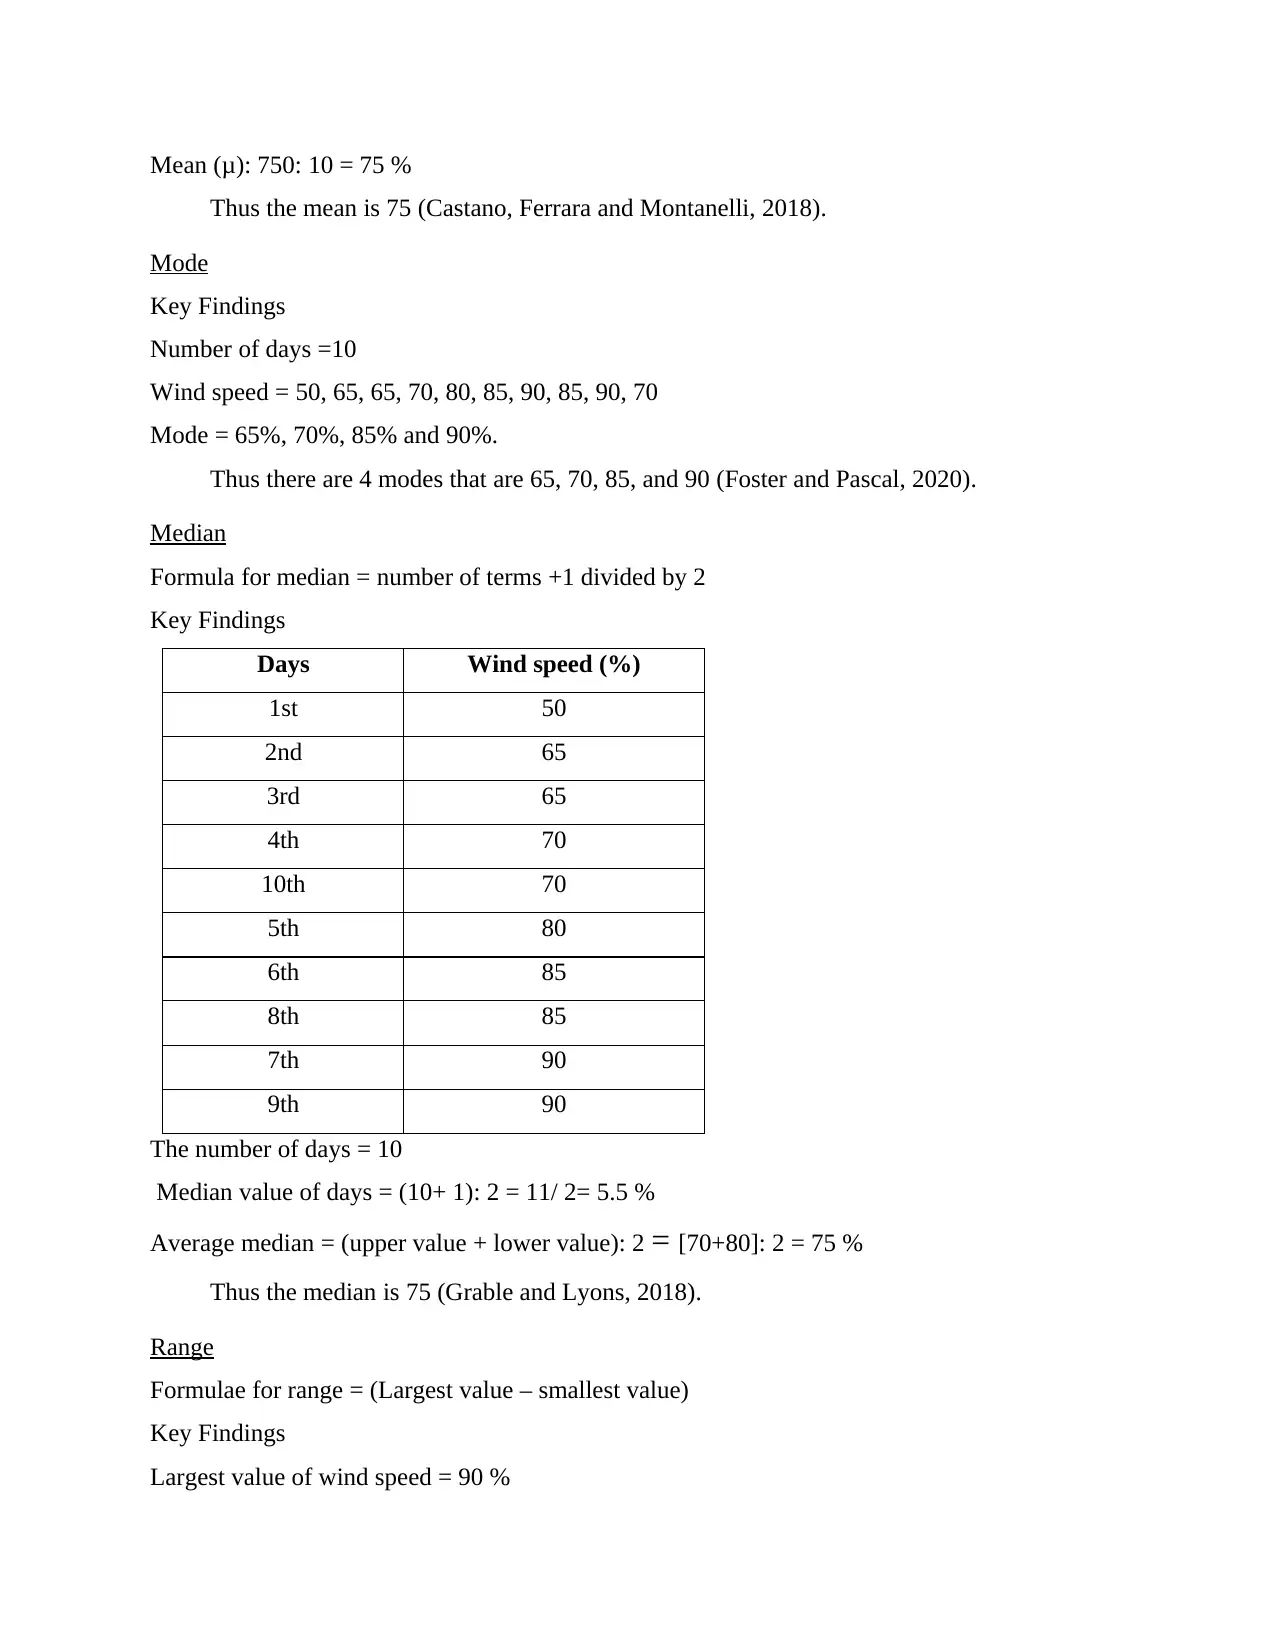
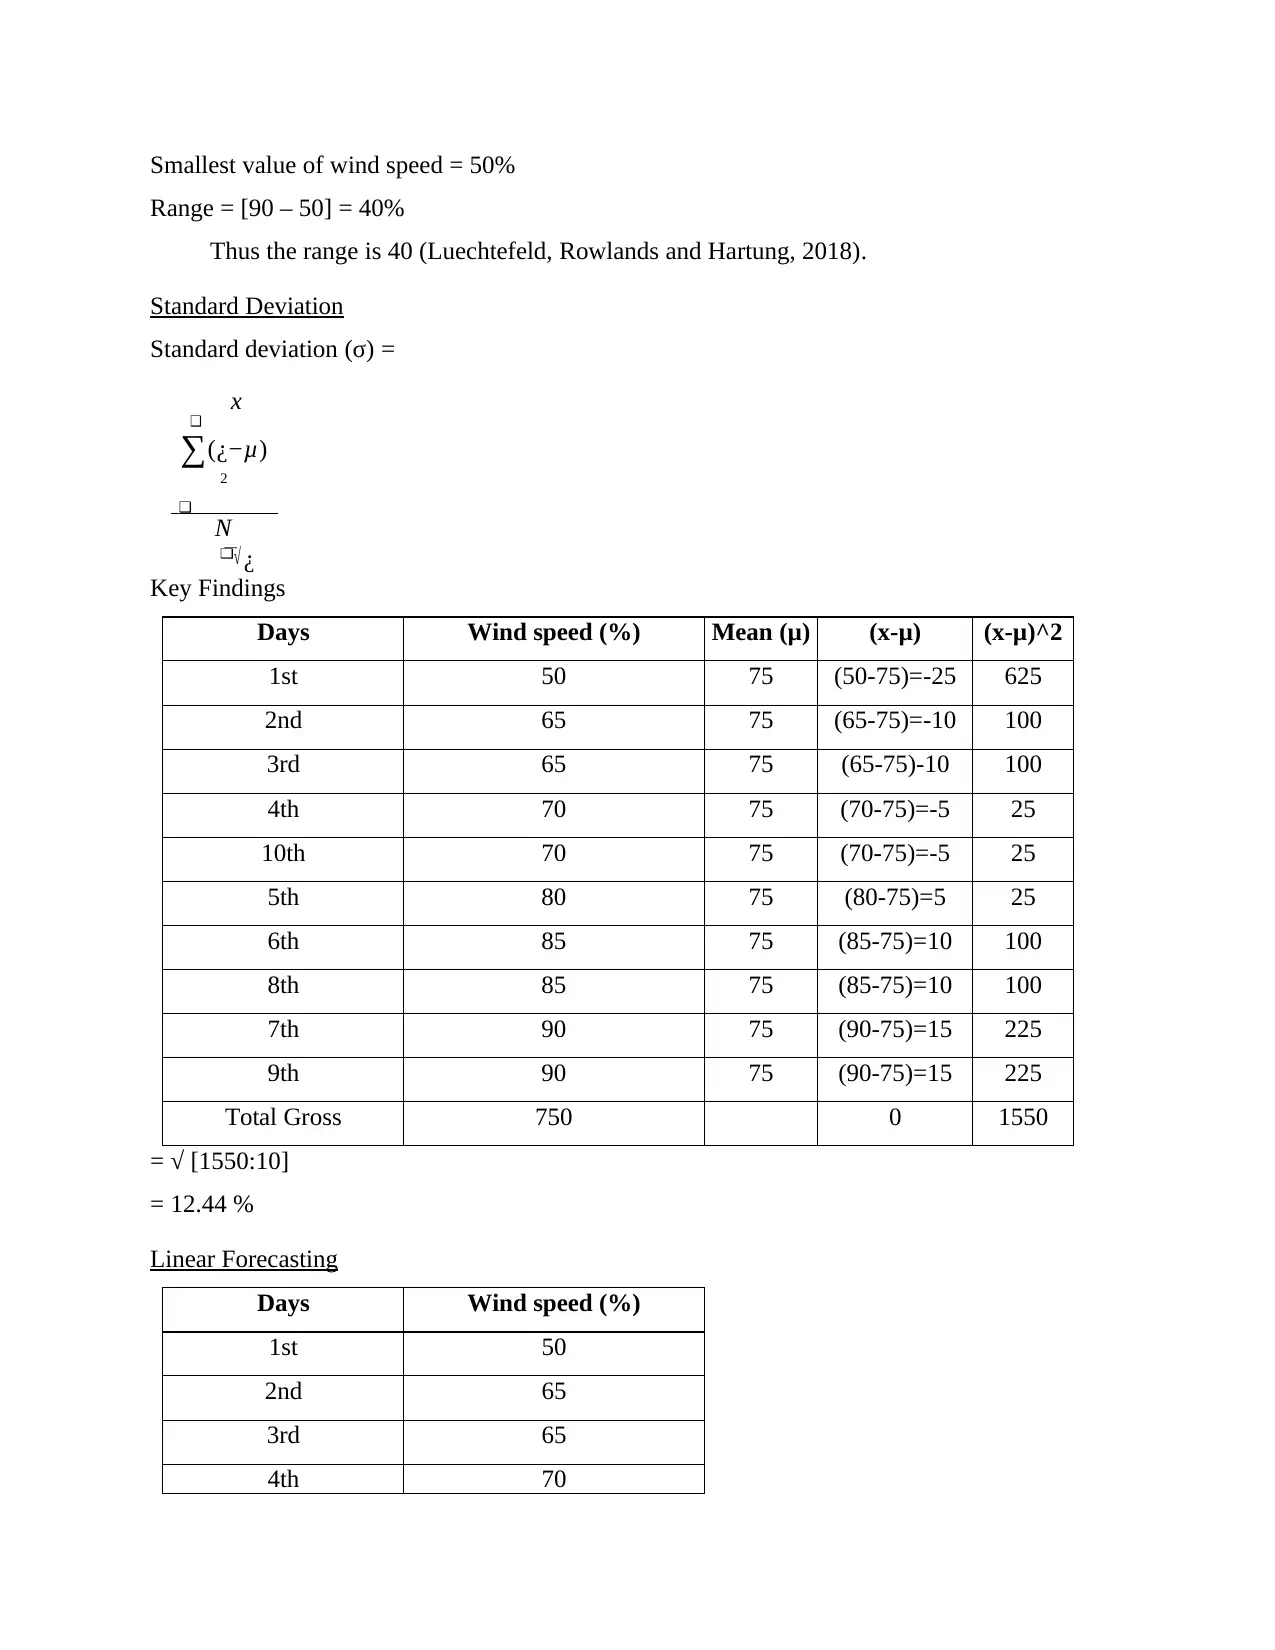
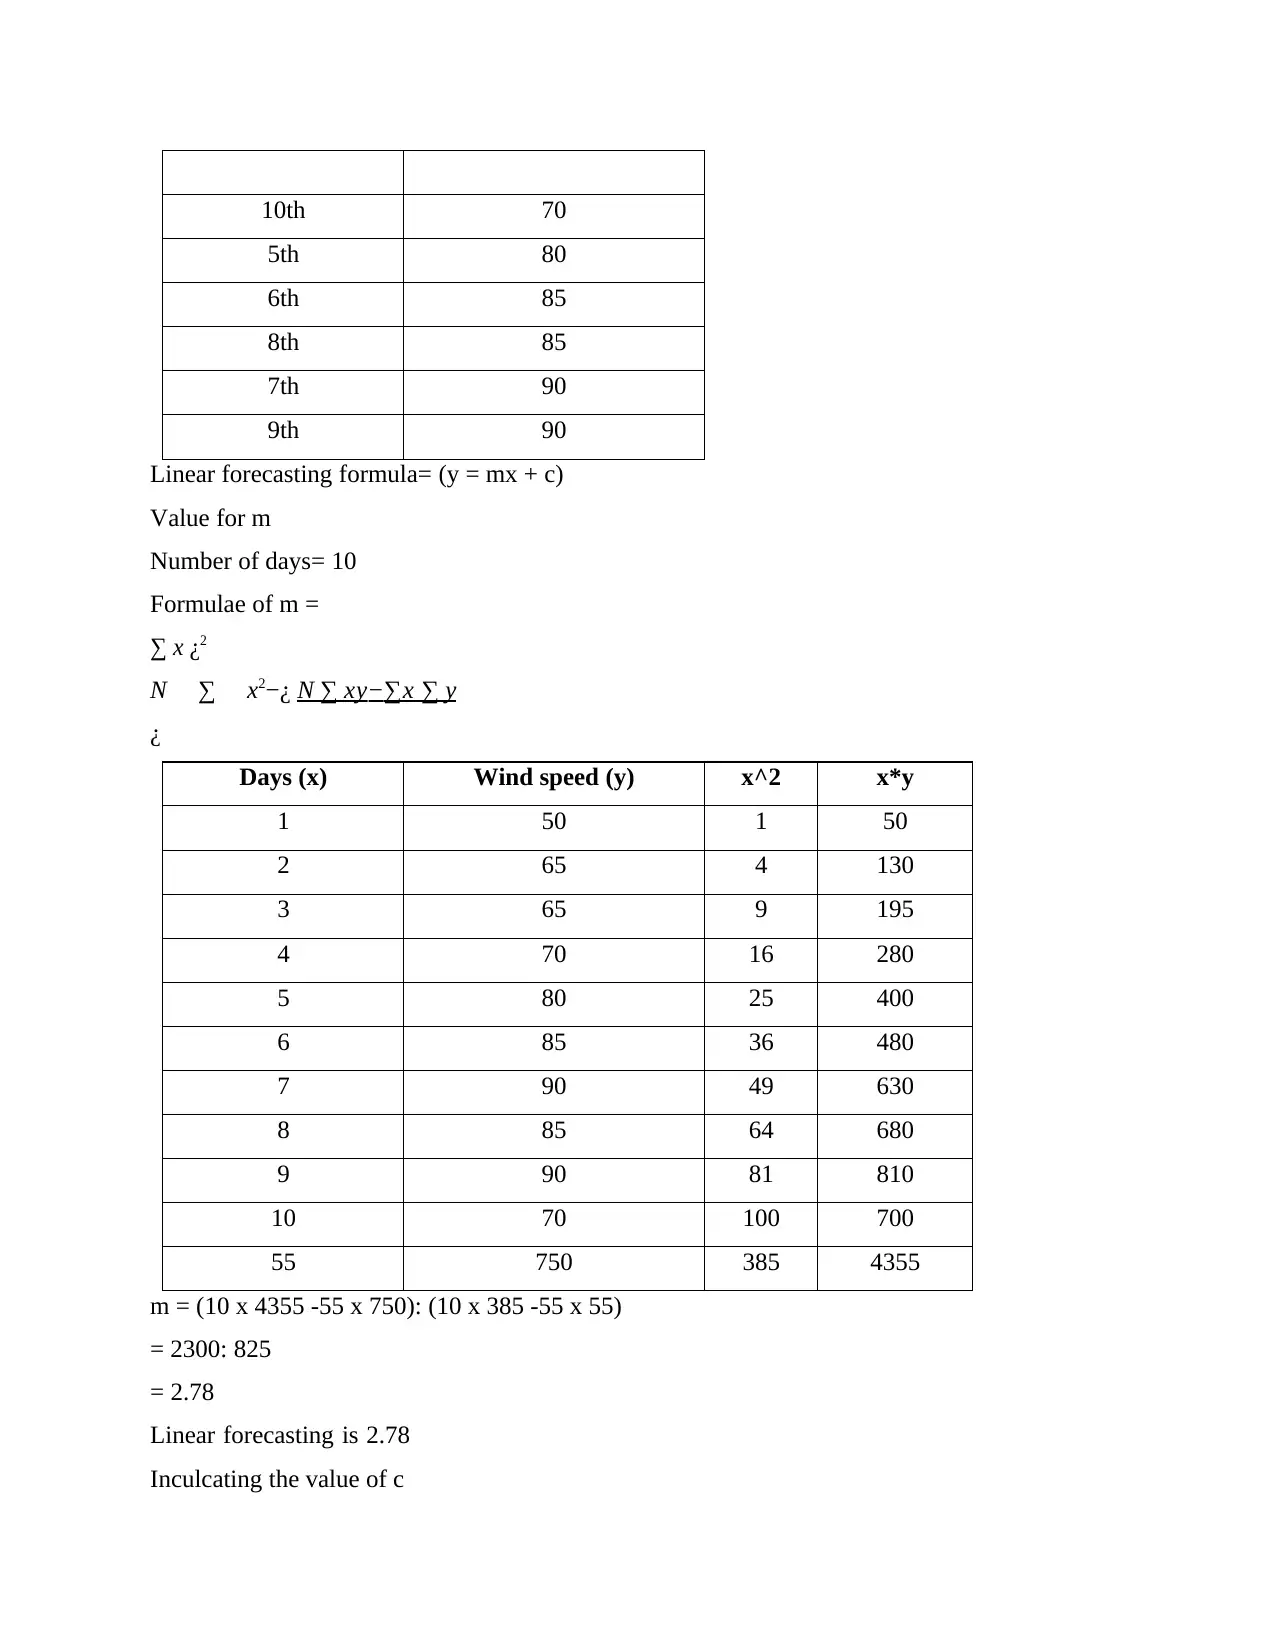
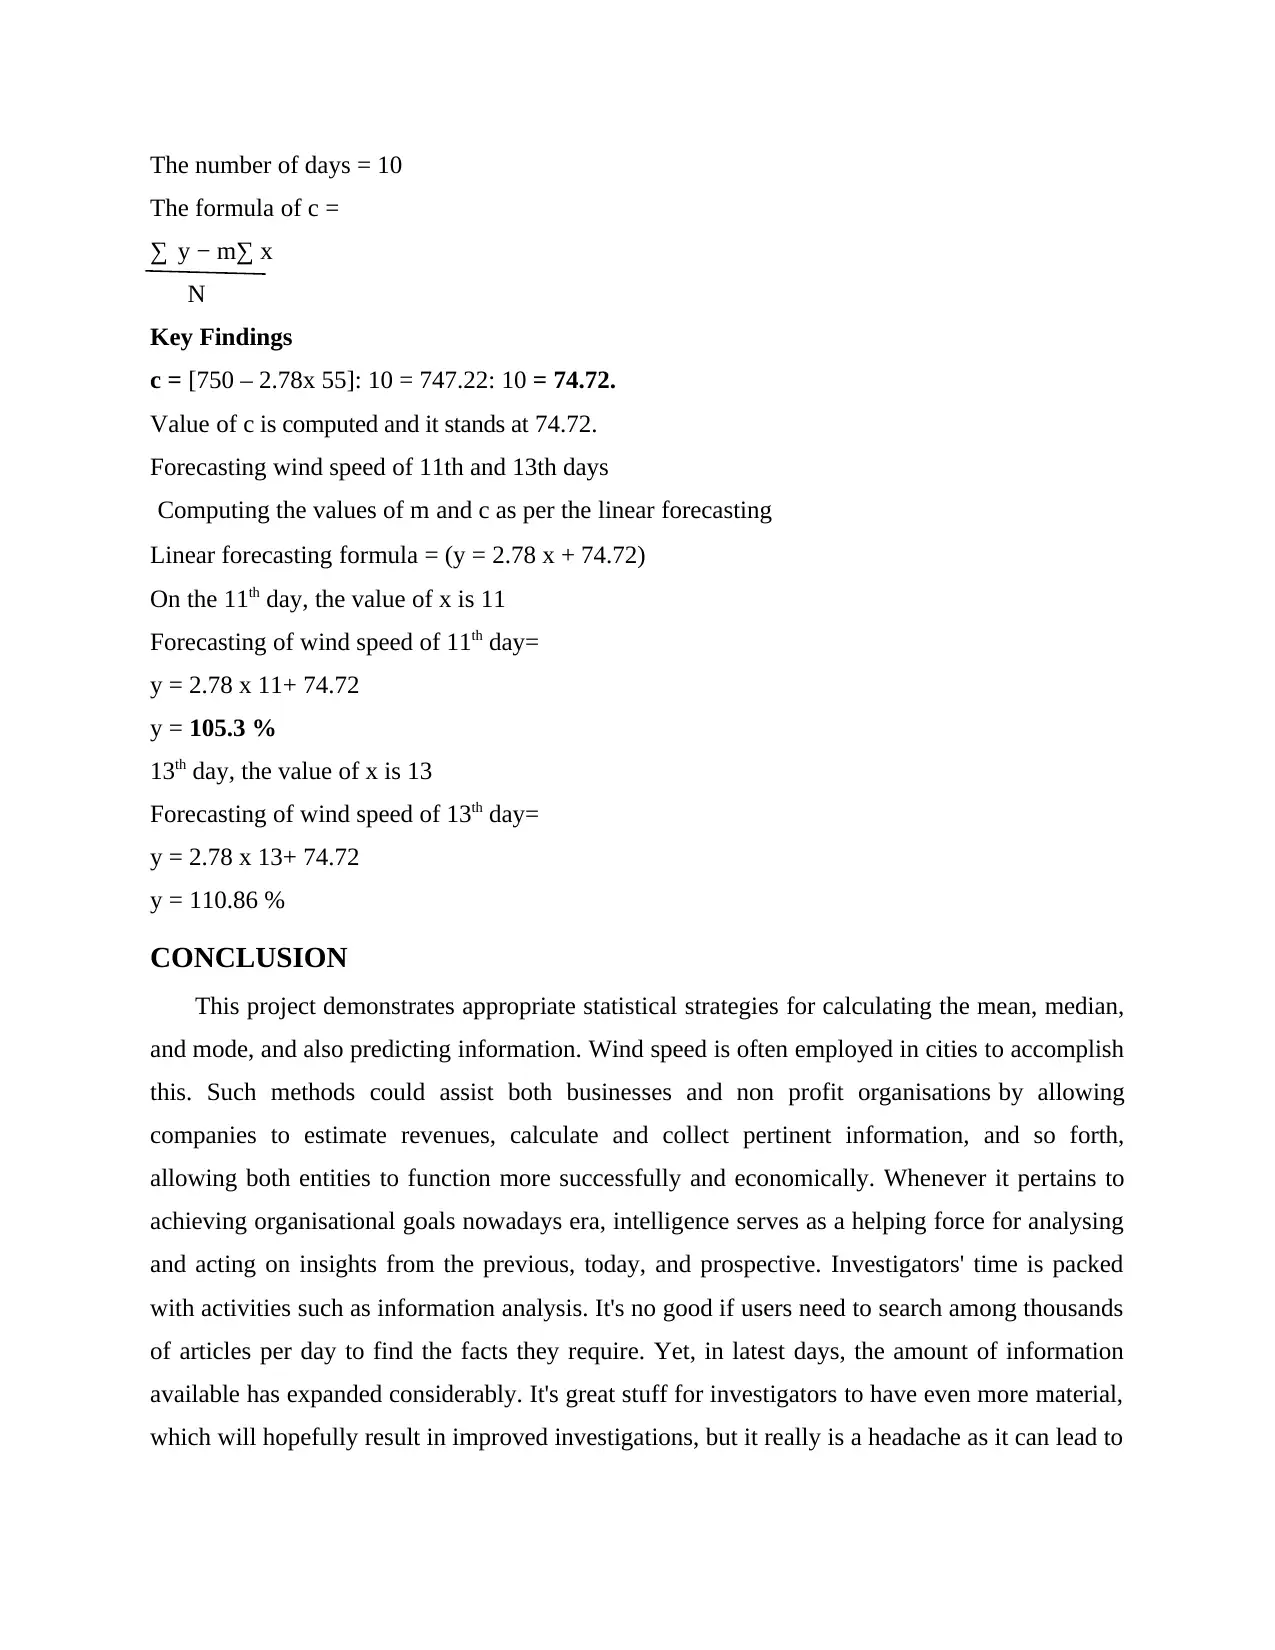
This report provides a detailed analysis of wind speed data using various statistical methods and forecasting techniques. The report begins with an introduction highlighting the importance of data analysis and forecasting in today's environment, particularly in understanding market trends and informing business decisions. The main body of the report focuses on evaluating wind speed data, including the presentation of data using 3D charts. The report calculates and explains key statistical measures such as mean, mode, median, range, and standard deviation. Furthermore, the report delves into linear forecasting, demonstrating the process and formula to predict future wind speeds. The conclusion summarizes the findings, emphasizing the practical applications of these statistical methods for businesses and organizations to estimate revenues, collect pertinent information, and make more informed decisions. The report also includes a comprehensive list of references.

Data Analysis and
Forecasting
Forecasting
Paraphrase This Document
Need a fresh take? Get an instant paraphrase of this document with our AI Paraphraser

Contents
Contents...........................................................................................................................................2
INTRODUCTION...........................................................................................................................1
MAIN BODY..................................................................................................................................1
Evaluating data as per the wind speed.........................................................................................1
Presentation of data......................................................................................................................1
Mean............................................................................................................................................2
Mode............................................................................................................................................3
Median.........................................................................................................................................3
Range...........................................................................................................................................3
Standard Deviation......................................................................................................................4
Linear Forecasting.......................................................................................................................4
CONCLUSION................................................................................................................................6
REFERENCES................................................................................................................................8

⊘ This is a preview!⊘
Do you want full access?
Subscribe today to unlock all pages.

Trusted by 1+ million students worldwide

INTRODUCTION
Statistics and communication are considered strong in today's environment, and this
statement highlights the significance of statistics and facts research (Bataev, 2019). In contrast,
gathered information must be used in a manner which renders it comprehensible, available, and
comparative to certain other time series. Every one of the companies in the sequence is
combining technology and knowledge to create new perspectives on the idea of upcoming
interactions. This data is critical for determining marketplace and sector developments. In any
industry, collecting this data is critical to the creation of monetary contracts. The ability of a
corporation to embrace forecasts could aid in displaying strategies to boost earnings whilst
preventing disasters. As phase of this effort, a number of graphs would be utilised to illustrate the
information, as well as a methodology to estimate wind speed, covering mean, median, mode,
standard deviation, and range (Bathla, Rani and Aggarwal, 2018).
MAIN BODY
Evaluating data as per the wind speed
Days Wind speed
1st 50
2nd 65
3rd 65
4th 70
5th 80
6th 85
7th 90
8th 85
9th 90
10th 70
Total Gross 750
Presentation of data
3D column chart-
Paraphrase This Document
Need a fresh take? Get an instant paraphrase of this document with our AI Paraphraser

3D bar chart-
Evaluation of data for presentation
Mean
The formula of Mean: (μ) =
❑
∑ x
❑
N
Key Findings
Number of days: 10
Observing the wind speed: 750
Evaluation of data for presentation
Mean
The formula of Mean: (μ) =
❑
∑ x
❑
N
Key Findings
Number of days: 10
Observing the wind speed: 750

Mean (μ): 750: 10 = 75 %
Thus the mean is 75 (Castano, Ferrara and Montanelli, 2018).
Mode
Key Findings
Number of days =10
Wind speed = 50, 65, 65, 70, 80, 85, 90, 85, 90, 70
Mode = 65%, 70%, 85% and 90%.
Thus there are 4 modes that are 65, 70, 85, and 90 (Foster and Pascal, 2020).
Median
Formula for median = number of terms +1 divided by 2
Key Findings
Days Wind speed (%)
1st 50
2nd 65
3rd 65
4th 70
10th 70
5th 80
6th 85
8th 85
7th 90
9th 90
The number of days = 10
Median value of days = (10+ 1): 2 = 11/ 2= 5.5 %
Average median = (upper value + lower value): 2 = [70+80]: 2 = 75 %
Thus the median is 75 (Grable and Lyons, 2018).
Range
Formulae for range = (Largest value – smallest value)
Key Findings
Largest value of wind speed = 90 %
⊘ This is a preview!⊘
Do you want full access?
Subscribe today to unlock all pages.

Trusted by 1+ million students worldwide

Smallest value of wind speed = 50%
Range = [90 – 50] = 40%
Thus the range is 40 (Luechtefeld, Rowlands and Hartung, 2018).
Standard Deviation
Standard deviation (σ) =
x
❑
∑(¿−μ)
2
❑
N
❑
√ ¿
Key Findings
Days Wind speed (%) Mean (μ) (x-μ) (x-μ)^2
1st 50 75 (50-75)=-25 625
2nd 65 75 (65-75)=-10 100
3rd 65 75 (65-75)-10 100
4th 70 75 (70-75)=-5 25
10th 70 75 (70-75)=-5 25
5th 80 75 (80-75)=5 25
6th 85 75 (85-75)=10 100
8th 85 75 (85-75)=10 100
7th 90 75 (90-75)=15 225
9th 90 75 (90-75)=15 225
Total Gross 750 0 1550
= √ [1550:10]
= 12.44 %
Linear Forecasting
Days Wind speed (%)
1st 50
2nd 65
3rd 65
4th 70
Paraphrase This Document
Need a fresh take? Get an instant paraphrase of this document with our AI Paraphraser

10th 70
5th 80
6th 85
8th 85
7th 90
9th 90
Linear forecasting formula= (y = mx + c)
Value for m
Number of days= 10
Formulae of m =
∑ x ¿ 2
N ∑ x2−¿ N ∑ xy−∑x ∑ y
¿
Days (x) Wind speed (y) x^2 x*y
1 50 1 50
2 65 4 130
3 65 9 195
4 70 16 280
5 80 25 400
6 85 36 480
7 90 49 630
8 85 64 680
9 90 81 810
10 70 100 700
55 750 385 4355
m = (10 x 4355 -55 x 750): (10 x 385 -55 x 55)
= 2300: 825
= 2.78
Linear forecasting is 2.78
Inculcating the value of c

The number of days = 10
The formula of c =
∑ y − m∑ x
N
Key Findings
c = [750 – 2.78x 55]: 10 = 747.22: 10 = 74.72.
Value of c is computed and it stands at 74.72.
Forecasting wind speed of 11th and 13th days
Computing the values of m and c as per the linear forecasting
Linear forecasting formula = (y = 2.78 x + 74.72)
On the 11th day, the value of x is 11
Forecasting of wind speed of 11th day=
y = 2.78 x 11+ 74.72
y = 105.3 %
13th day, the value of x is 13
Forecasting of wind speed of 13th day=
y = 2.78 x 13+ 74.72
y = 110.86 %
CONCLUSION
This project demonstrates appropriate statistical strategies for calculating the mean, median,
and mode, and also predicting information. Wind speed is often employed in cities to accomplish
this. Such methods could assist both businesses and non profit organisations by allowing
companies to estimate revenues, calculate and collect pertinent information, and so forth,
allowing both entities to function more successfully and economically. Whenever it pertains to
achieving organisational goals nowadays era, intelligence serves as a helping force for analysing
and acting on insights from the previous, today, and prospective. Investigators' time is packed
with activities such as information analysis. It's no good if users need to search among thousands
of articles per day to find the facts they require. Yet, in latest days, the amount of information
available has expanded considerably. It's great stuff for investigators to have even more material,
which will hopefully result in improved investigations, but it really is a headache as it can lead to
⊘ This is a preview!⊘
Do you want full access?
Subscribe today to unlock all pages.

Trusted by 1+ million students worldwide

serious burnout of the worker at many occasions and thus it is very crucial to maintain a balance
between professional and personal life of the researcher.
Paraphrase This Document
Need a fresh take? Get an instant paraphrase of this document with our AI Paraphraser

REFERENCES
Books and journals
Bataev, A.V., 2019, October. Evaluation of Development and Application of Big Data. In 2019
14th International Conference on Advanced Technologies, Systems and Services in
Telecommunications (TELSIKS) (pp. 392-395). IEEE.
Bathla, G., Rani, R. and Aggarwal, H., 2018. Comparative study of NoSQL databases for big
data storage. International Journal of Engineering & Technology, 7(2.6), pp.83-87.
Castano, S., Ferrara, A. and Montanelli, S., 2018. Matching techniques for data integration and
exploration: from databases to big data. In A Comprehensive Guide Through the Italian
Database Research Over the Last 25 Years (pp. 61-76). Springer, Cham.
Foster, I. and Pascal, H., 2020. Databases. In Big Data and Social Science (pp. 67-99). Chapman
and Hall/CRC.
Grable, J.E. and Lyons, A.C., 2018. An Introduction to Big Data. Journal of financial service
professionals, 72(5).
Luechtefeld, T., Rowlands, C. and Hartung, T., 2018. Big-data and machine learning to revamp
computational toxicology and its use in risk assessment. Toxicology research, 7(5), pp.732-
744.
1 out of 11
Related Documents

Your All-in-One AI-Powered Toolkit for Academic Success.
+13062052269
info@desklib.com
Available 24*7 on WhatsApp / Email
Unlock your academic potential
Copyright © 2020–2025 A2Z Services. All Rights Reserved. Developed and managed by ZUCOL.