Report on Data Analysis and Forecasting of Humidity Levels
VerifiedAdded on 2023/06/13
|10
|1507
|395
Report
AI Summary
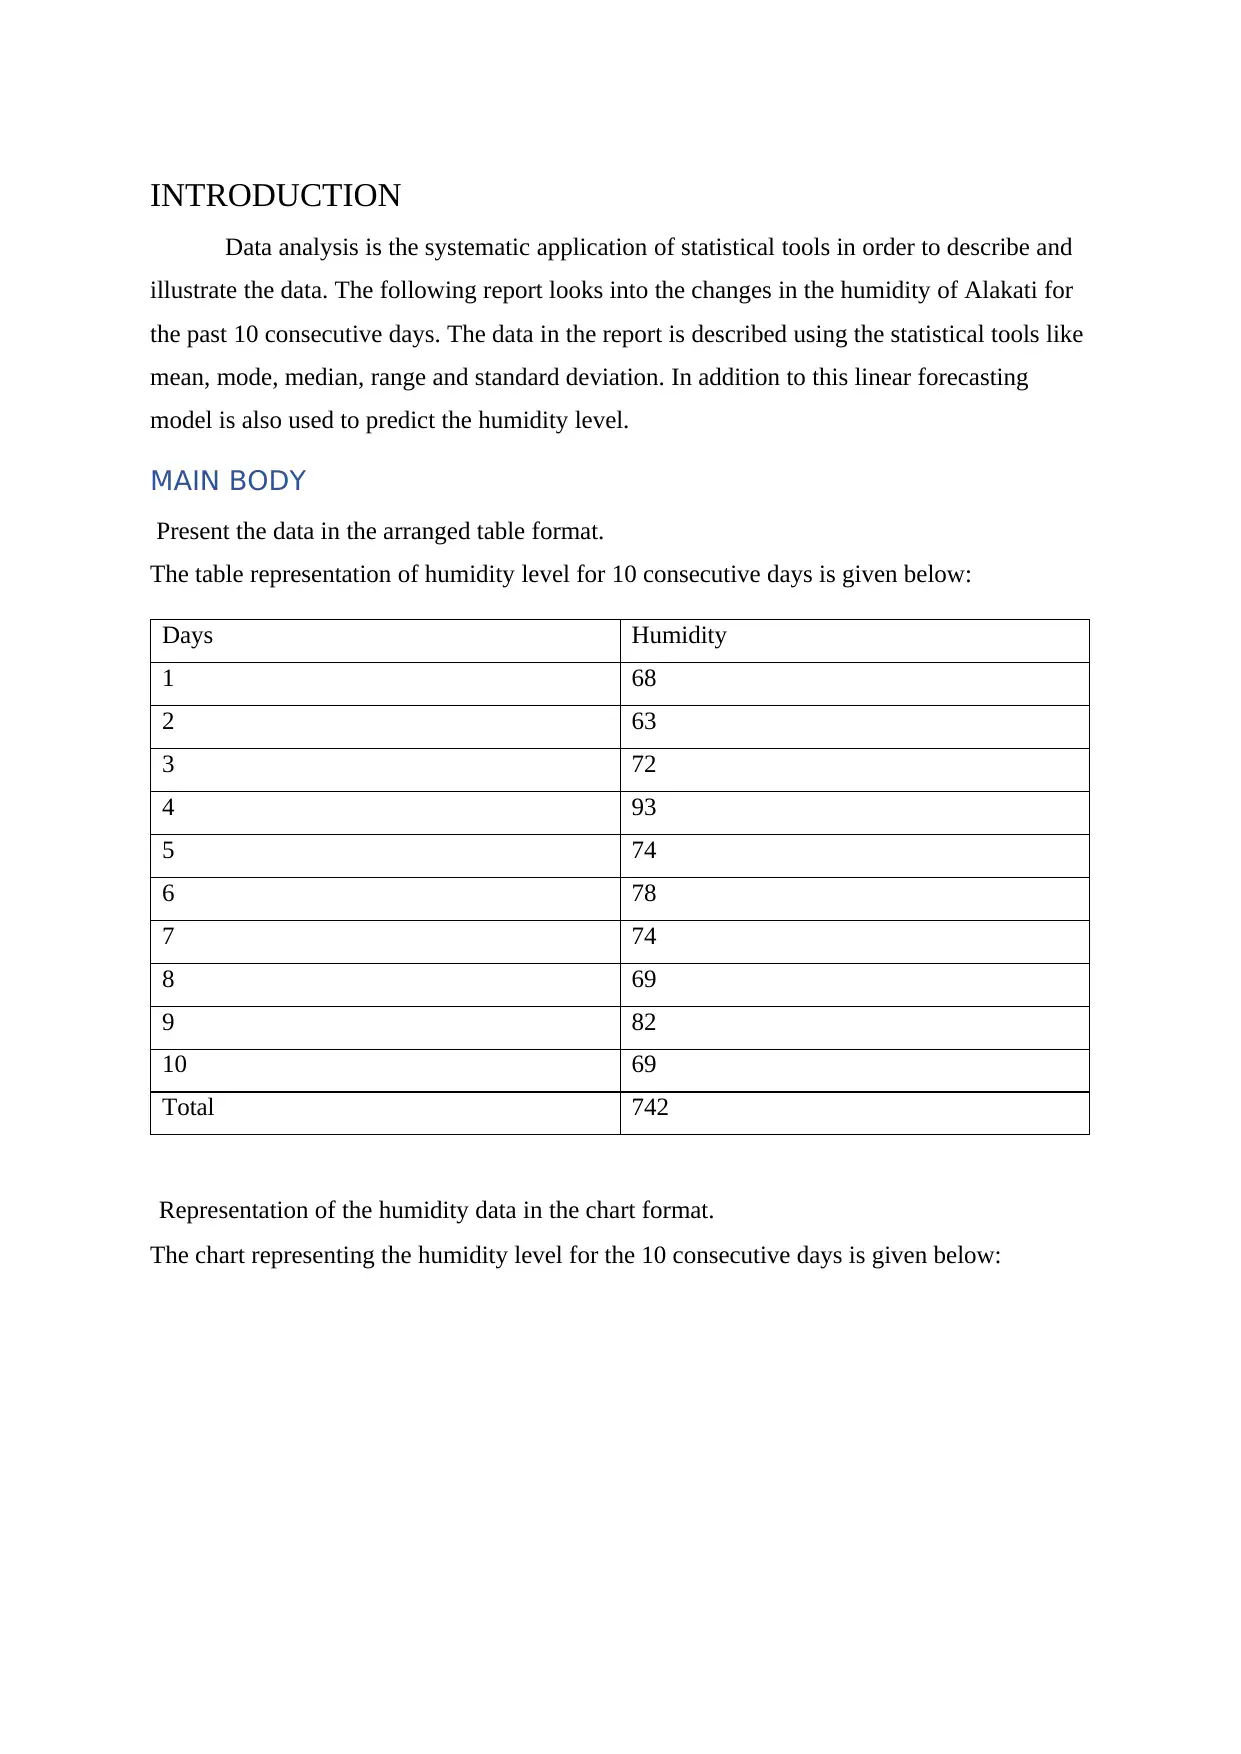
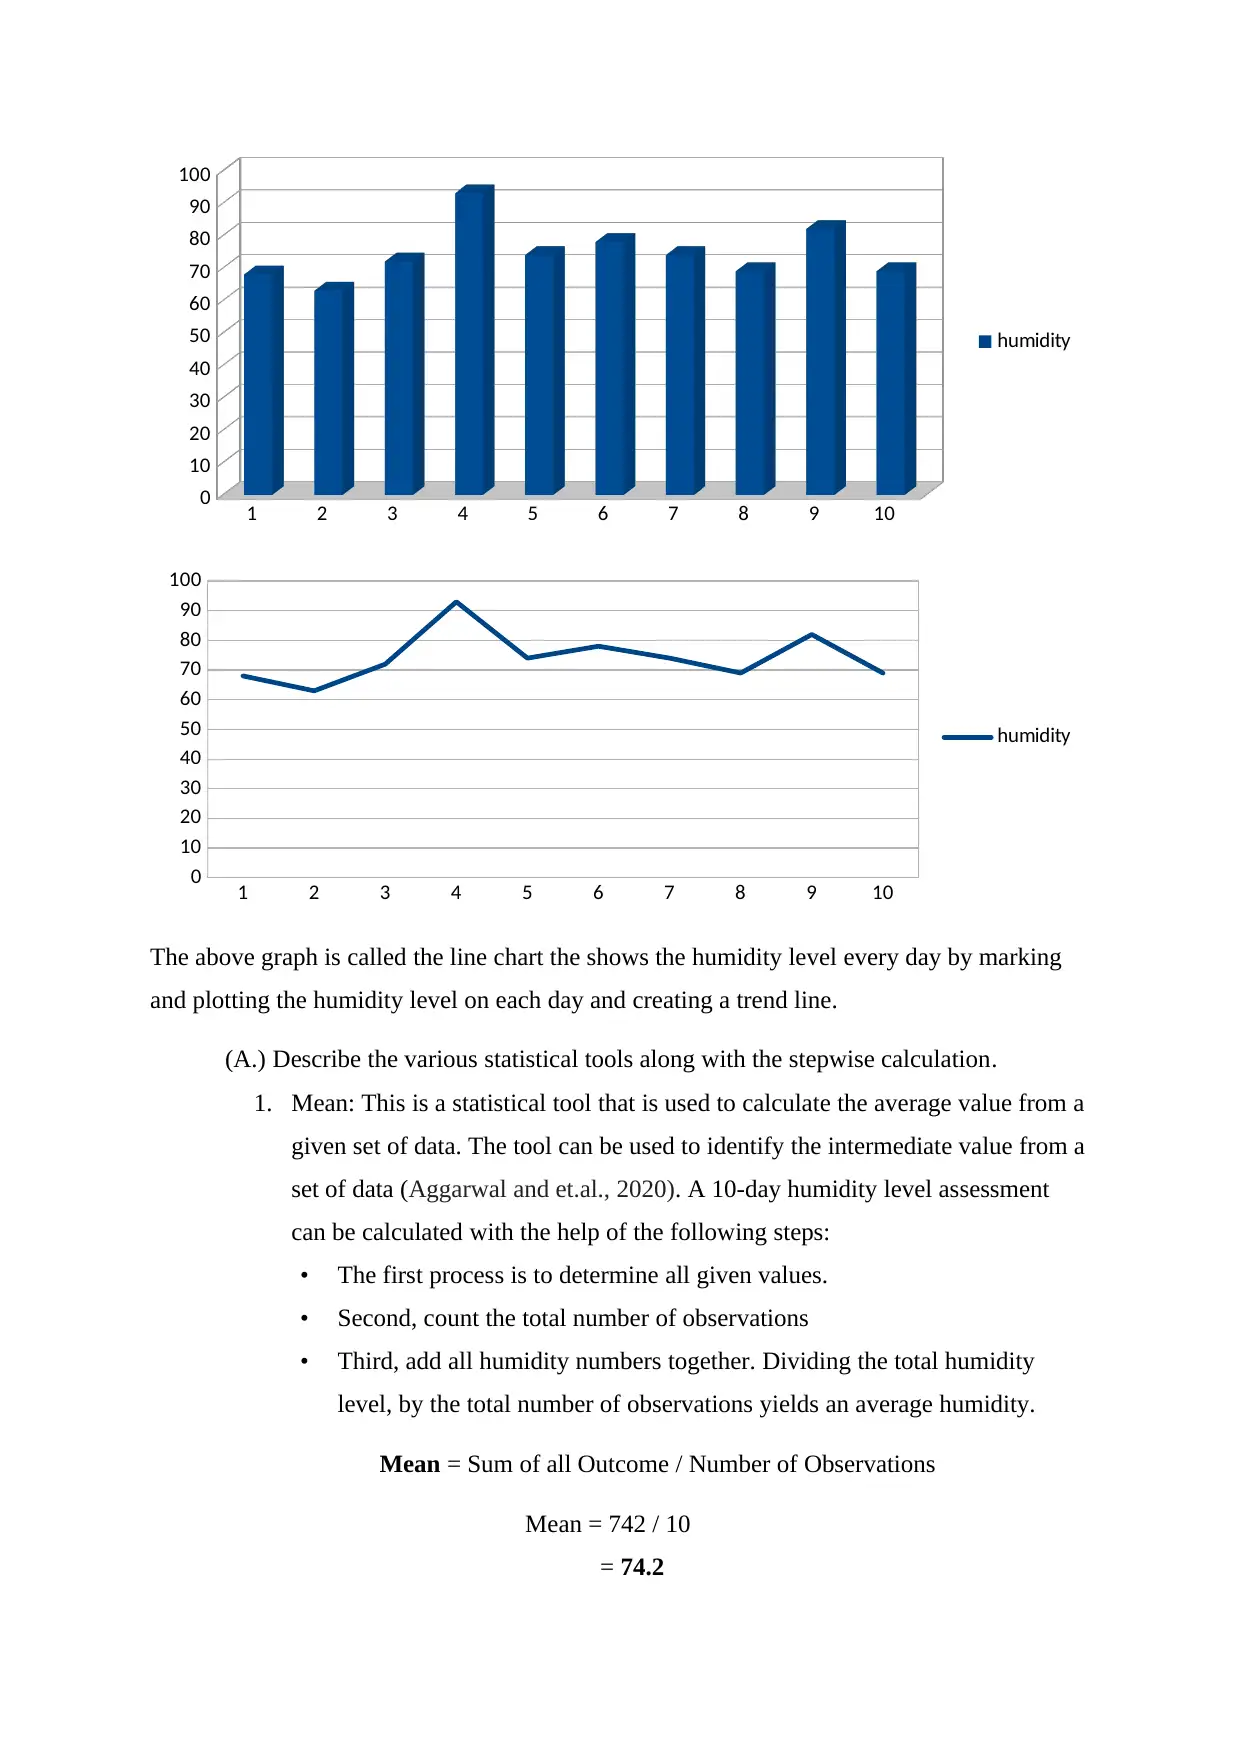
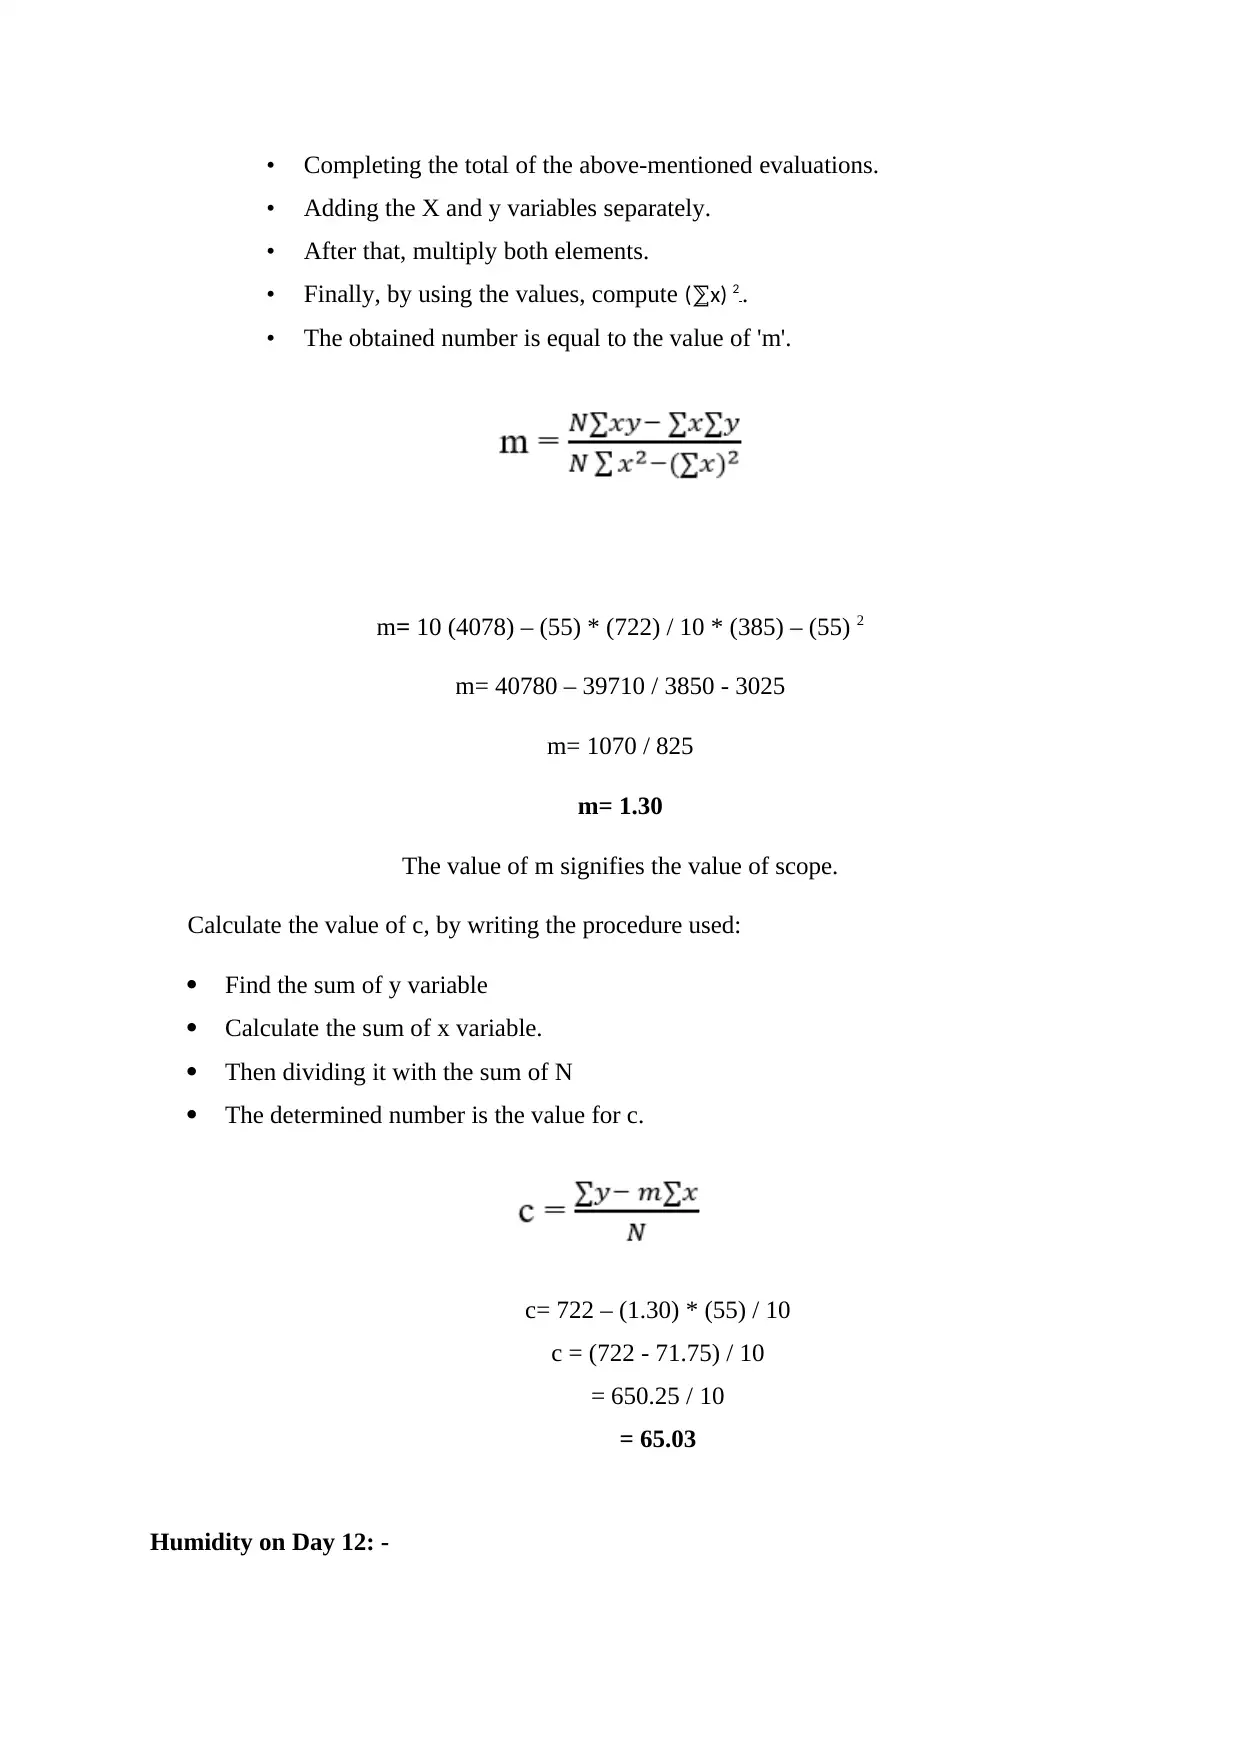
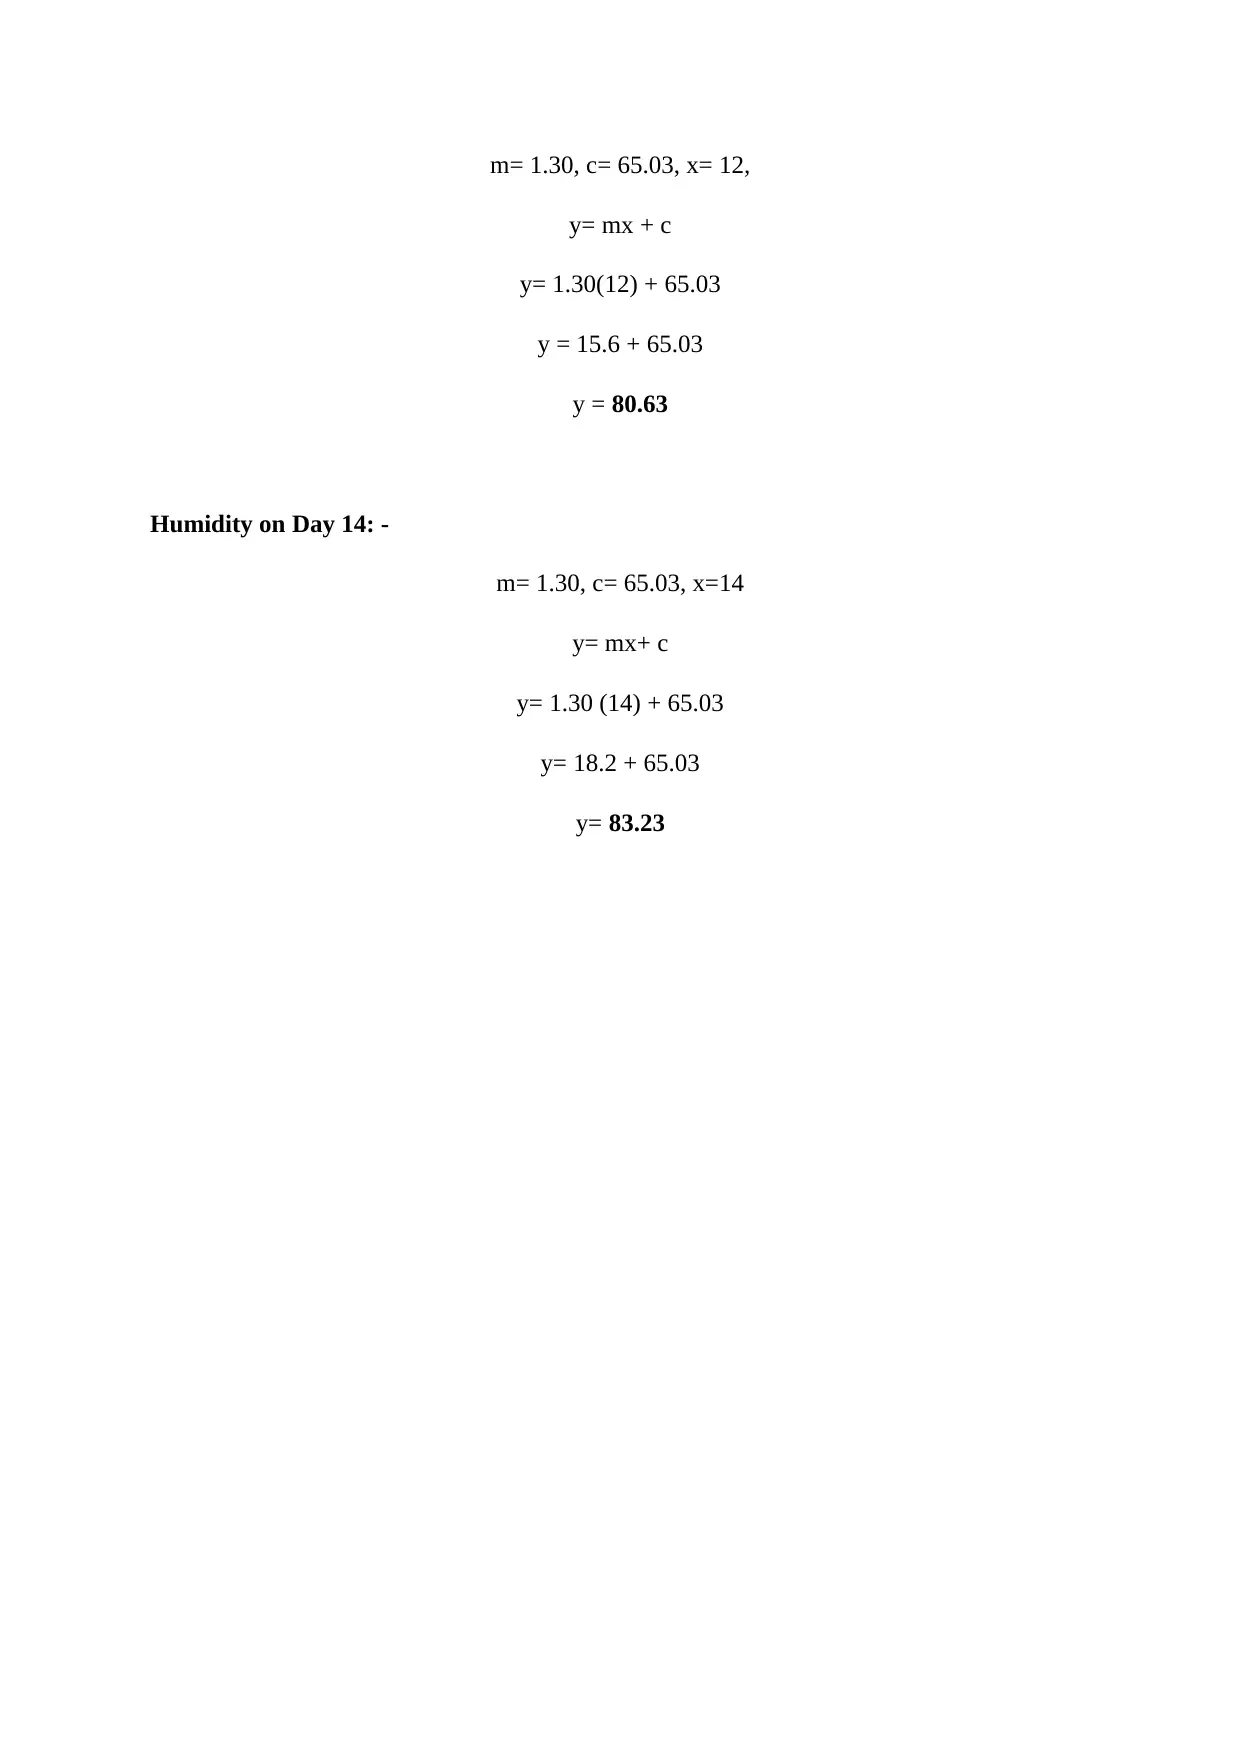
This report presents a data analysis and forecasting of humidity levels in Alakati over ten consecutive days. Statistical tools, including mean, median, mode, range, and standard deviation, are employed to describe the data. The mean humidity is calculated as 74.2, the median as 61, and the mode as 91. The range is 38, and the standard deviation is 4.68. Furthermore, a linear forecasting model is used to predict humidity levels for day 12 (80.63) and day 14 (83.23), providing insights into future humidity trends. Desklib offers access to similar reports and solved assignments for students.

Data Analysis and
Forecasting
Forecasting
Paraphrase This Document
Need a fresh take? Get an instant paraphrase of this document with our AI Paraphraser

Contents
INTRODUCTION.................................................................................................................................3
MAIN BODY.......................................................................................................................................3
Present the data in the arranged table format.....................................................................................3
Representation of the humidity data in the chart format....................................................................3
Describe the various statistical tools along with the stepwise calculation..........................................4
With the use of liner forecasting model form the regression equation can computation of the value
of m and c..........................................................................................................................................6
CONCLUSION.....................................................................................................................................8
References.............................................................................................................................................9

INTRODUCTION
Data analysis is the systematic application of statistical tools in order to describe and
illustrate the data. The following report looks into the changes in the humidity of Alakati for
the past 10 consecutive days. The data in the report is described using the statistical tools like
mean, mode, median, range and standard deviation. In addition to this linear forecasting
model is also used to predict the humidity level.
MAIN BODY
Present the data in the arranged table format.
The table representation of humidity level for 10 consecutive days is given below:
Days Humidity
1 68
2 63
3 72
4 93
5 74
6 78
7 74
8 69
9 82
10 69
Total 742
Representation of the humidity data in the chart format.
The chart representing the humidity level for the 10 consecutive days is given below:
⊘ This is a preview!⊘
Do you want full access?
Subscribe today to unlock all pages.

Trusted by 1+ million students worldwide

1 2 3 4 5 6 7 8 9 10
0
10
20
30
40
50
60
70
80
90
100
humidity
1 2 3 4 5 6 7 8 9 10
0
10
20
30
40
50
60
70
80
90
100
humidity
The above graph is called the line chart the shows the humidity level every day by marking
and plotting the humidity level on each day and creating a trend line.
(A.) Describe the various statistical tools along with the stepwise calculation.
1. Mean: This is a statistical tool that is used to calculate the average value from a
given set of data. The tool can be used to identify the intermediate value from a
set of data (Aggarwal and et.al., 2020). A 10-day humidity level assessment
can be calculated with the help of the following steps:
• The first process is to determine all given values.
• Second, count the total number of observations
• Third, add all humidity numbers together. Dividing the total humidity
level, by the total number of observations yields an average humidity.
Mean = Sum of all Outcome / Number of Observations
Mean = 742 / 10
= 74.2
0
10
20
30
40
50
60
70
80
90
100
humidity
1 2 3 4 5 6 7 8 9 10
0
10
20
30
40
50
60
70
80
90
100
humidity
The above graph is called the line chart the shows the humidity level every day by marking
and plotting the humidity level on each day and creating a trend line.
(A.) Describe the various statistical tools along with the stepwise calculation.
1. Mean: This is a statistical tool that is used to calculate the average value from a
given set of data. The tool can be used to identify the intermediate value from a
set of data (Aggarwal and et.al., 2020). A 10-day humidity level assessment
can be calculated with the help of the following steps:
• The first process is to determine all given values.
• Second, count the total number of observations
• Third, add all humidity numbers together. Dividing the total humidity
level, by the total number of observations yields an average humidity.
Mean = Sum of all Outcome / Number of Observations
Mean = 742 / 10
= 74.2
Paraphrase This Document
Need a fresh take? Get an instant paraphrase of this document with our AI Paraphraser

2. Median: It is a metric that is used to find the midpoint of a set of data. It's
calculated by sorting the information in ascending order (Aljawarneh and Lara
Torralbo., 2021).
The following are the steps to determining the mid-value:
• Sorting the data from the smallest to the greatest figure.
• Determining if the number of observations is odd or even.
• If the observations are evenly spaced, apply the formula (N / 2)
• And if the observed data is odd, the formula (N + 1) / 2 should be applied.
• The median location is determined by the derived value obtained from the
preceding calculations.
Median: If 'N' is odd = (N+1) / 2
If 'N' is even = (N / 2)
Given data is in percentage:
61,55,58,91,78,93,88,59,57,82
55,57,58,59,61,78,82,88,91,91
Median = (N / 2)
= 10 / 2
= 5th Position
Median = 61
3. Mode: It's a measure that aids in determining the most common value in a set
of data rows. The following are the steps required in the calculation:
First, data must be collected and organised.
After that, examine the various values.
The third step is to count the number of times that figure appears in the
data; finally, the mode is the value that appears the most frequently.
Mode = 91
4. Range: The difference between the highest and lowest number in a set of data
is known as range.
It comprises the stages for computation given below.
Organizing all of the info that is accessible.
Looking at the top and lowest figures.

Taking the lowest figure and subtracting it from the greatest figure.
The range is the result of the preceding stages.
Range = Maximum value – minimum value
Range = 93 - 55
Range = 38
5. Standard Deviation: This is a metric for determining how distributed a number
is in relation to the mean.
Steps to take:
• The mean from the supplied row of data must be found first.
• Second, for each observation, determine the difference between the value
and the mode of the data.
• Including all of the value from the second procedure.
• Breaking it down by the number of terms.
• Then, in the fourth step, calculate the square of the resulting figure.
Standard Deviation= √ (xi – μ) 2 / N
= √ (2193.6) / 10
= √ 21.94
= 4.68
With the use of liner forecasting model form the regression equation can computation of the
value of m and c.
Liner Forecasting Model: This is a model that aids in the prediction of future
values in a linear equation based on previous values (Erzurumlu. and
Pachamanova,, 2020)
y = mx + c
Y is a dependent variable in this case.
'mx' stands for an independent variable, whereas 'C' stands for the
constant.
The processes involved in calculating the value m are listed below.
• Multiplying both variables, x and y, which stand for days and humidity level,
respectively.
⊘ This is a preview!⊘
Do you want full access?
Subscribe today to unlock all pages.

Trusted by 1+ million students worldwide

• Completing the total of the above-mentioned evaluations.
• Adding the X and y variables separately.
• After that, multiply both elements.
• Finally, by using the values, compute (⅀x) 2 .
• The obtained number is equal to the value of 'm'.
m= 10 (4078) – (55) * (722) / 10 * (385) – (55) 2
m= 40780 – 39710 / 3850 - 3025
m= 1070 / 825
m= 1.30
The value of m signifies the value of scope.
Calculate the value of c, by writing the procedure used:
Find the sum of y variable
Calculate the sum of x variable.
Then dividing it with the sum of N
The determined number is the value for c.
c= 722 – (1.30) * (55) / 10
c = (722 - 71.75) / 10
= 650.25 / 10
= 65.03
Humidity on Day 12: -
Paraphrase This Document
Need a fresh take? Get an instant paraphrase of this document with our AI Paraphraser

m= 1.30, c= 65.03, x= 12,
y= mx + c
y= 1.30(12) + 65.03
y = 15.6 + 65.03
y = 80.63
Humidity on Day 14: -
m= 1.30, c= 65.03, x=14
y= mx+ c
y= 1.30 (14) + 65.03
y= 18.2 + 65.03
y= 83.23
y= mx + c
y= 1.30(12) + 65.03
y = 15.6 + 65.03
y = 80.63
Humidity on Day 14: -
m= 1.30, c= 65.03, x=14
y= mx+ c
y= 1.30 (14) + 65.03
y= 18.2 + 65.03
y= 83.23

CONCLUSION
From the above report it can be seen that, table 1 shows data from Alakati showing
stickiness for the earlier 10 days. Both the chart shows the humidity of the city. The air
humidity of the city is determined with calculation tools. From the above calculations, it can
be seen that the mean is 72.2, the median is 61, and the mode is 91. The range of the data is
38 and the standard deviation is 4.68. The linear prediction model is used to predict the
humidity of day 12 and day 14, which are 80.63 and 83.23.
⊘ This is a preview!⊘
Do you want full access?
Subscribe today to unlock all pages.

Trusted by 1+ million students worldwide

References
Books & Journals
Aggarwal, A. and et.al., 2020. Landslide data analysis using various time-series forecasting
models. Computers & Electrical Engineering, 88. p.106858.
Aljawarneh, S. and Lara Torralbo, J.A., 2021, April. Meteorological forecasting based on big data
analysis. In International Conference on Data Science, E-learning and Information
Systems 2021 (pp. 9-11).
Weng, T., Liu, W. and Xiao, J., 2019. Supply chain sales forecasting based on lightGBM and
LSTM combination model. Industrial Management & Data Systems.
Erzurumlu, S.S. and Pachamanova, D., 2020. Topic modeling and technology forecasting for
assessing the commercial viability of healthcare innovations. Technological
Forecasting and Social Change, 156. p.120041.
1 out of 10
Related Documents

Your All-in-One AI-Powered Toolkit for Academic Success.
+13062052269
info@desklib.com
Available 24*7 on WhatsApp / Email
Unlock your academic potential
Copyright © 2020–2025 A2Z Services. All Rights Reserved. Developed and managed by ZUCOL.