Temperature Data Analysis: Central Tendency and Forecasting Report
VerifiedAdded on 2023/06/08
|9
|1565
|165
Report
AI Summary
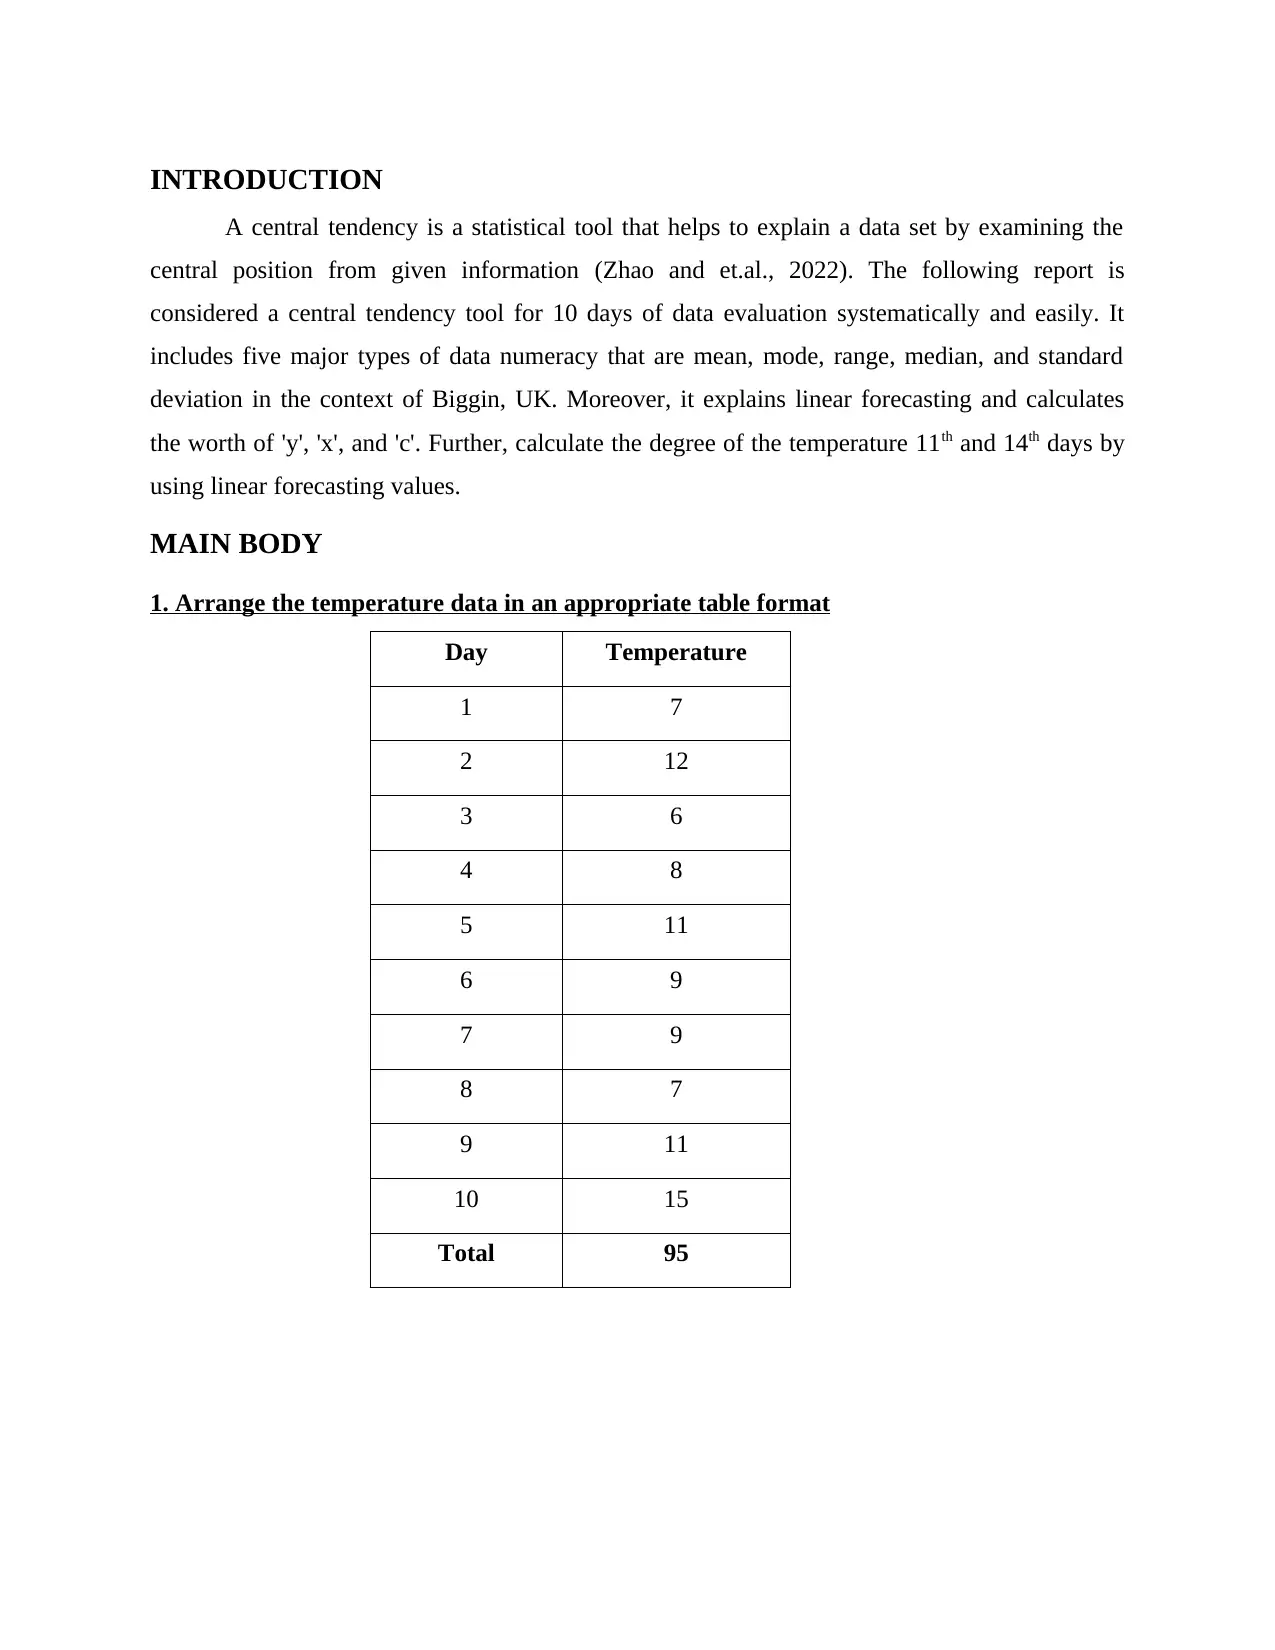
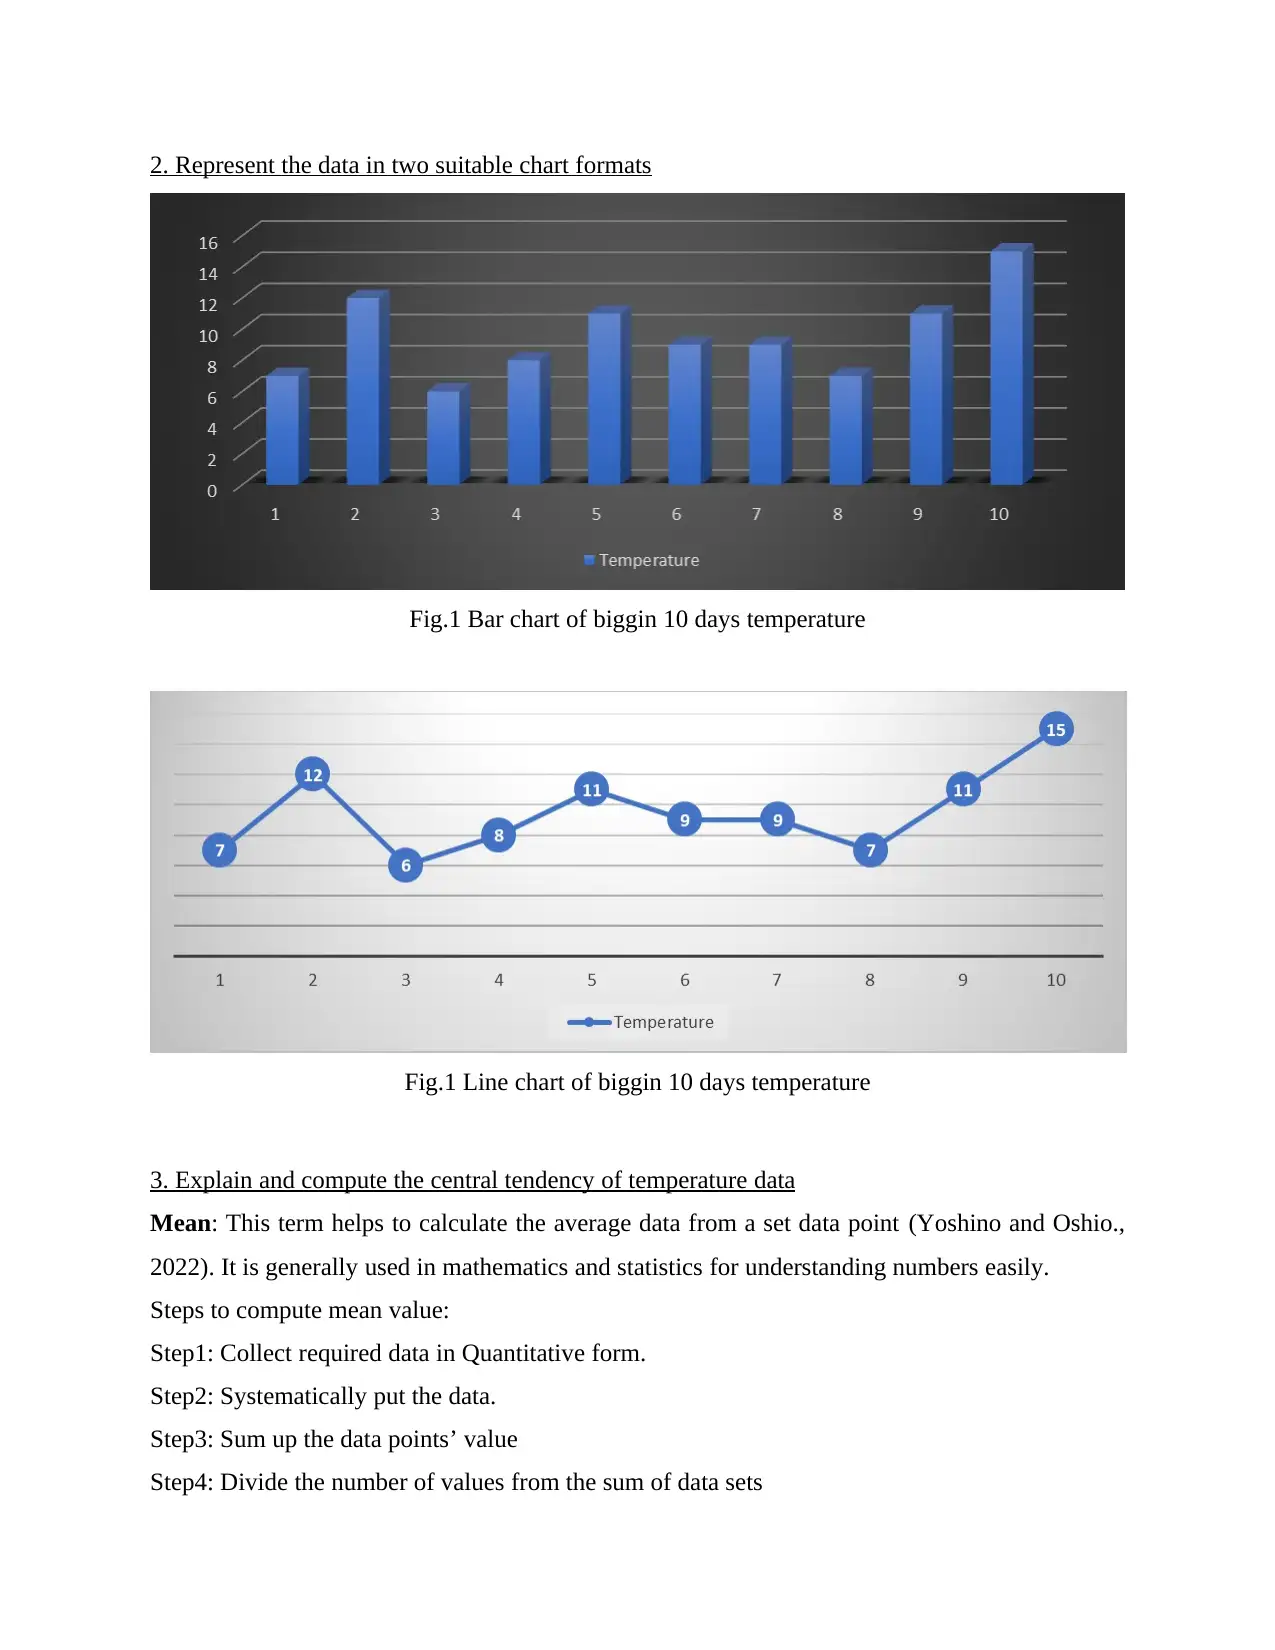
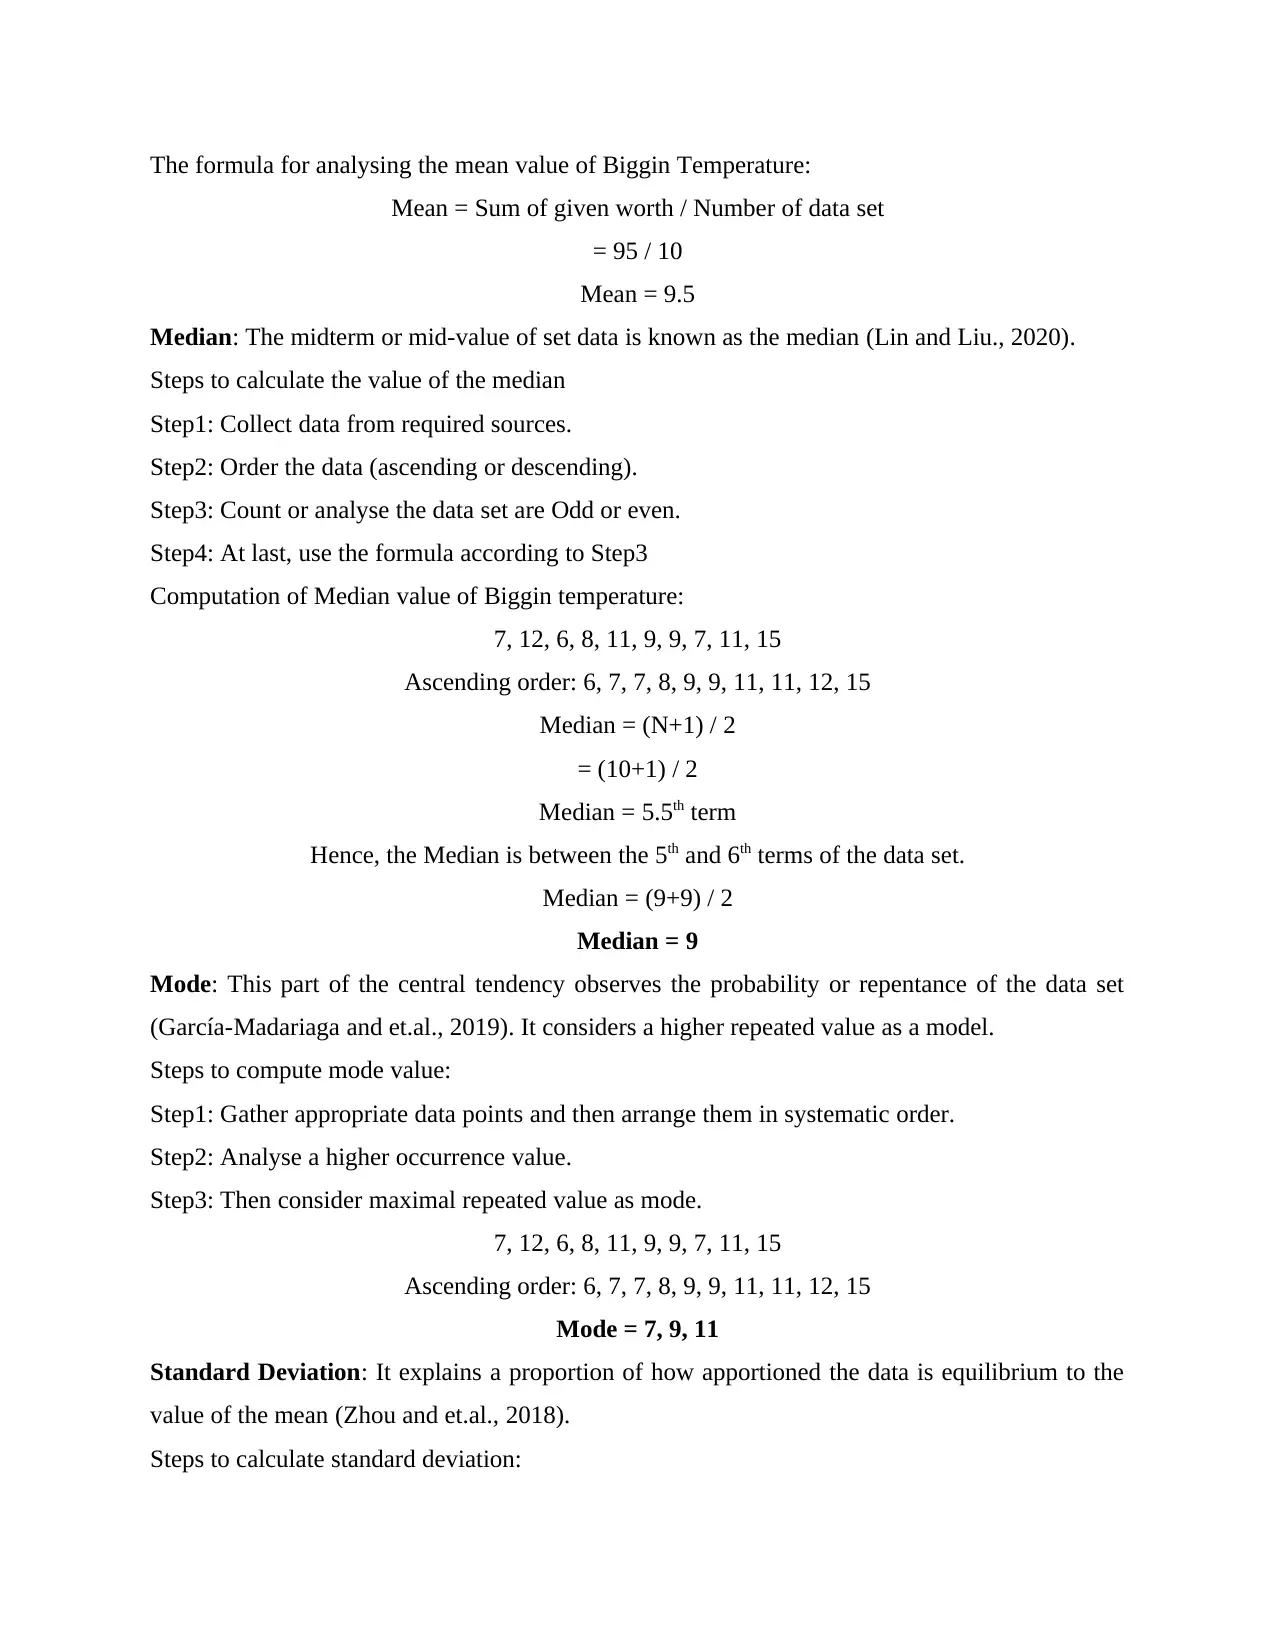
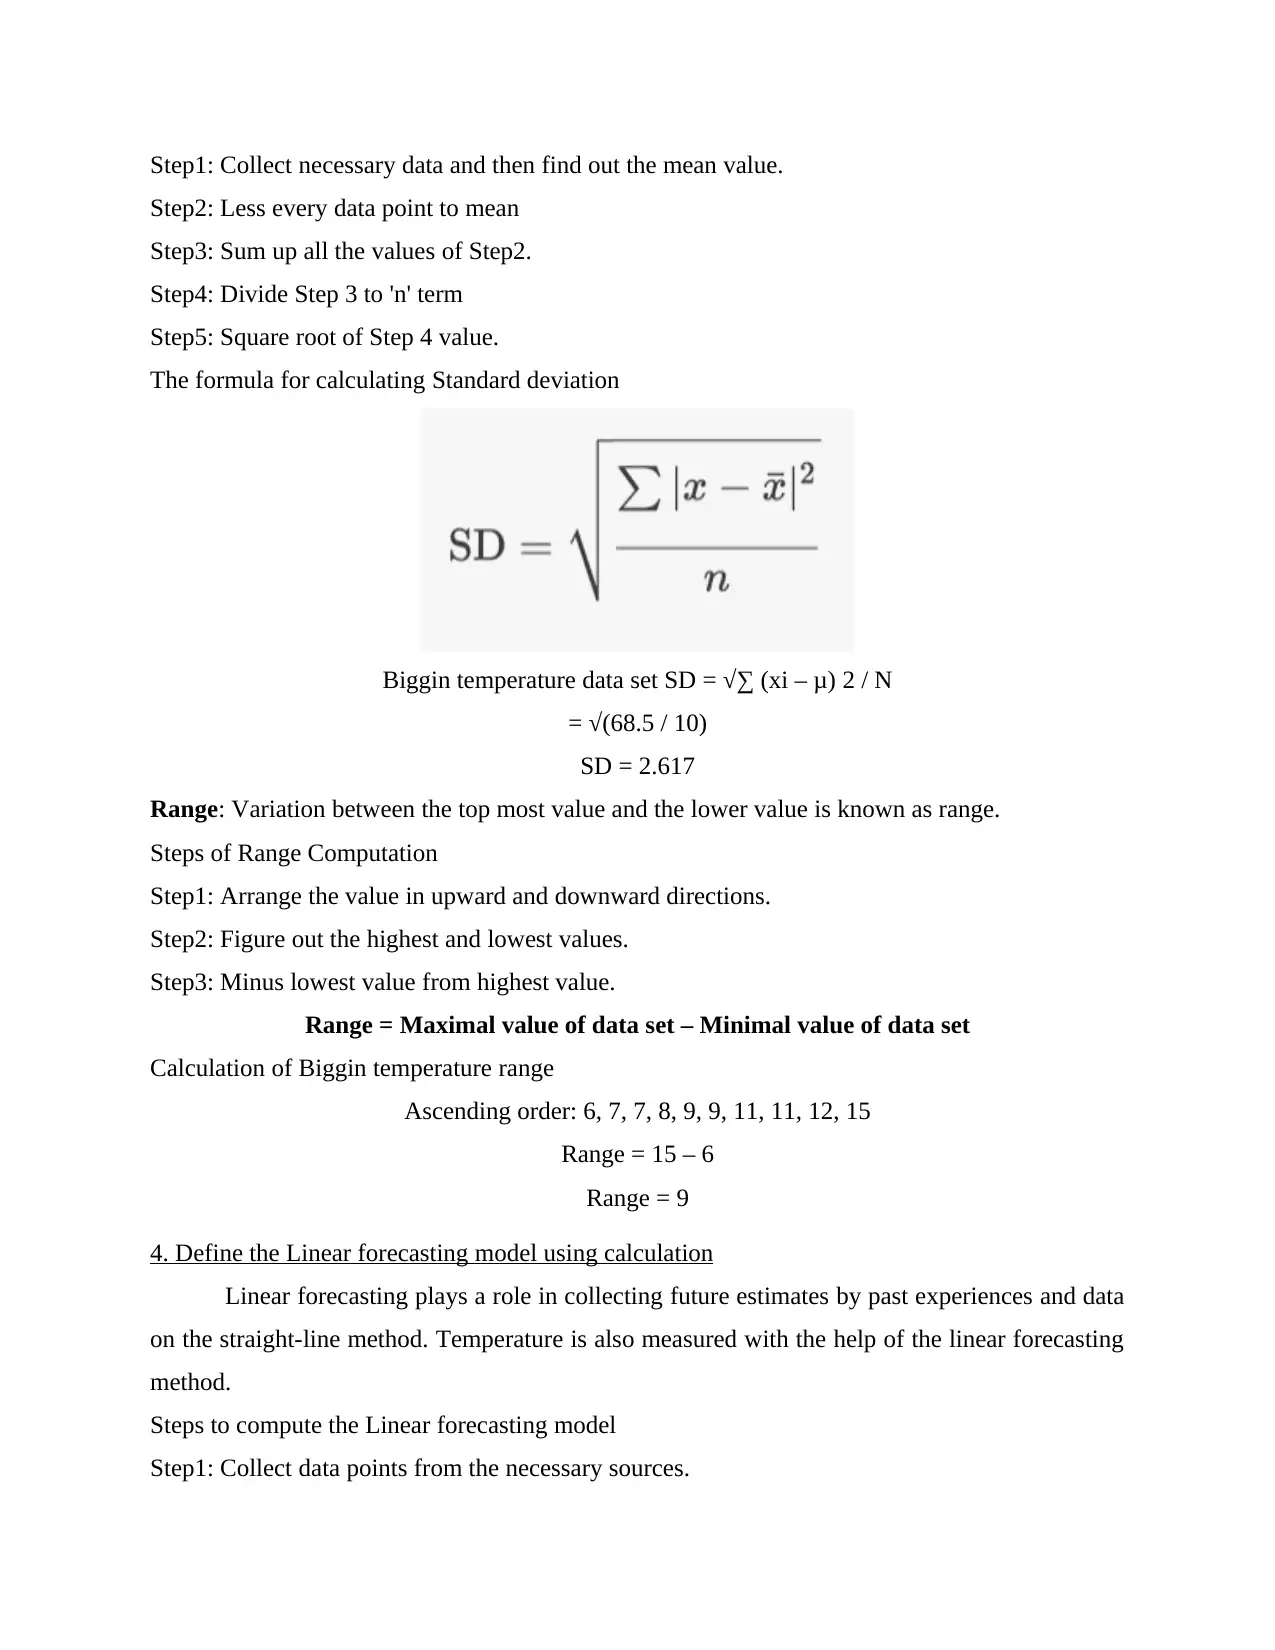
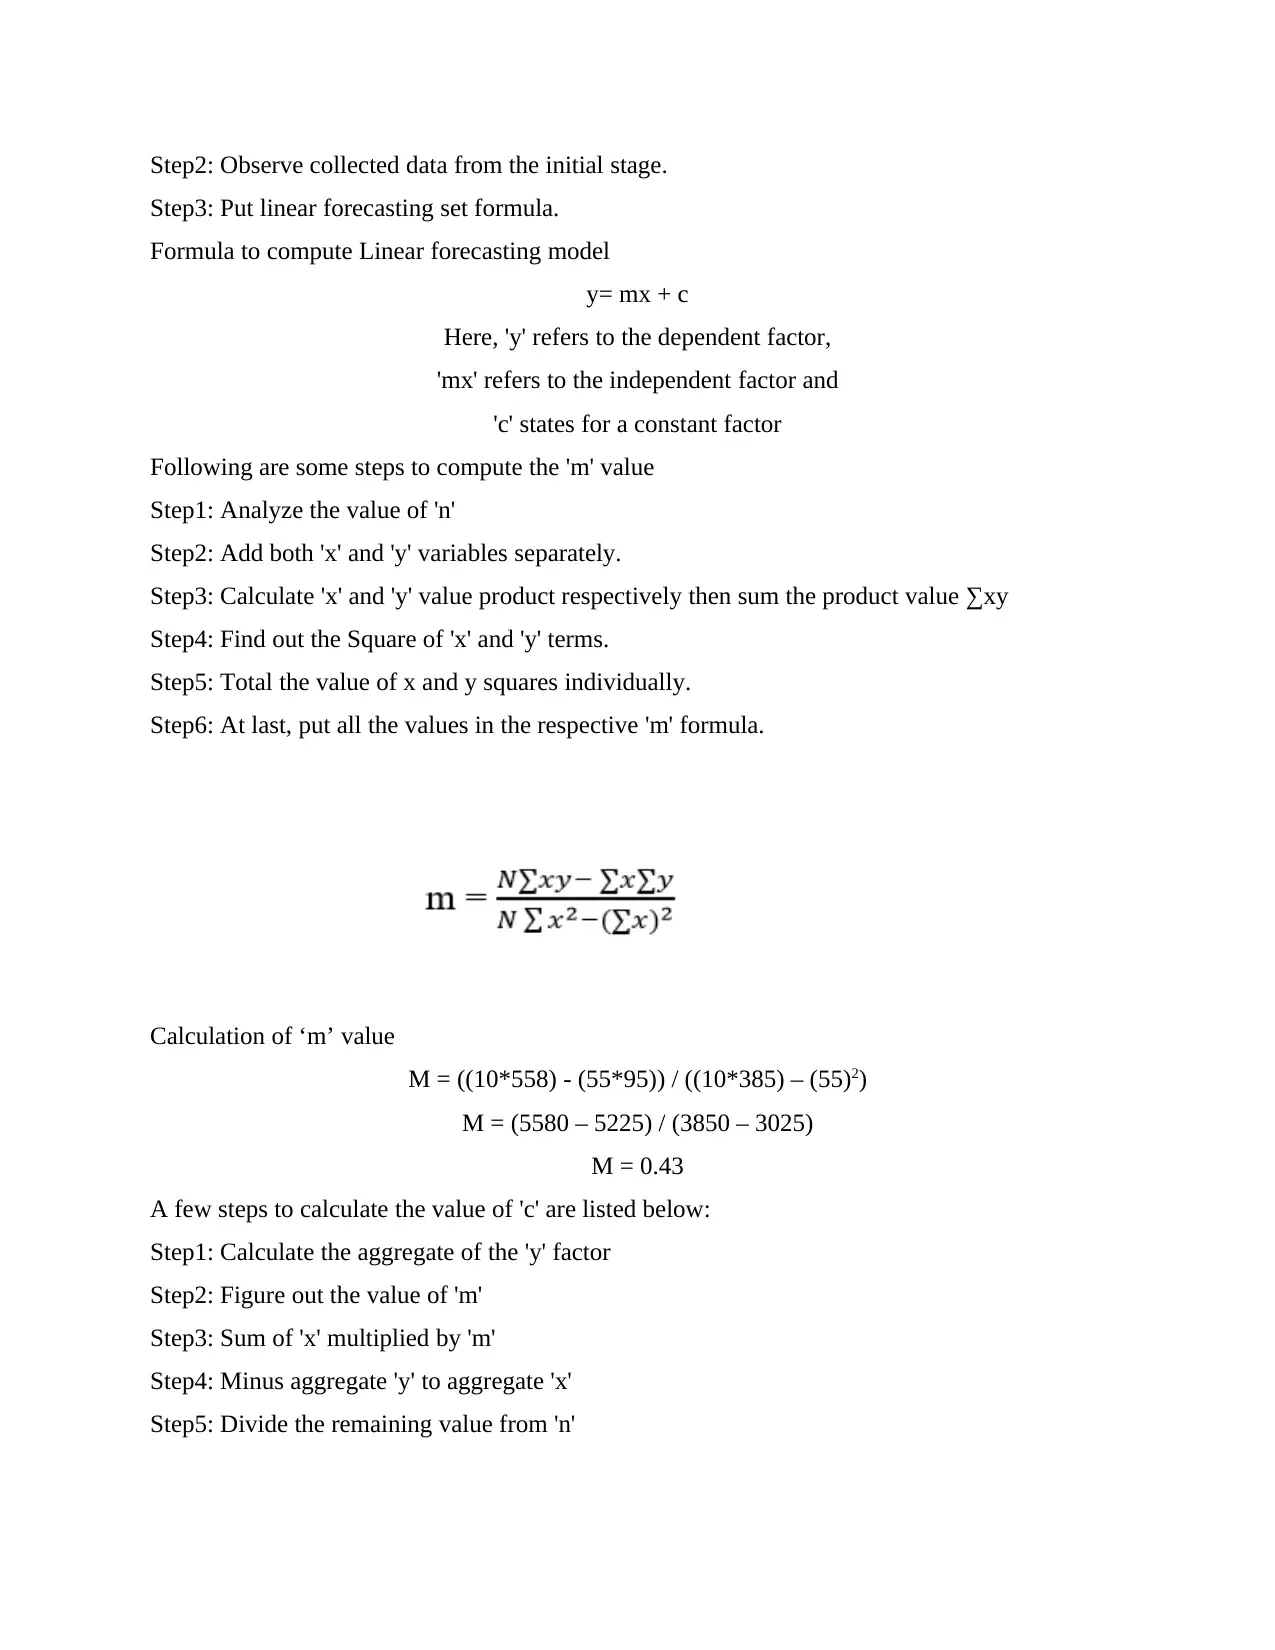
This report provides a comprehensive analysis of temperature data for a 10-day period in Biggin, UK, using various statistical tools. It calculates the mean, median, mode, standard deviation, and range to determine the central tendency of the data. The report also explains and applies a linear forecasting model to predict the temperature on the 11th and 14th days, calculating the values of 'm' and 'c' in the linear equation. The analysis demonstrates the application of data numeracy in understanding and predicting temperature patterns, offering insights into the use of statistical methods for data interpretation and forecasting.

Numeracy and Data
Analysis
Analysis
Paraphrase This Document
Need a fresh take? Get an instant paraphrase of this document with our AI Paraphraser

Table of Contents
INTRODUCTION...........................................................................................................................3
MAIN BODY...................................................................................................................................3
1. Arrange the temperature data in an appropriate table format.............................................3
2. Represent the data in two suitable chart formats................................................................4
3. Explain and compute the central tendency of temperature data.........................................4
4. Define the Linear forecasting model using calculation......................................................6
CONCLUSION................................................................................................................................8
REFERENCES................................................................................................................................9

INTRODUCTION
A central tendency is a statistical tool that helps to explain a data set by examining the
central position from given information (Zhao and et.al., 2022). The following report is
considered a central tendency tool for 10 days of data evaluation systematically and easily. It
includes five major types of data numeracy that are mean, mode, range, median, and standard
deviation in the context of Biggin, UK. Moreover, it explains linear forecasting and calculates
the worth of 'y', 'x', and 'c'. Further, calculate the degree of the temperature 11th and 14th days by
using linear forecasting values.
MAIN BODY
1. Arrange the temperature data in an appropriate table format
Day Temperature
1 7
2 12
3 6
4 8
5 11
6 9
7 9
8 7
9 11
10 15
Total 95
⊘ This is a preview!⊘
Do you want full access?
Subscribe today to unlock all pages.

Trusted by 1+ million students worldwide

2. Represent the data in two suitable chart formats
Fig.1 Bar chart of biggin 10 days temperature
Fig.1 Line chart of biggin 10 days temperature
3. Explain and compute the central tendency of temperature data
Mean: This term helps to calculate the average data from a set data point (Yoshino and Oshio.,
2022). It is generally used in mathematics and statistics for understanding numbers easily.
Steps to compute mean value:
Step1: Collect required data in Quantitative form.
Step2: Systematically put the data.
Step3: Sum up the data points’ value
Step4: Divide the number of values from the sum of data sets
Paraphrase This Document
Need a fresh take? Get an instant paraphrase of this document with our AI Paraphraser

The formula for analysing the mean value of Biggin Temperature:
Mean = Sum of given worth / Number of data set
= 95 / 10
Mean = 9.5
Median: The midterm or mid-value of set data is known as the median (Lin and Liu., 2020).
Steps to calculate the value of the median
Step1: Collect data from required sources.
Step2: Order the data (ascending or descending).
Step3: Count or analyse the data set are Odd or even.
Step4: At last, use the formula according to Step3
Computation of Median value of Biggin temperature:
7, 12, 6, 8, 11, 9, 9, 7, 11, 15
Ascending order: 6, 7, 7, 8, 9, 9, 11, 11, 12, 15
Median = (N+1) / 2
= (10+1) / 2
Median = 5.5th term
Hence, the Median is between the 5th and 6th terms of the data set.
Median = (9+9) / 2
Median = 9
Mode: This part of the central tendency observes the probability or repentance of the data set
(García-Madariaga and et.al., 2019). It considers a higher repeated value as a model.
Steps to compute mode value:
Step1: Gather appropriate data points and then arrange them in systematic order.
Step2: Analyse a higher occurrence value.
Step3: Then consider maximal repeated value as mode.
7, 12, 6, 8, 11, 9, 9, 7, 11, 15
Ascending order: 6, 7, 7, 8, 9, 9, 11, 11, 12, 15
Mode = 7, 9, 11
Standard Deviation: It explains a proportion of how apportioned the data is equilibrium to the
value of the mean (Zhou and et.al., 2018).
Steps to calculate standard deviation:

Step1: Collect necessary data and then find out the mean value.
Step2: Less every data point to mean
Step3: Sum up all the values of Step2.
Step4: Divide Step 3 to 'n' term
Step5: Square root of Step 4 value.
The formula for calculating Standard deviation
Biggin temperature data set SD = √∑ (xi – μ) 2 / N
= √(68.5 / 10)
SD = 2.617
Range: Variation between the top most value and the lower value is known as range.
Steps of Range Computation
Step1: Arrange the value in upward and downward directions.
Step2: Figure out the highest and lowest values.
Step3: Minus lowest value from highest value.
Range = Maximal value of data set – Minimal value of data set
Calculation of Biggin temperature range
Ascending order: 6, 7, 7, 8, 9, 9, 11, 11, 12, 15
Range = 15 – 6
Range = 9
4. Define the Linear forecasting model using calculation
Linear forecasting plays a role in collecting future estimates by past experiences and data
on the straight-line method. Temperature is also measured with the help of the linear forecasting
method.
Steps to compute the Linear forecasting model
Step1: Collect data points from the necessary sources.
⊘ This is a preview!⊘
Do you want full access?
Subscribe today to unlock all pages.

Trusted by 1+ million students worldwide

Step2: Observe collected data from the initial stage.
Step3: Put linear forecasting set formula.
Formula to compute Linear forecasting model
y= mx + c
Here, 'y' refers to the dependent factor,
'mx' refers to the independent factor and
'c' states for a constant factor
Following are some steps to compute the 'm' value
Step1: Analyze the value of 'n'
Step2: Add both 'x' and 'y' variables separately.
Step3: Calculate 'x' and 'y' value product respectively then sum the product value ∑xy
Step4: Find out the Square of 'x' and 'y' terms.
Step5: Total the value of x and y squares individually.
Step6: At last, put all the values in the respective 'm' formula.
Calculation of ‘m’ value
M = ((10*558) - (55*95)) / ((10*385) – (55)2)
M = (5580 – 5225) / (3850 – 3025)
M = 0.43
A few steps to calculate the value of 'c' are listed below:
Step1: Calculate the aggregate of the 'y' factor
Step2: Figure out the value of 'm'
Step3: Sum of 'x' multiplied by 'm'
Step4: Minus aggregate 'y' to aggregate 'x'
Step5: Divide the remaining value from 'n'
Paraphrase This Document
Need a fresh take? Get an instant paraphrase of this document with our AI Paraphraser

C = (95 – (0.43*55)) / 10
C = (95 – 23.65) / 10
C = 7.135
Temperature of 11th Day
C= 7.135, m = 0.43 and x = 11
Y = mx + c
= 0.43*11 + (7.135)
Y = 11.865
Temperature of 14th Day
C = 7.135, m = 0.43 and x = 14
Y = mx + c
= 0.43*14 + (7.135)
Y = 13.155
CONCLUSION
The above report is concluded that numeracy and data analysis is the vital tool to
compute the data set central position. It helps to create a dynamic database of aggregate
information by using effective cost. The above report contains ten days’s temperature data in
numerical form for calculating mean, median, standard deviation, mode, and range. Further,
figure out the value of 'x', 'y,' and 'm' for computing the temperature value of days 11th and 14th.

REFERENCES
Books and Journals
Von Briel, F., 2018. The future of omnichannel retail: A four-stage Delphi study. Technological
Forecasting and Social Change. 132. pp.217-229.
Zhao, L. and et.al., 2022. Investigation of the spreading tendency of emulsified oil slicks on open
systems. Marine Pollution Bulletin. 180. p.113739.
Yoshino, S. and Oshio, A., 2022. Personality and migration in Japan: Examining the tendency of
extroverted and open people to migrate to Tokyo. Journal of Research in
Personality. 96. p.104168.
Lin, Y. and Liu, Q., 2020. Perceived subjective social status and smartphone addiction tendency
among Chinese adolescents: A sequential mediation model. Children and Youth
Services Review, 116, p.105222.
García-Madariaga, J. and et.al., 2019. Do isolated packaging variables influence consumers'
attention and preferences?. Physiology & behavior. 200. pp.96-103.
Zhou, C. and et.al., 2018. Estimation of eco-efficiency and its influencing factors in Guangdong
province based on Super-SBM and panel regression models. Ecological Indicators. 86.
pp.67-80.
⊘ This is a preview!⊘
Do you want full access?
Subscribe today to unlock all pages.

Trusted by 1+ million students worldwide
1 out of 9
Related Documents

Your All-in-One AI-Powered Toolkit for Academic Success.
+13062052269
info@desklib.com
Available 24*7 on WhatsApp / Email
Unlock your academic potential
Copyright © 2020–2025 A2Z Services. All Rights Reserved. Developed and managed by ZUCOL.