Data Analysis and Forecasting Assignment, London School of Commerce

Verified

Added on  2023/01/07

|11
|1465
|85
Homework Assignment
AI Summary
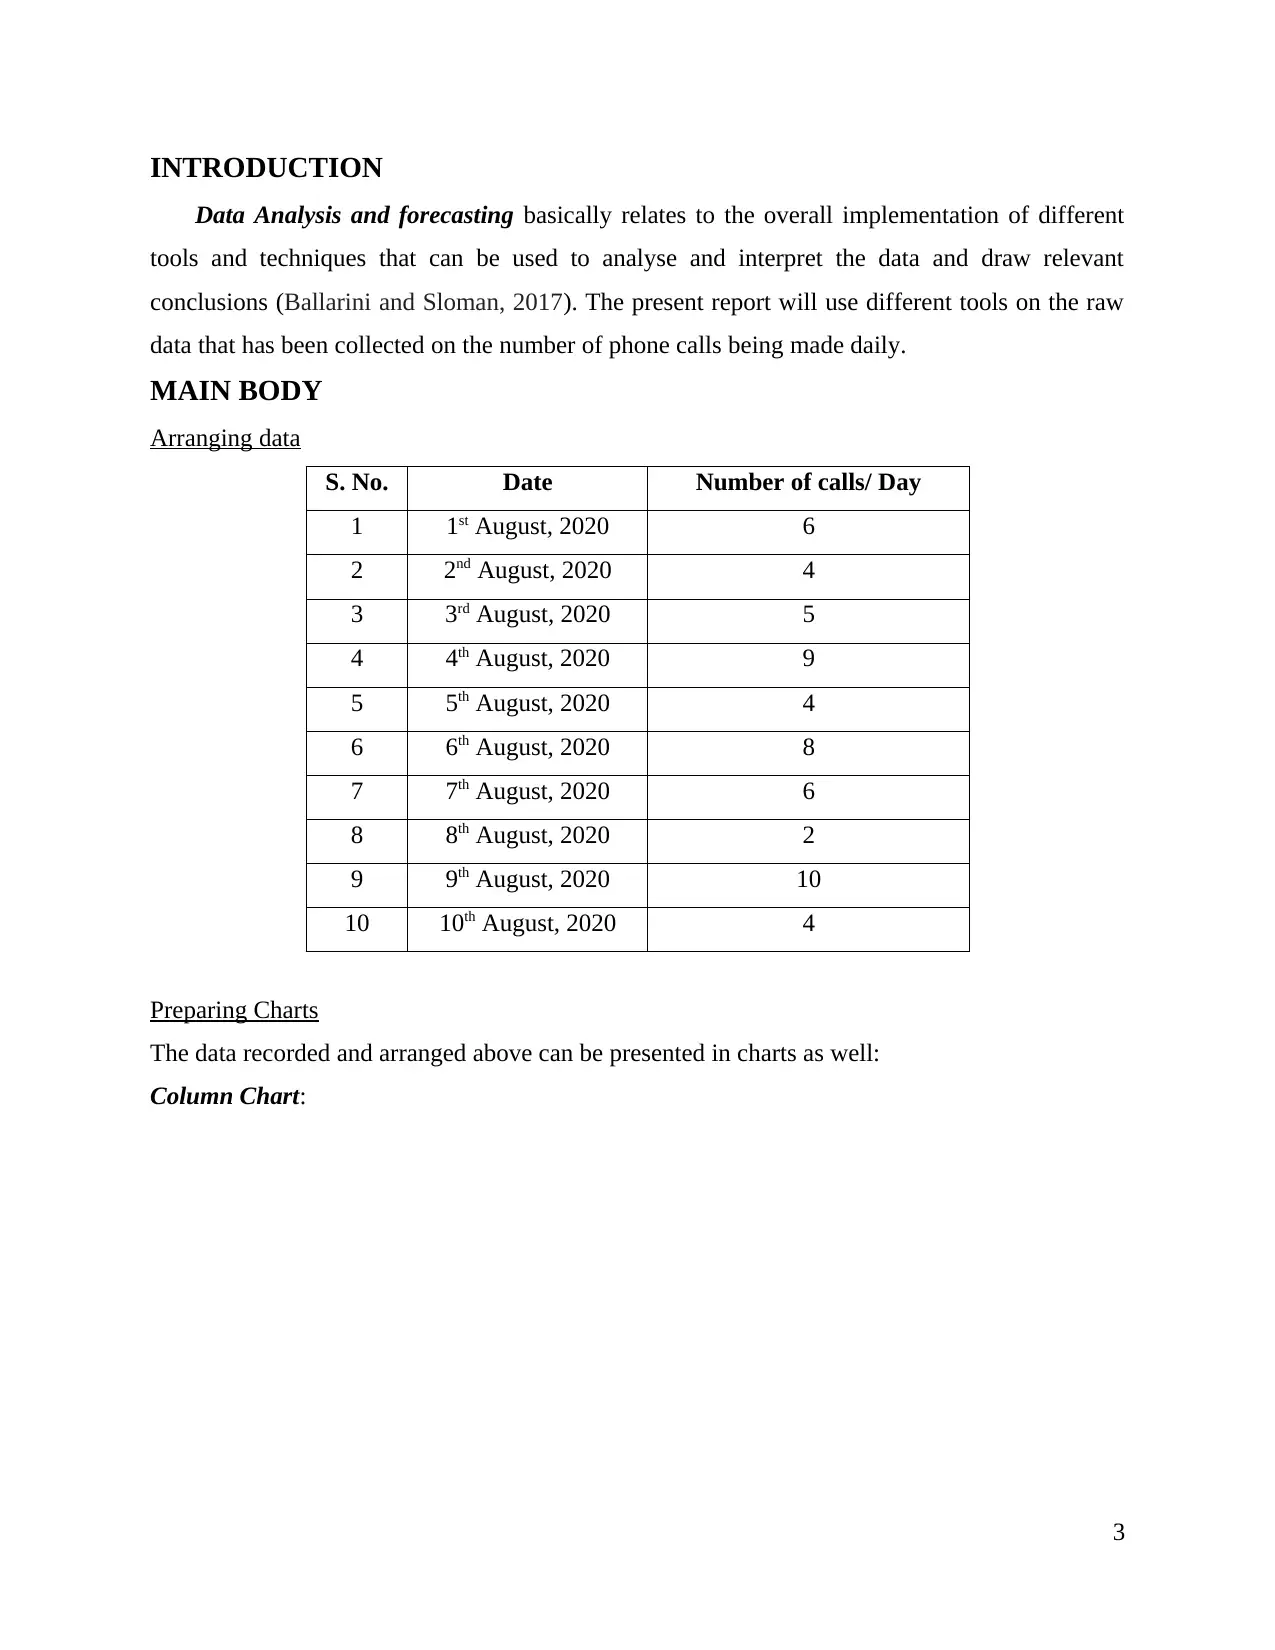
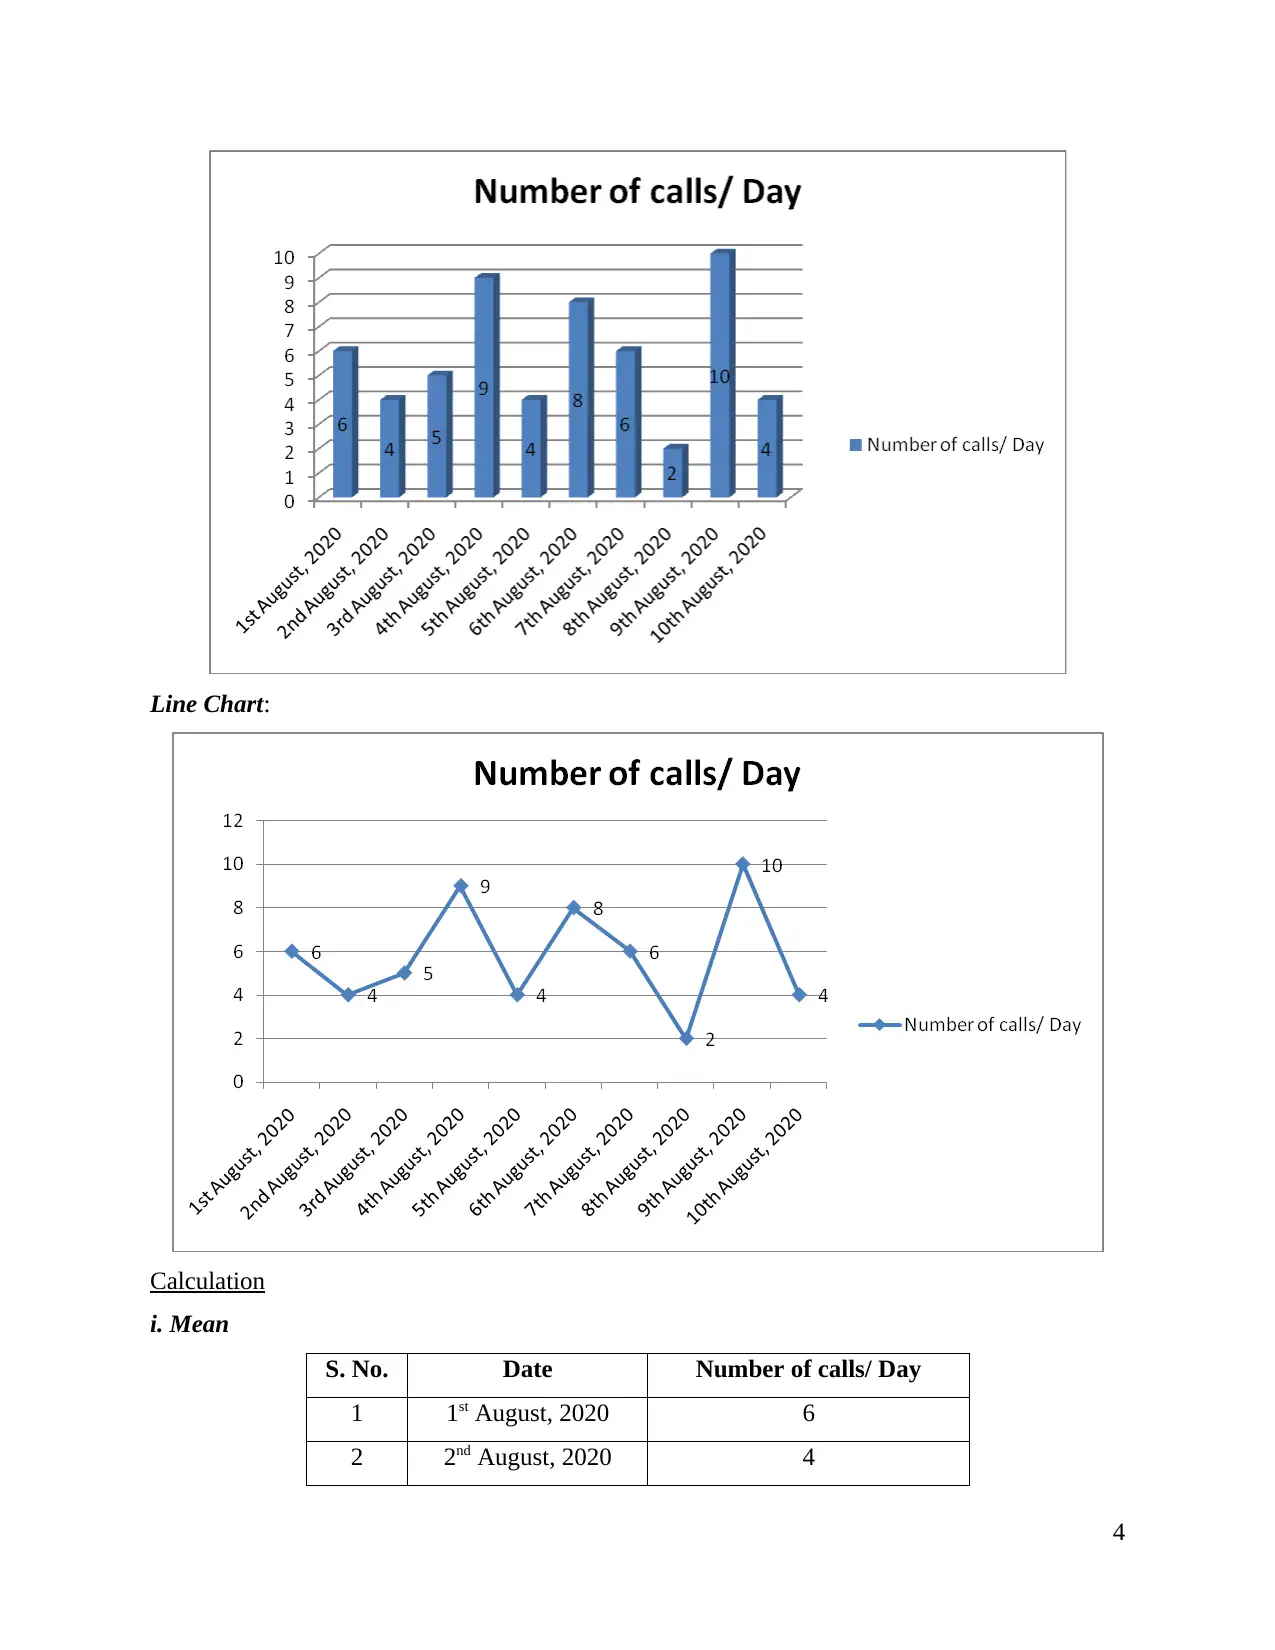
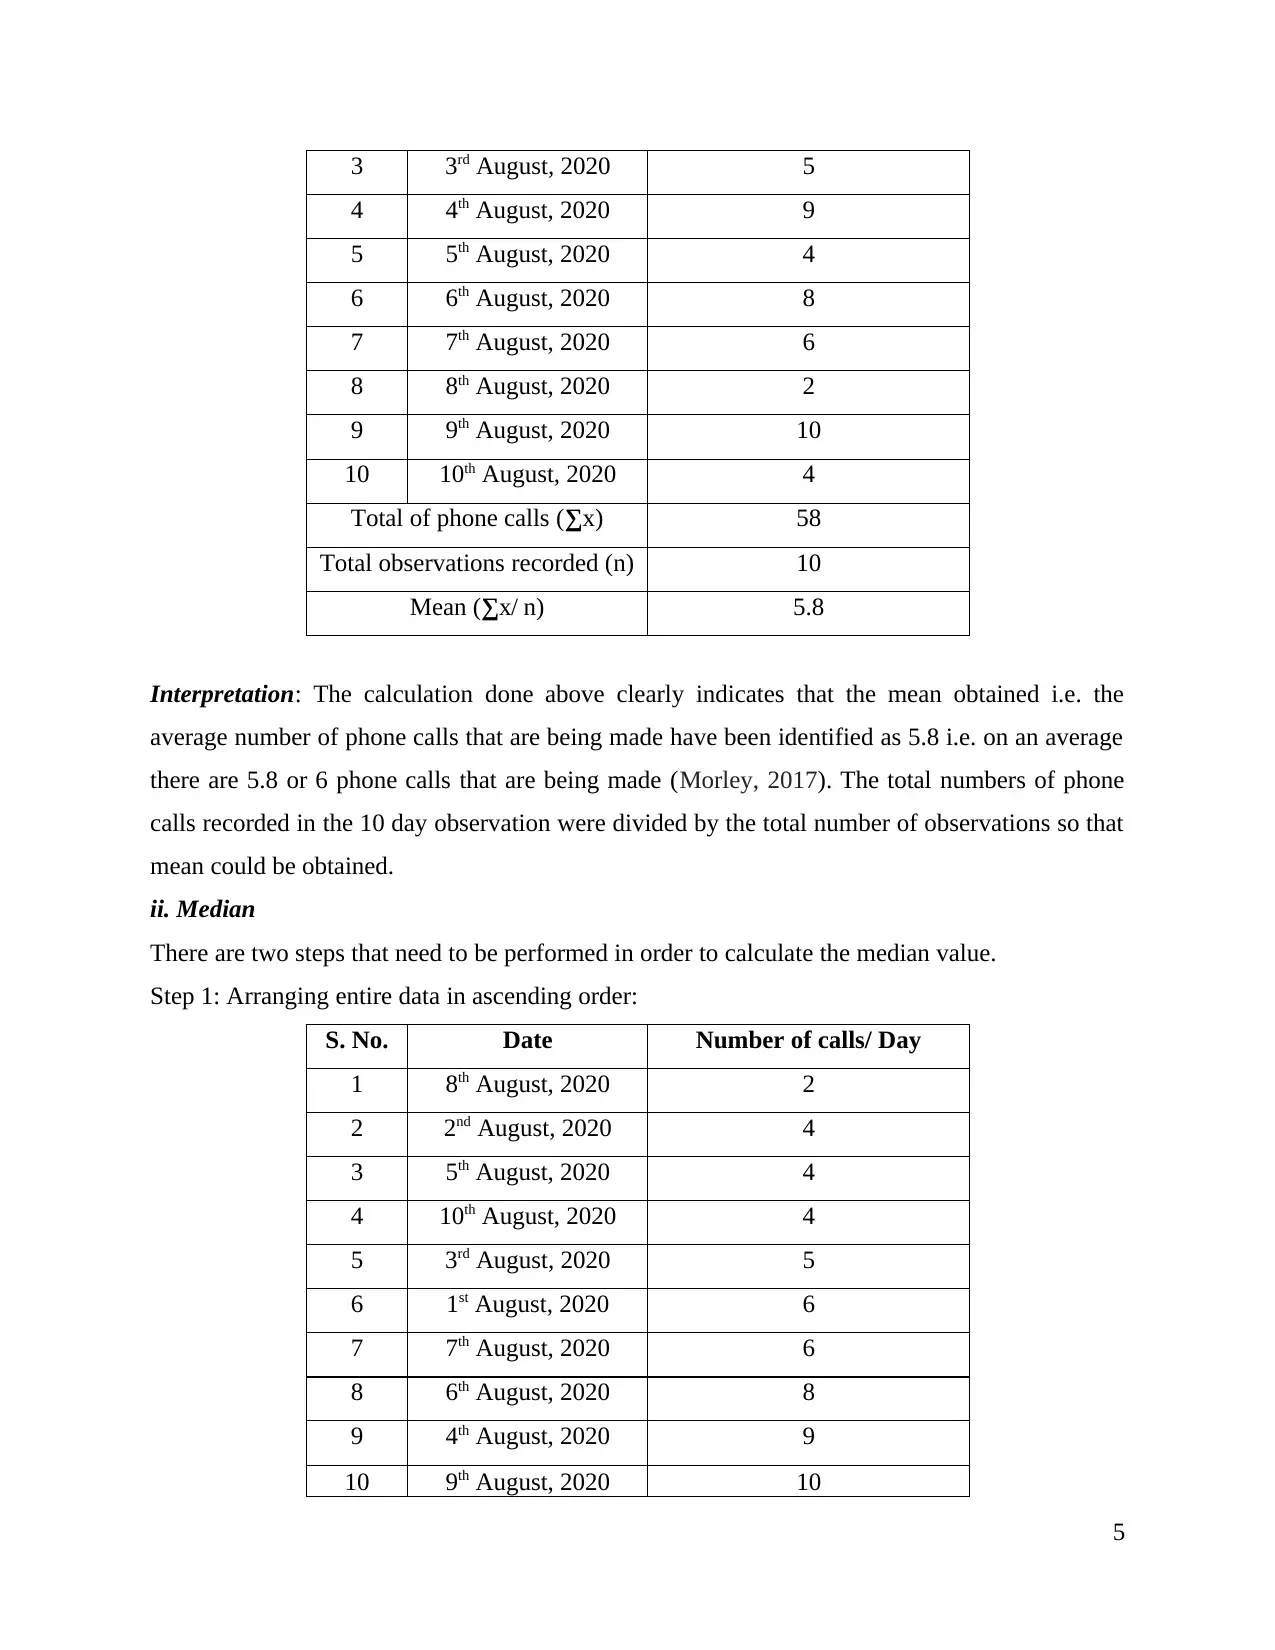
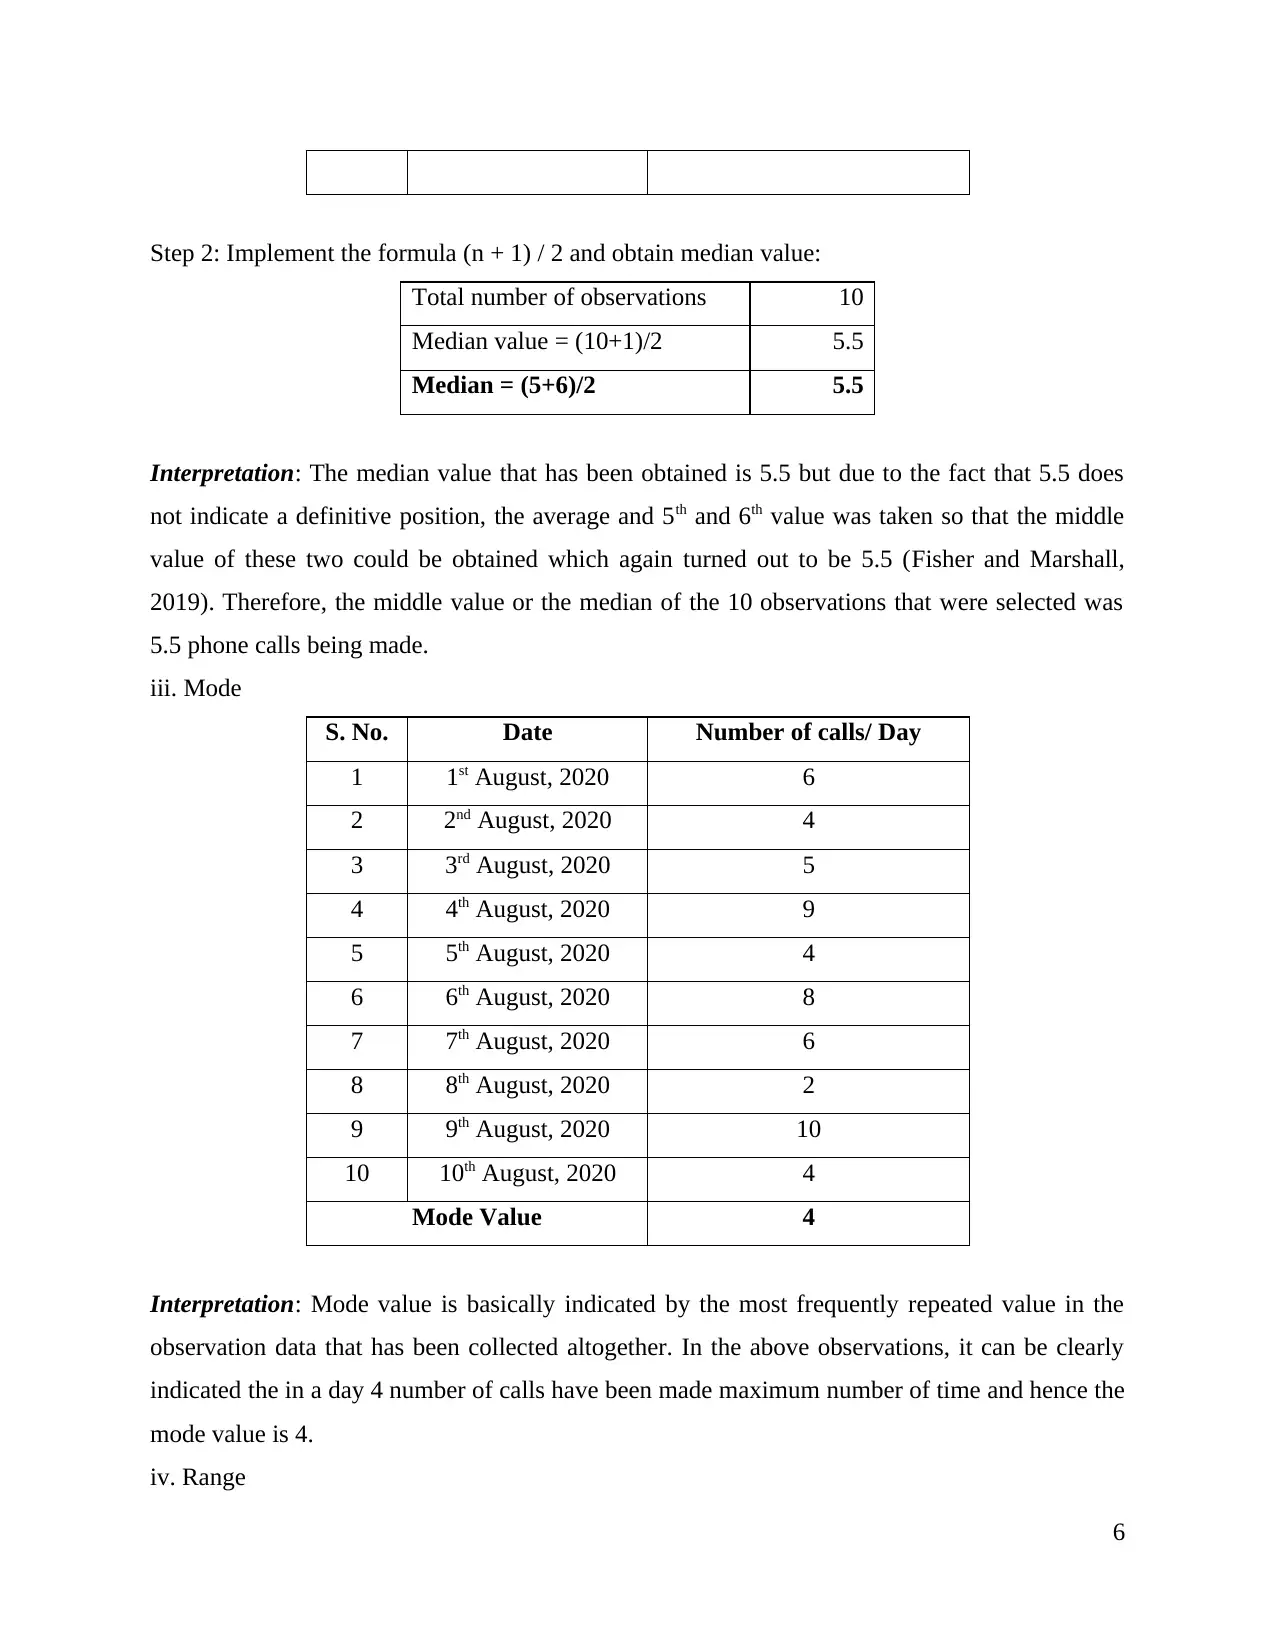
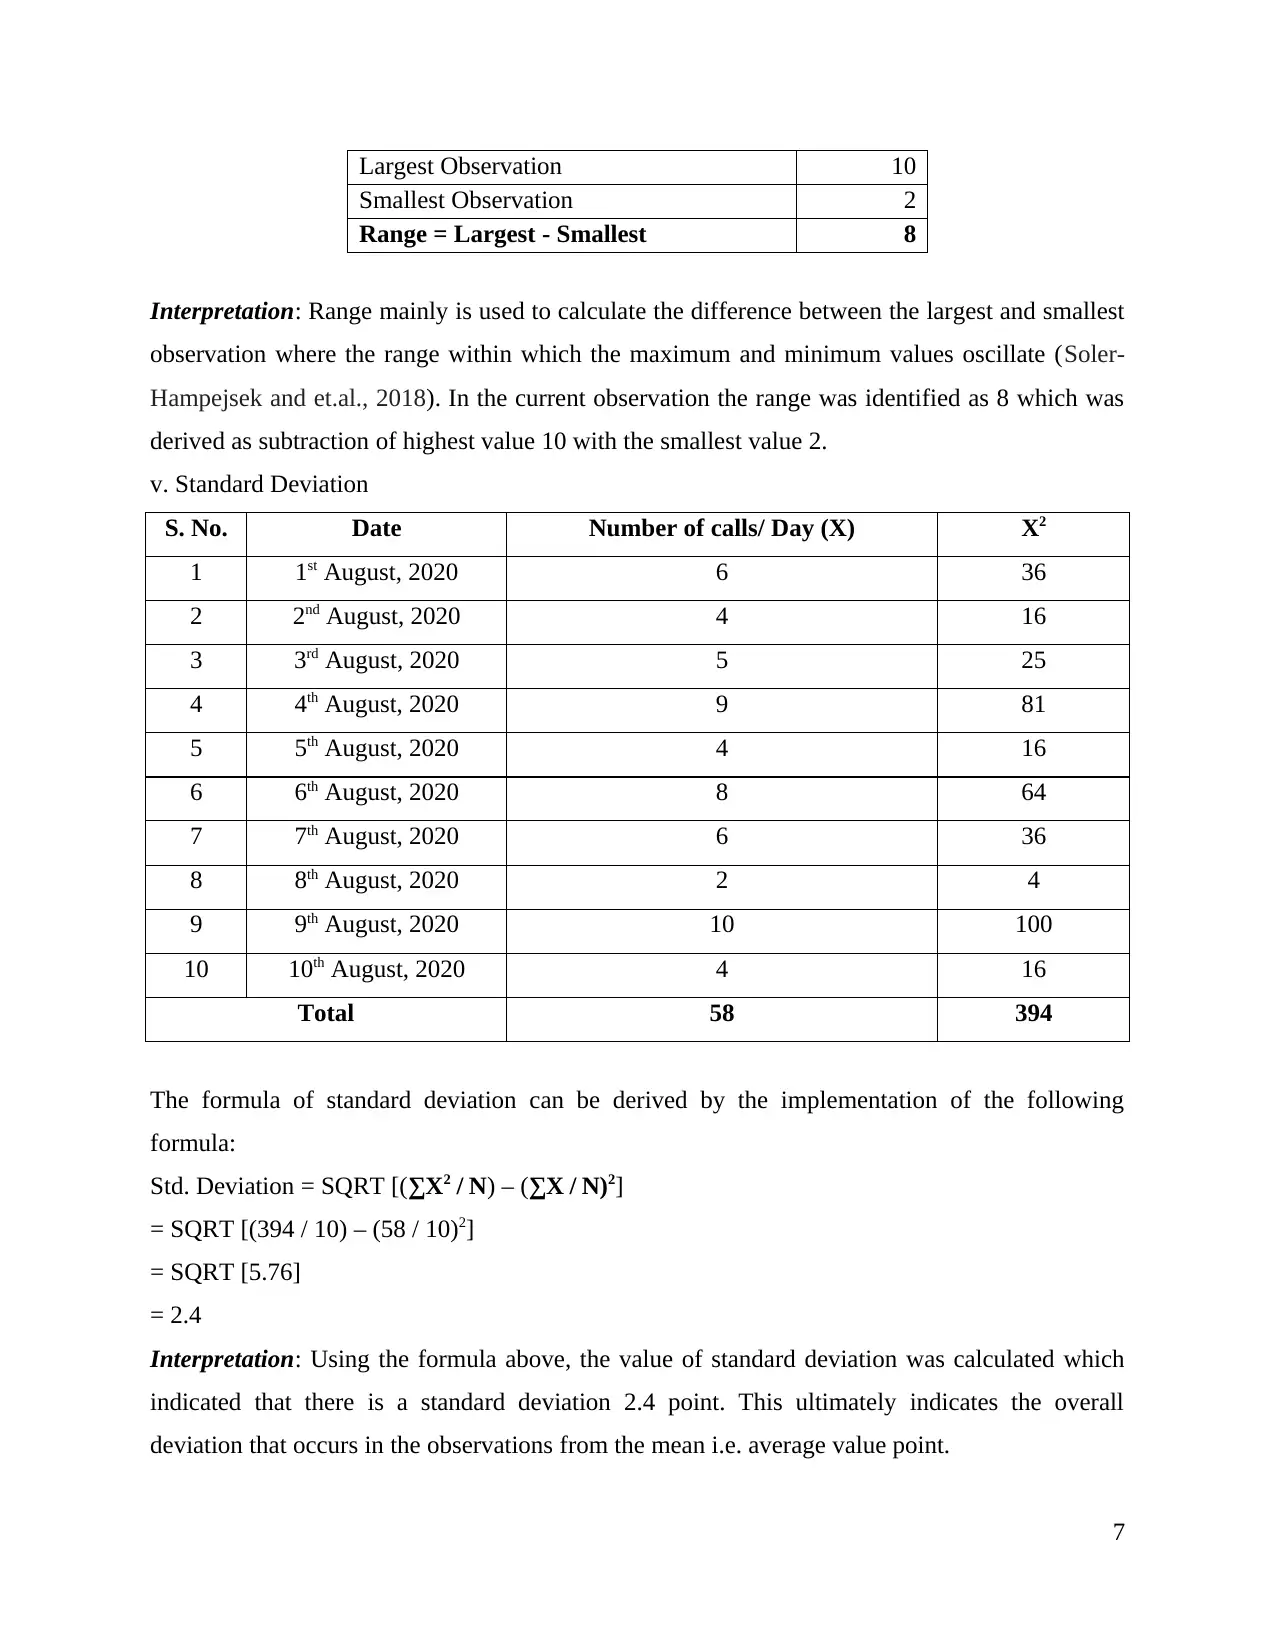
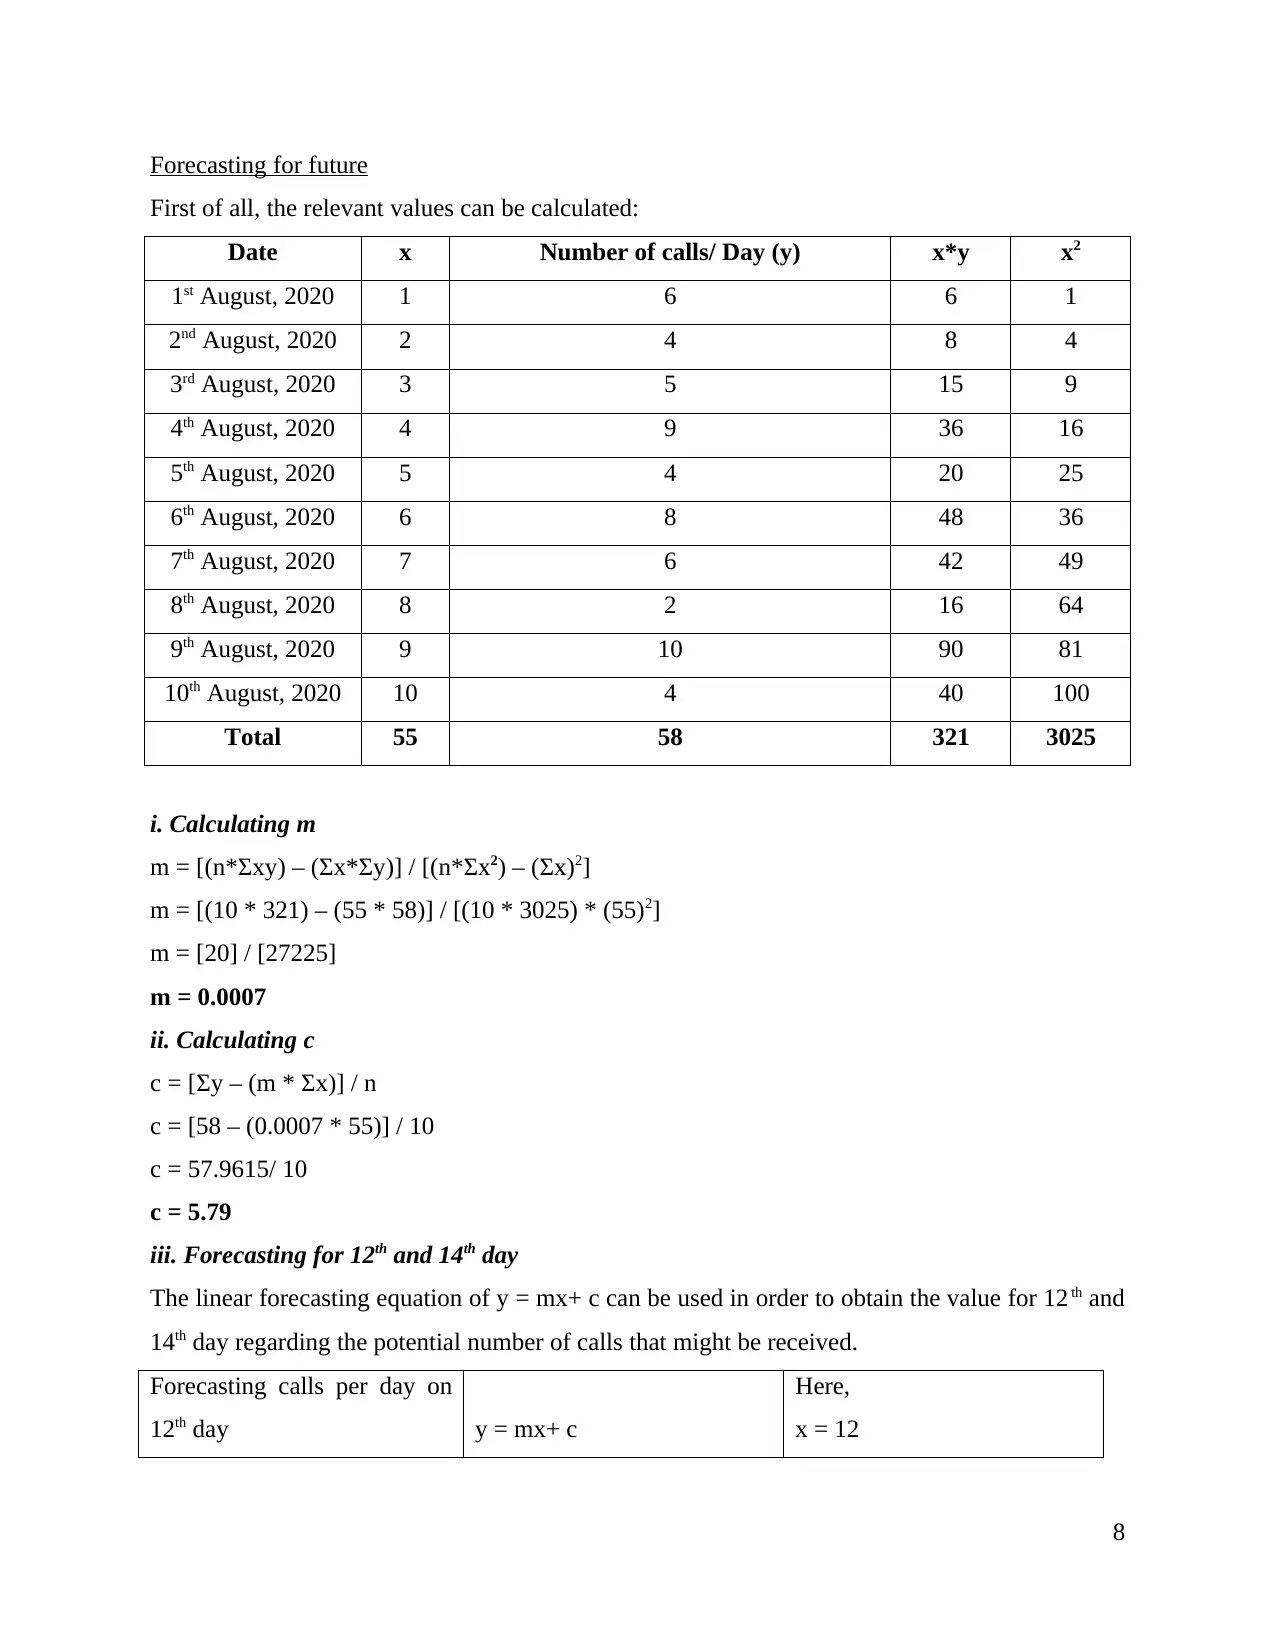
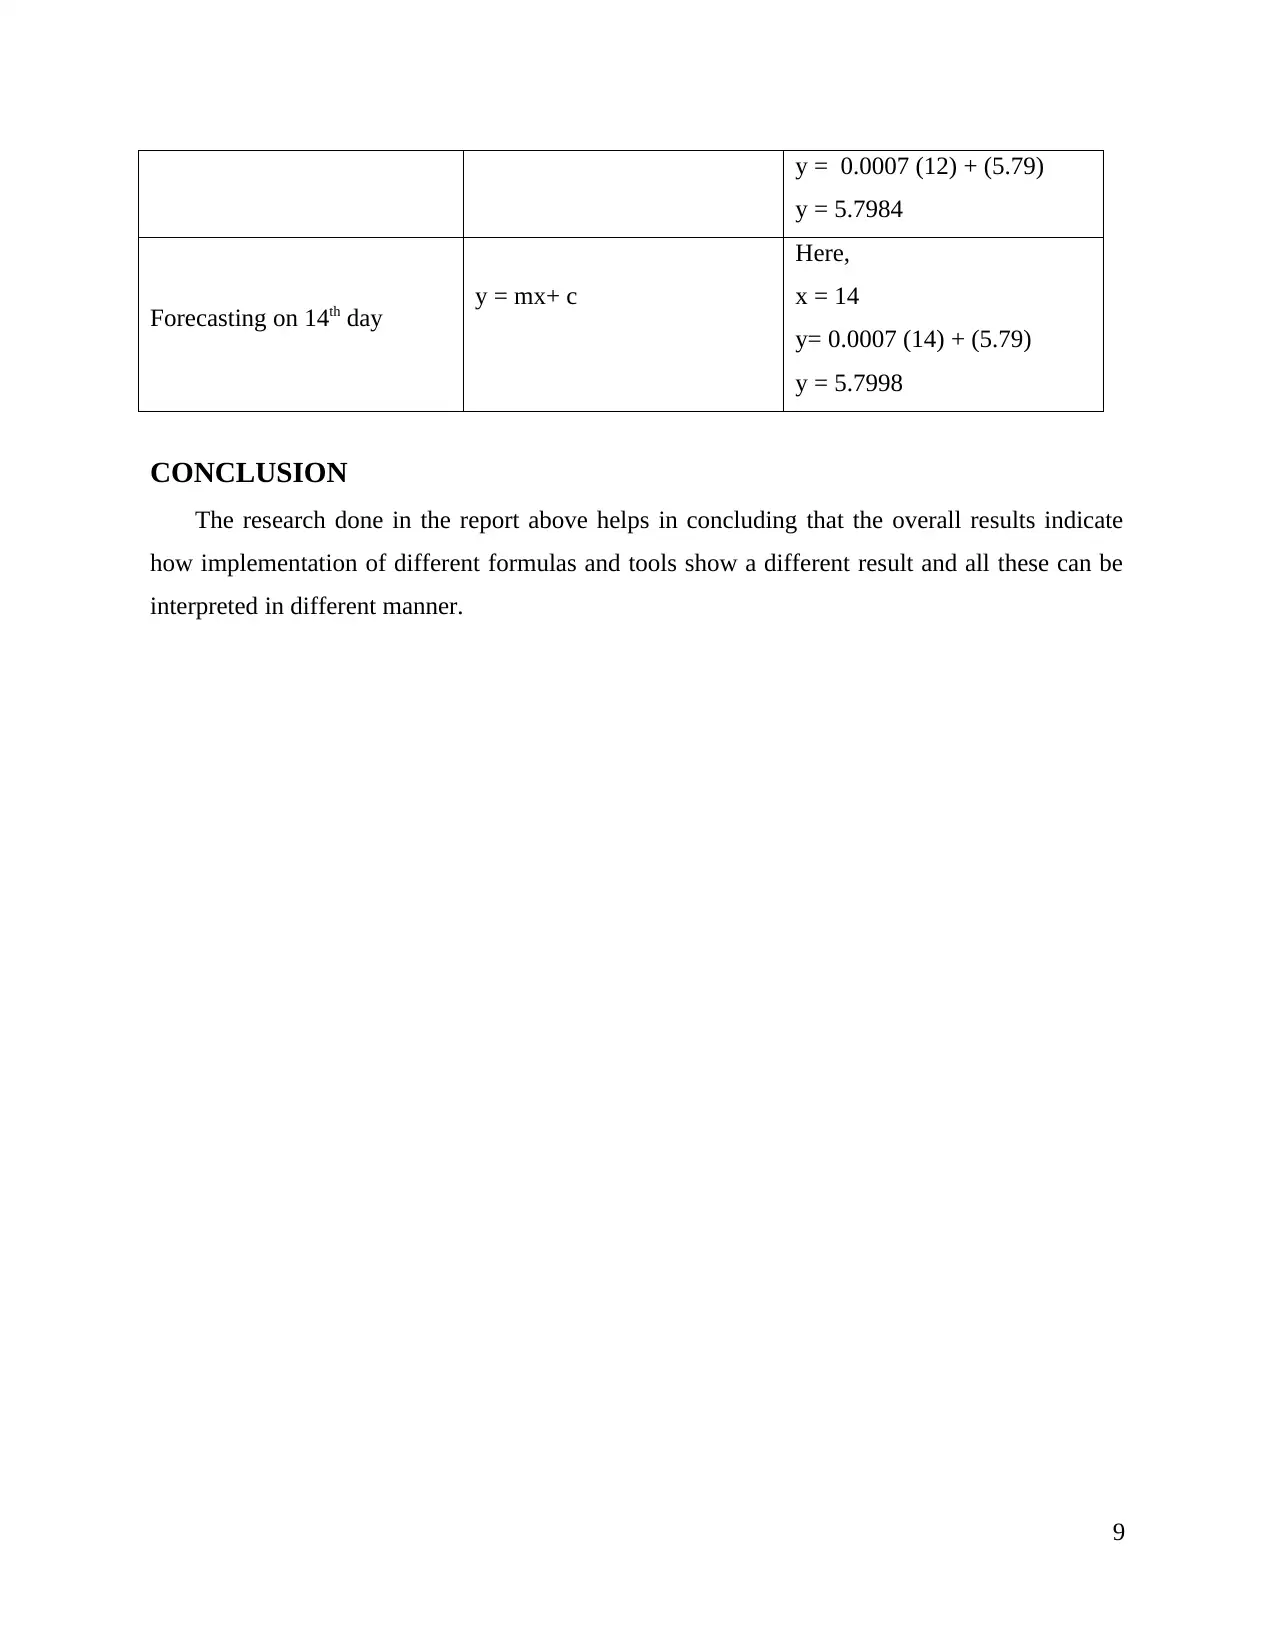
This assignment report provides a detailed analysis of data analysis and forecasting techniques. It begins with arranging data and preparing charts to visualize the dataset of daily phone calls. The main body includes calculations of mean, median, mode, range, and standard deviation to interpret the central tendencies and variability within the data. Furthermore, the report delves into forecasting future trends using linear forecasting equations, predicting the potential number of calls for the 12th and 14th days. The conclusion summarizes the findings, emphasizing the application of various formulas and tools for comprehensive data interpretation. References from books and journals support the analysis.
Document Page
DATA ANALYSIS AND
FORECASTING
tabler-icon-diamond-filled.svg

Secure Best Marks with AI Grader

Need help grading? Try our AI Grader for instant feedback on your assignments.
Document Page
TABLE OF CONTENTS
INTRODUCTION...........................................................................................................................3
MAIN BODY..................................................................................................................................3
Arranging data.............................................................................................................................3
Preparing Charts..........................................................................................................................3
Calculation...................................................................................................................................4
Forecasting for future..................................................................................................................8
CONCLUSION................................................................................................................................9
REFERENCES..............................................................................................................................10
Document Page
INTRODUCTION
Data Analysis and forecasting basically relates to the overall implementation of different
tools and techniques that can be used to analyse and interpret the data and draw relevant
conclusions (Ballarini and Sloman, 2017). The present report will use different tools on the raw
data that has been collected on the number of phone calls being made daily.
MAIN BODY
Arranging data
S. No. Date Number of calls/ Day
1 1st August, 2020 6
2 2nd August, 2020 4
3 3rd August, 2020 5
4 4th August, 2020 9
5 5th August, 2020 4
6 6th August, 2020 8
7 7th August, 2020 6
8 8th August, 2020 2
9 9th August, 2020 10
10 10th August, 2020 4
Preparing Charts
The data recorded and arranged above can be presented in charts as well:
Column Chart:
3
Document Page
Line Chart:
Calculation
i. Mean
S. No. Date Number of calls/ Day
1 1st August, 2020 6
2 2nd August, 2020 4
4
tabler-icon-diamond-filled.svg

Secure Best Marks with AI Grader

Need help grading? Try our AI Grader for instant feedback on your assignments.
Document Page
3 3rd August, 2020 5
4 4th August, 2020 9
5 5th August, 2020 4
6 6th August, 2020 8
7 7th August, 2020 6
8 8th August, 2020 2
9 9th August, 2020 10
10 10th August, 2020 4
Total of phone calls (x) 58
Total observations recorded (n) 10
Mean (x/ n) 5.8
Interpretation: The calculation done above clearly indicates that the mean obtained i.e. the
average number of phone calls that are being made have been identified as 5.8 i.e. on an average
there are 5.8 or 6 phone calls that are being made (Morley, 2017). The total numbers of phone
calls recorded in the 10 day observation were divided by the total number of observations so that
mean could be obtained.
ii. Median
There are two steps that need to be performed in order to calculate the median value.
Step 1: Arranging entire data in ascending order:
S. No. Date Number of calls/ Day
1 8th August, 2020 2
2 2nd August, 2020 4
3 5th August, 2020 4
4 10th August, 2020 4
5 3rd August, 2020 5
6 1st August, 2020 6
7 7th August, 2020 6
8 6th August, 2020 8
9 4th August, 2020 9
10 9th August, 2020 10
5
Document Page
Step 2: Implement the formula (n + 1) / 2 and obtain median value:
Total number of observations 10
Median value = (10+1)/2 5.5
Median = (5+6)/2 5.5
Interpretation: The median value that has been obtained is 5.5 but due to the fact that 5.5 does
not indicate a definitive position, the average and 5th and 6th value was taken so that the middle
value of these two could be obtained which again turned out to be 5.5 (Fisher and Marshall,
2019). Therefore, the middle value or the median of the 10 observations that were selected was
5.5 phone calls being made.
iii. Mode
S. No. Date Number of calls/ Day
1 1st August, 2020 6
2 2nd August, 2020 4
3 3rd August, 2020 5
4 4th August, 2020 9
5 5th August, 2020 4
6 6th August, 2020 8
7 7th August, 2020 6
8 8th August, 2020 2
9 9th August, 2020 10
10 10th August, 2020 4
Mode Value 4
Interpretation: Mode value is basically indicated by the most frequently repeated value in the
observation data that has been collected altogether. In the above observations, it can be clearly
indicated the in a day 4 number of calls have been made maximum number of time and hence the
mode value is 4.
iv. Range
6
Document Page
Largest Observation 10
Smallest Observation 2
Range = Largest - Smallest 8
Interpretation: Range mainly is used to calculate the difference between the largest and smallest
observation where the range within which the maximum and minimum values oscillate (Soler-
Hampejsek and et.al., 2018). In the current observation the range was identified as 8 which was
derived as subtraction of highest value 10 with the smallest value 2.
v. Standard Deviation
S. No. Date Number of calls/ Day (X) X2
1 1st August, 2020 6 36
2 2nd August, 2020 4 16
3 3rd August, 2020 5 25
4 4th August, 2020 9 81
5 5th August, 2020 4 16
6 6th August, 2020 8 64
7 7th August, 2020 6 36
8 8th August, 2020 2 4
9 9th August, 2020 10 100
10 10th August, 2020 4 16
Total 58 394
The formula of standard deviation can be derived by the implementation of the following
formula:
Std. Deviation = SQRT [(∑X2 / N) – (∑X / N)2]
= SQRT [(394 / 10) – (58 / 10)2]
= SQRT [5.76]
= 2.4
Interpretation: Using the formula above, the value of standard deviation was calculated which
indicated that there is a standard deviation 2.4 point. This ultimately indicates the overall
deviation that occurs in the observations from the mean i.e. average value point.
7
tabler-icon-diamond-filled.svg

Paraphrase This Document

Need a fresh take? Get an instant paraphrase of this document with our AI Paraphraser
Document Page
Forecasting for future
First of all, the relevant values can be calculated:
Date x Number of calls/ Day (y) x*y x2
1st August, 2020 1 6 6 1
2nd August, 2020 2 4 8 4
3rd August, 2020 3 5 15 9
4th August, 2020 4 9 36 16
5th August, 2020 5 4 20 25
6th August, 2020 6 8 48 36
7th August, 2020 7 6 42 49
8th August, 2020 8 2 16 64
9th August, 2020 9 10 90 81
10th August, 2020 10 4 40 100
Total 55 58 321 3025
i. Calculating m
m = [(n*Σxy) – (Σx*Σy)] / [(n*Σx2) – (Σx)2]
m = [(10 * 321) – (55 * 58)] / [(10 * 3025) * (55)2]
m = [20] / [27225]
m = 0.0007
ii. Calculating c
c = [Σy – (m * Σx)] / n
c = [58 – (0.0007 * 55)] / 10
c = 57.9615/ 10
c = 5.79
iii. Forecasting for 12th and 14th day
The linear forecasting equation of y = mx+ c can be used in order to obtain the value for 12 th and
14th day regarding the potential number of calls that might be received.
Forecasting calls per day on
12th day y = mx+ c
Here,
x = 12
8
Document Page
y = 0.0007 (12) + (5.79)
y = 5.7984
Forecasting on 14th day y = mx+ c
Here,
x = 14
y= 0.0007 (14) + (5.79)
y = 5.7998
CONCLUSION
The research done in the report above helps in concluding that the overall results indicate
how implementation of different formulas and tools show a different result and all these can be
interpreted in different manner.
9
Document Page
REFERENCES
Books and Journals
Fisher, M. J. and Marshall, A. P., 2019. Understanding descriptive statistics. Australian Critical
Care. 22(2). pp.93-97.
Morley, P., 2017. An analysis of large-Scale numeracy assessment data in Australia (Doctoral
dissertation, Monash University).
Ballarini, C. and Sloman, S.A., 2017. Reasons and the “motivated numeracy effect.”.
In Proceedings of the 39th annual meeting of the Cognitive Science Society (pp. 1580-
1585).
Soler-Hampejsek, E., and et.al., 2018. Reading and numeracy skills after school leaving in
southern Malawi: A longitudinal analysis. International Journal of Educational
Development, 59. pp.86-99.
10
tabler-icon-diamond-filled.svg

Secure Best Marks with AI Grader

Need help grading? Try our AI Grader for instant feedback on your assignments.
Document Page
11
chevron_up_icon
1 out of 11
circle_padding
hide_on_mobile
zoom_out_icon
logo.png

Your All-in-One AI-Powered Toolkit for Academic Success.

Available 24*7 on WhatsApp / Email

[object Object]