Data Analysis and Forecasting - LSC Numeracy and Data Analysis BABS

Verified

Added on  2023/06/10

|8
|902
|74
Homework Assignment
AI Summary
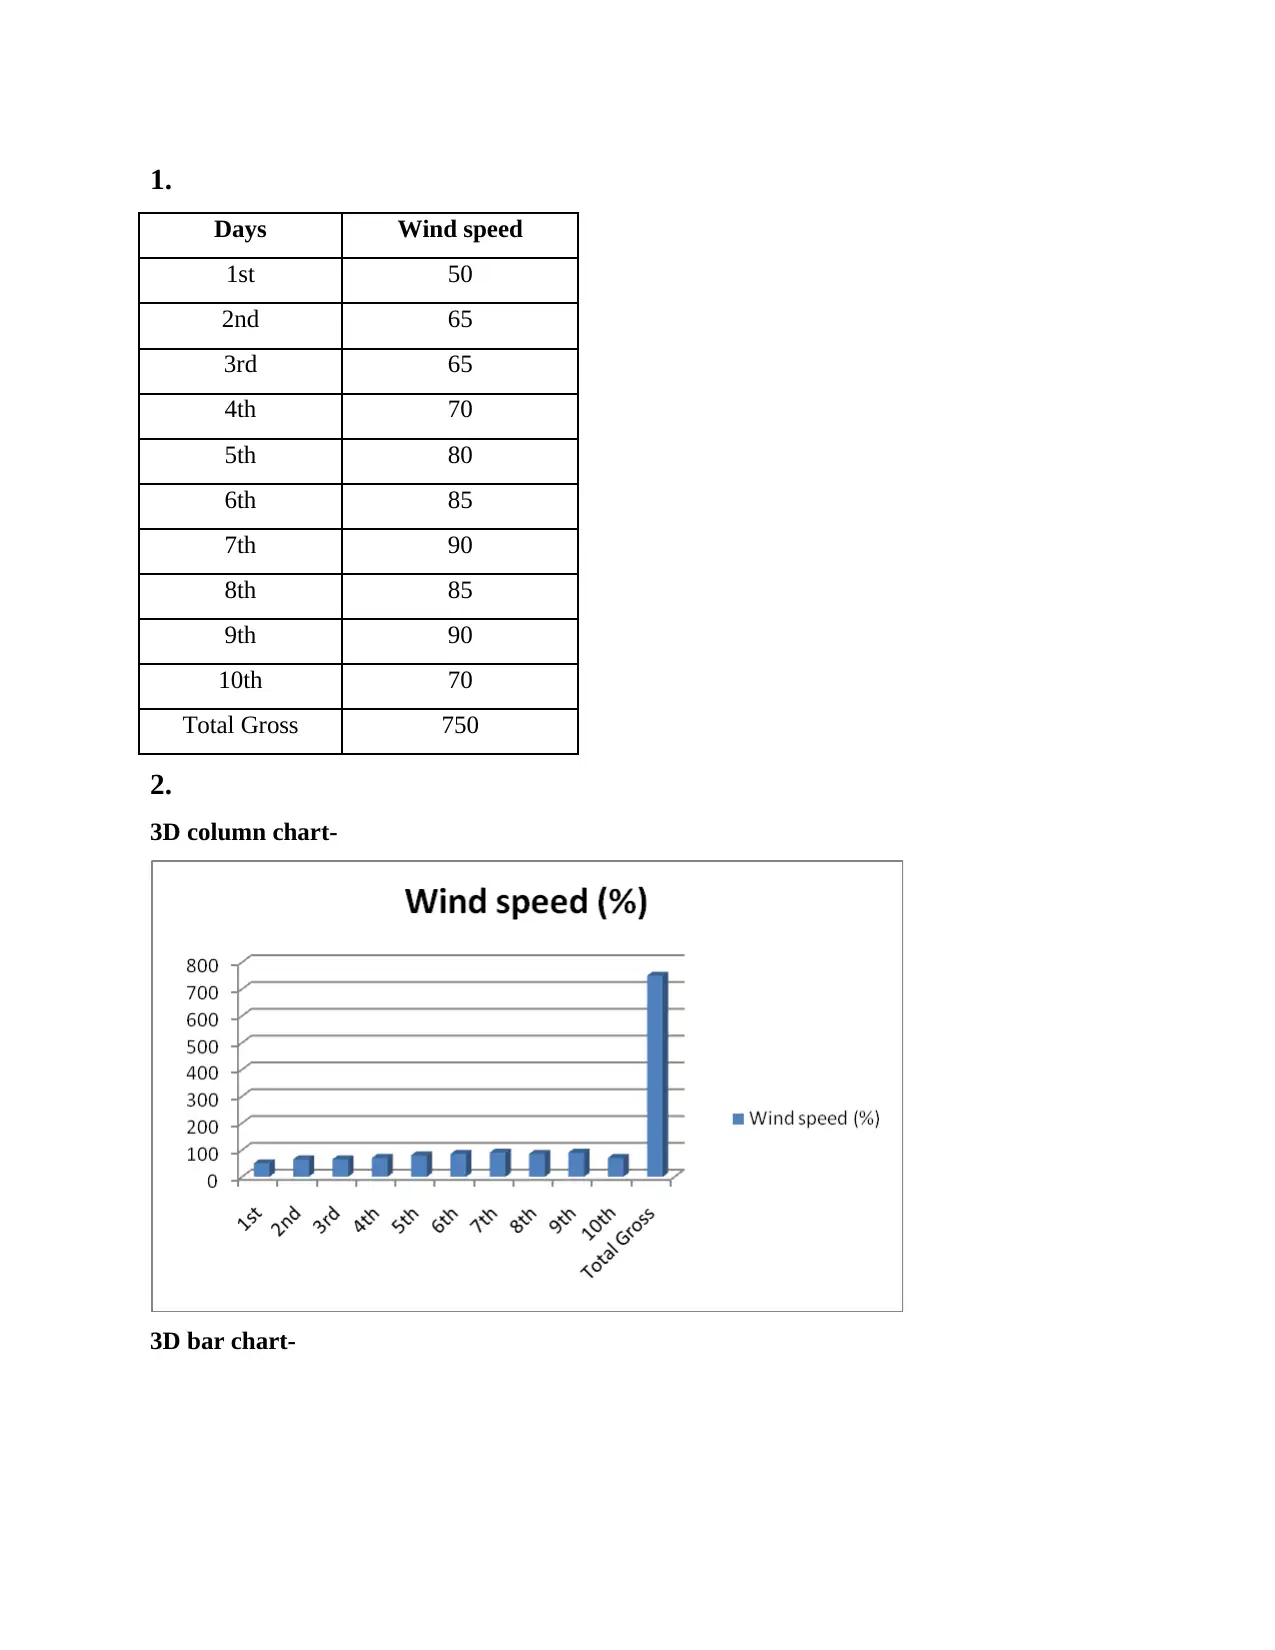
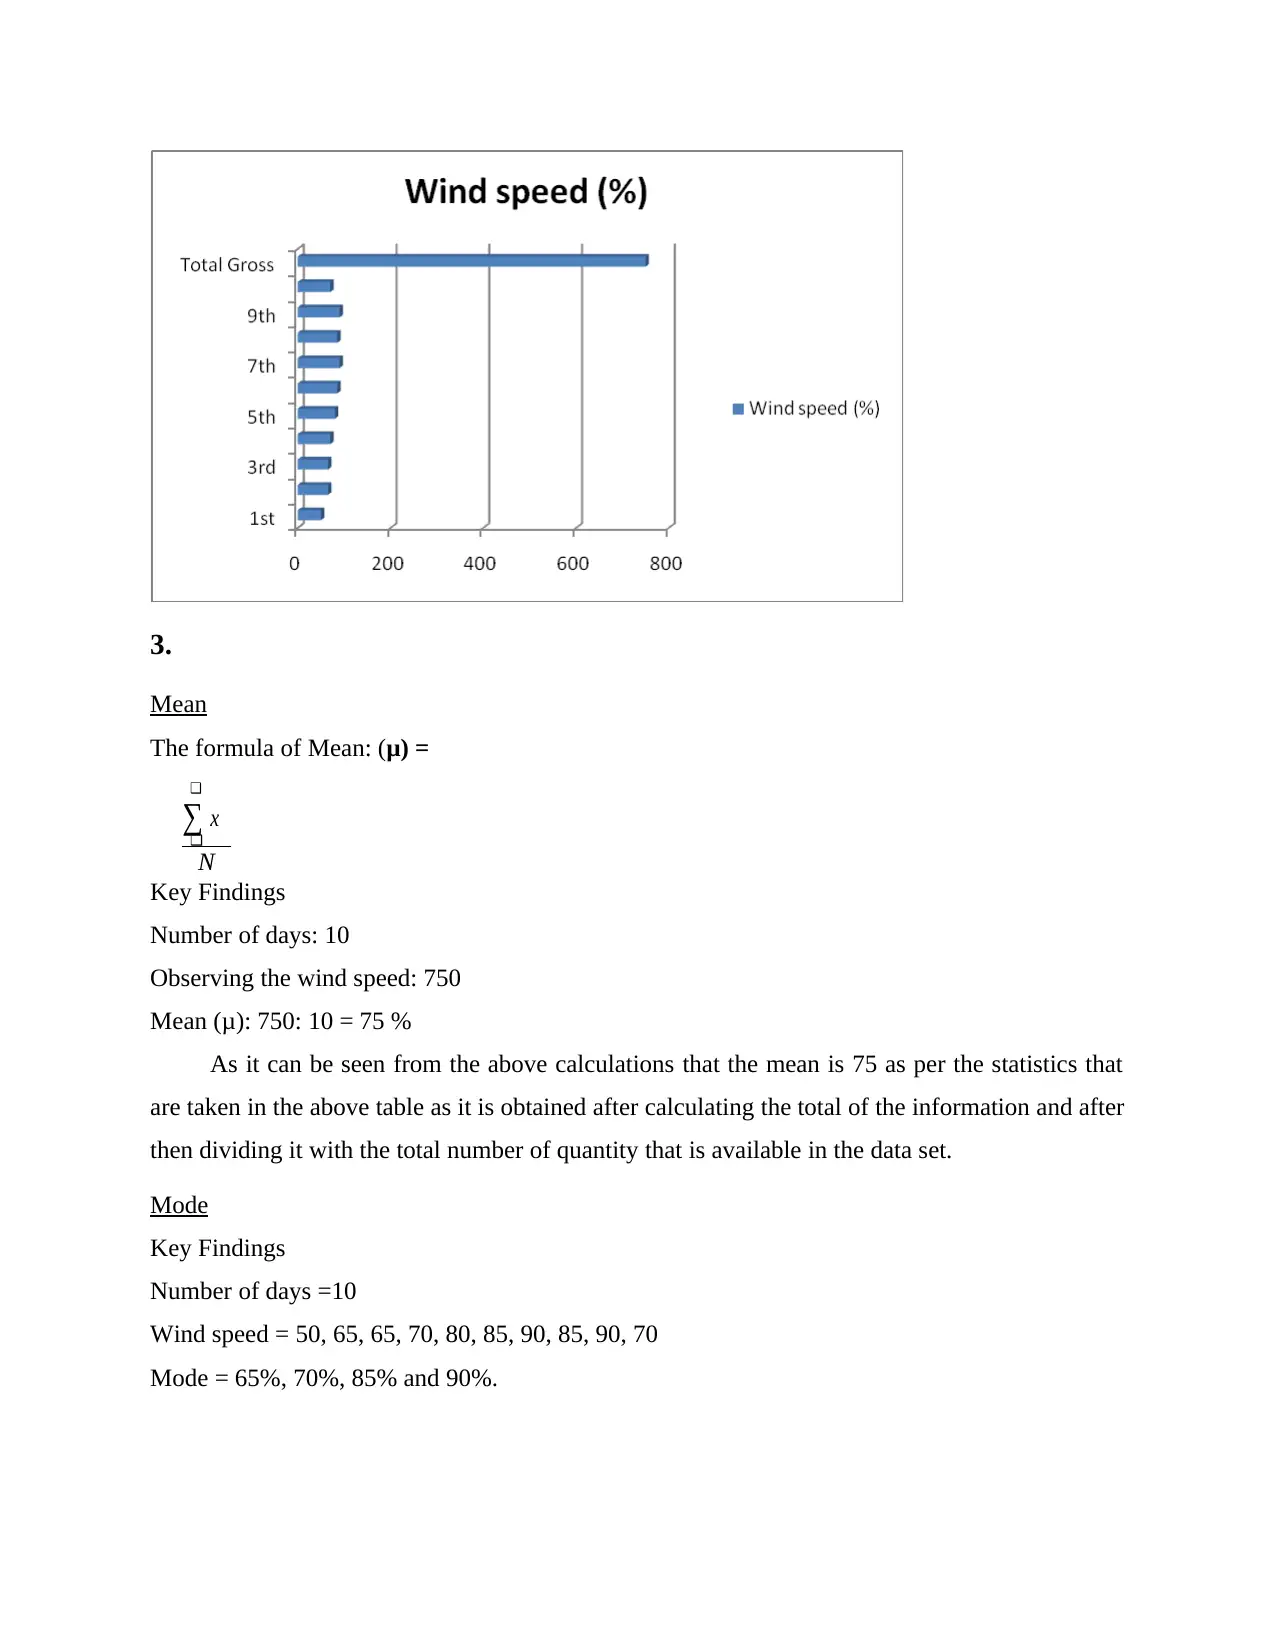
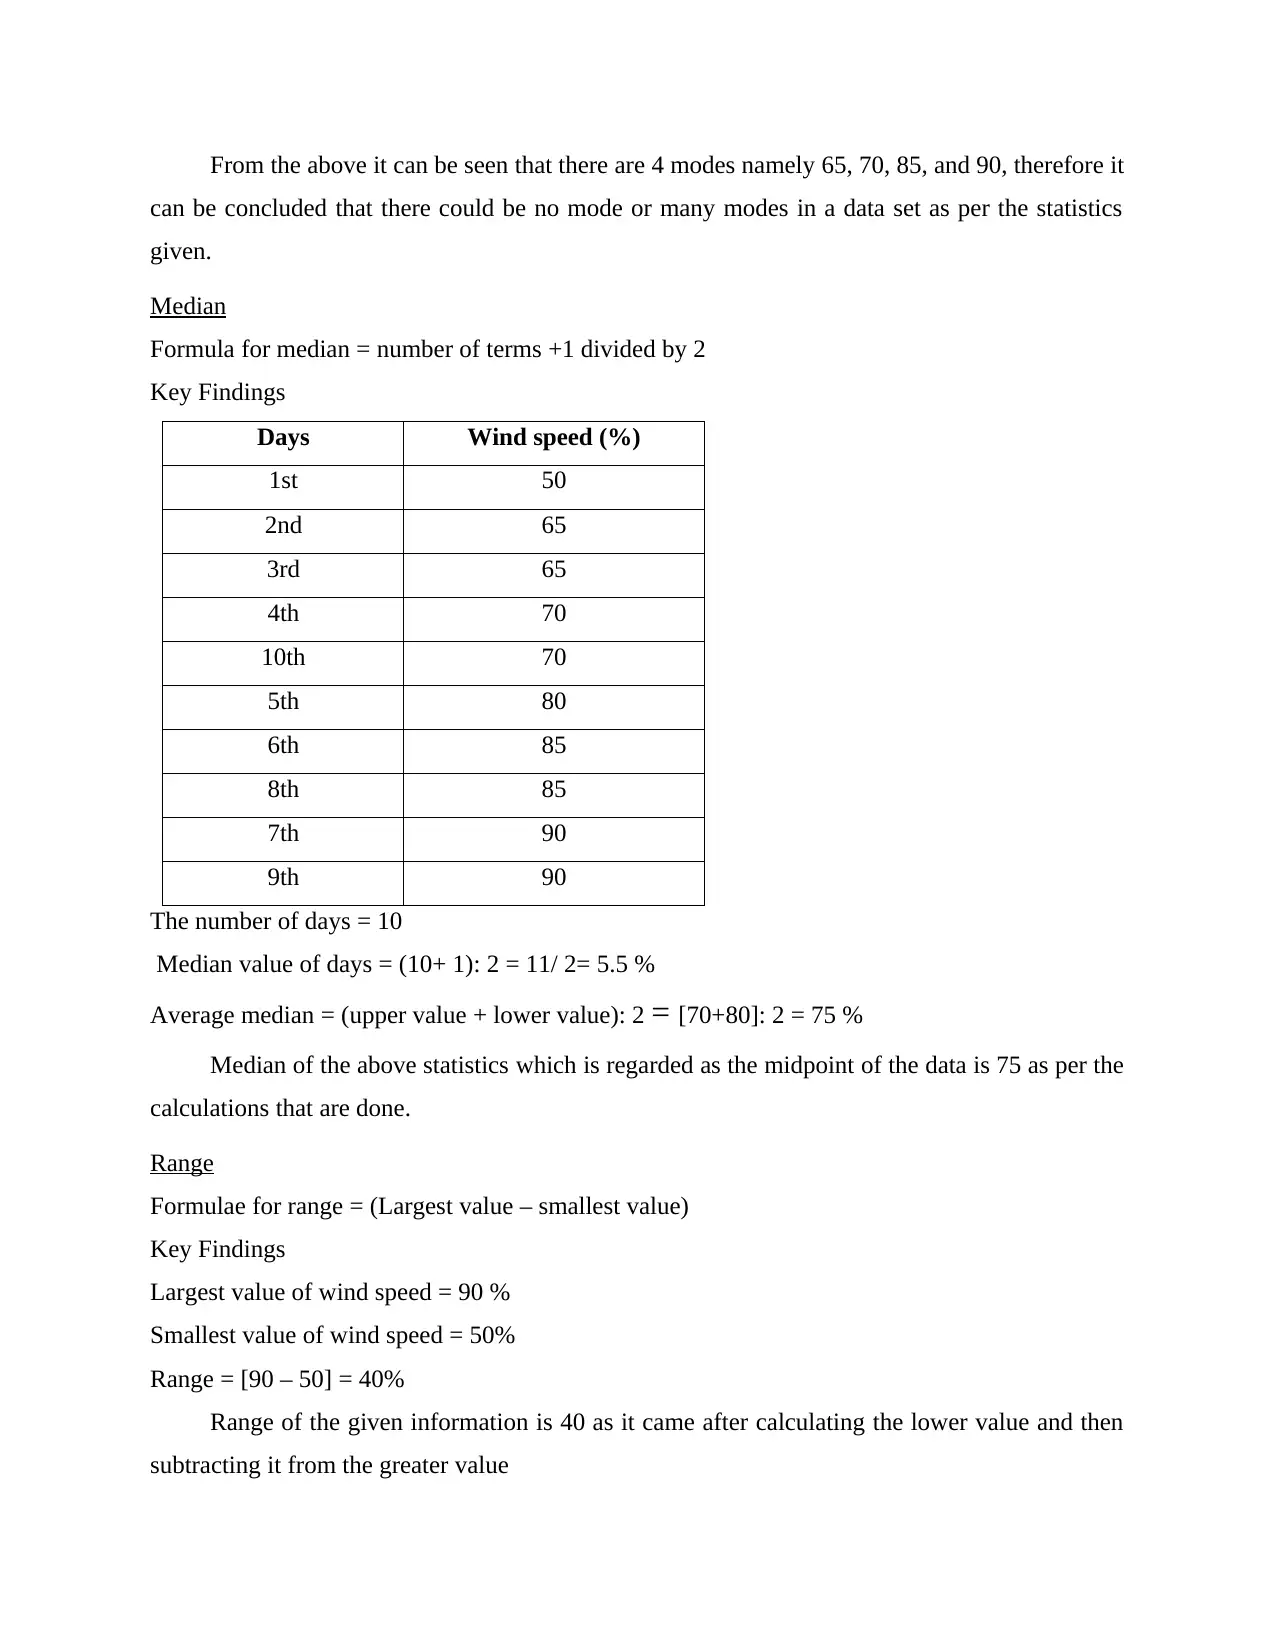
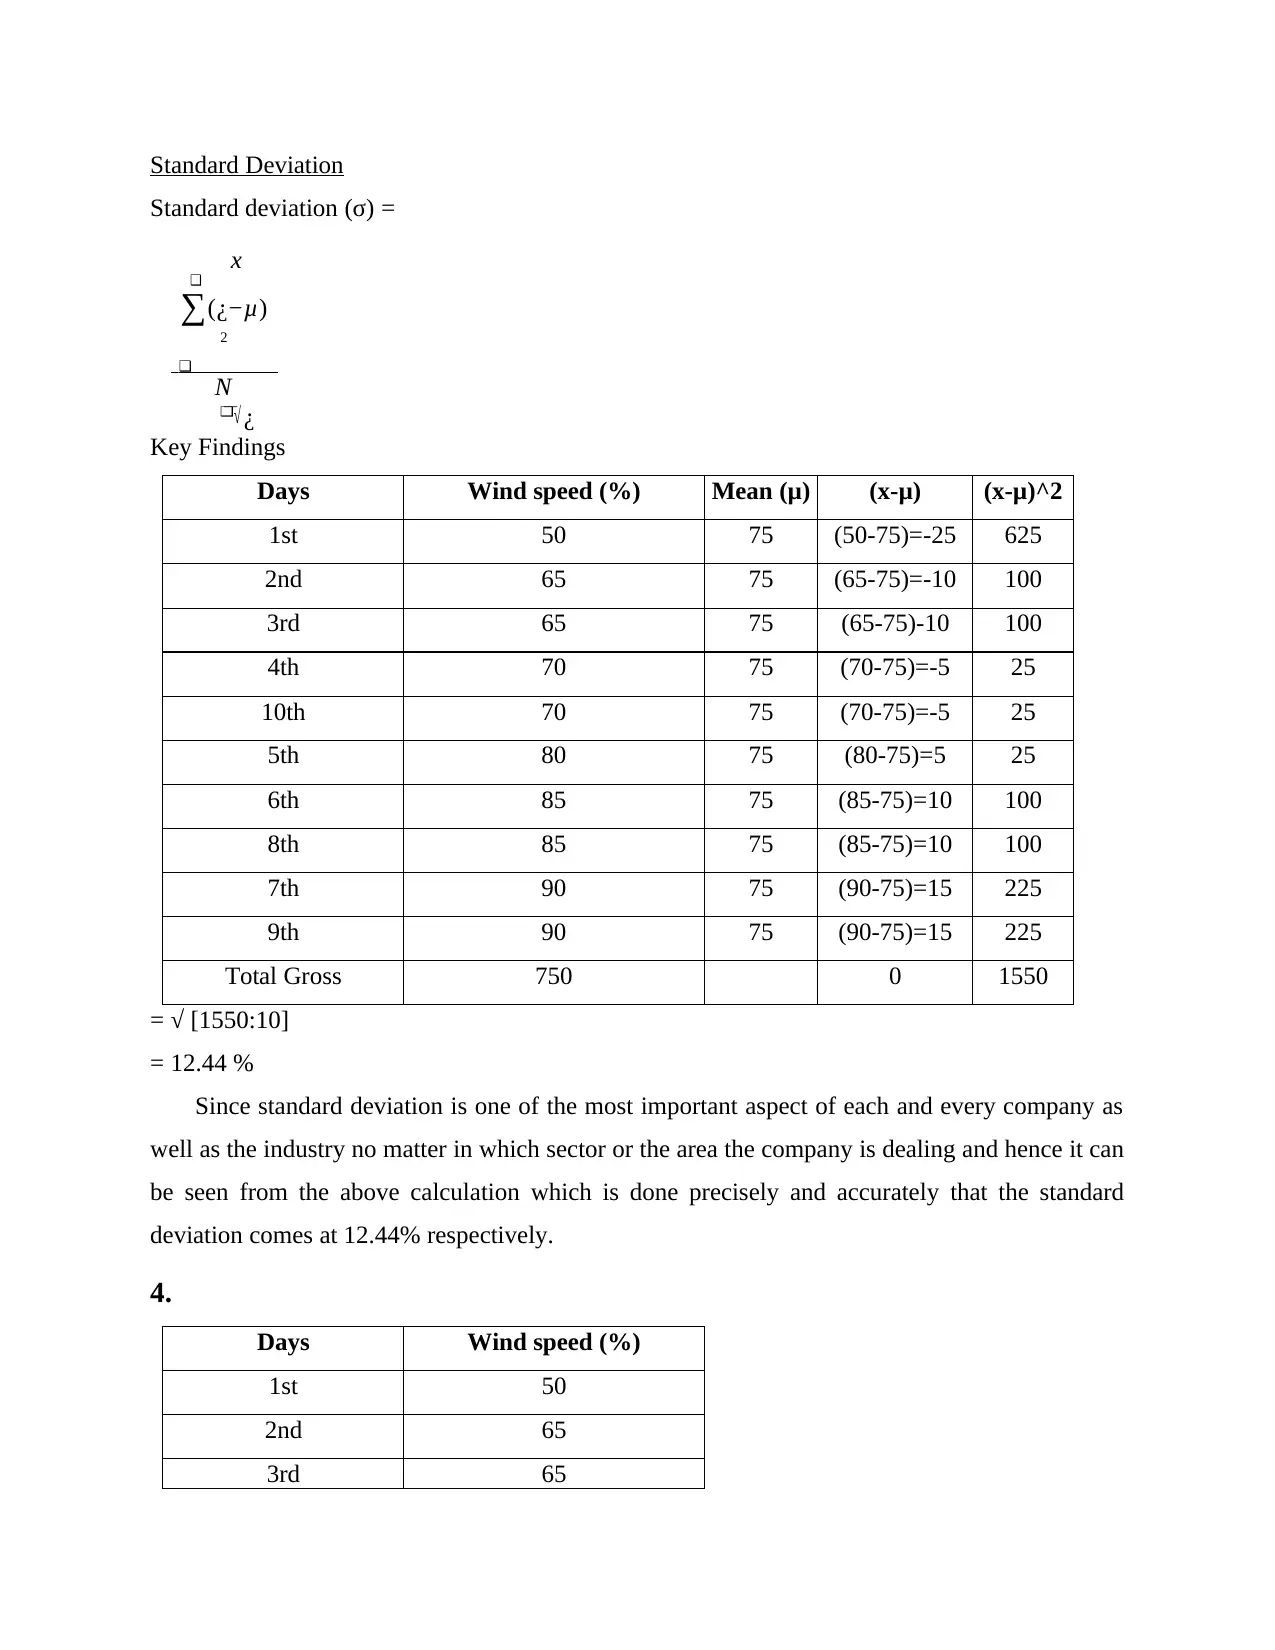
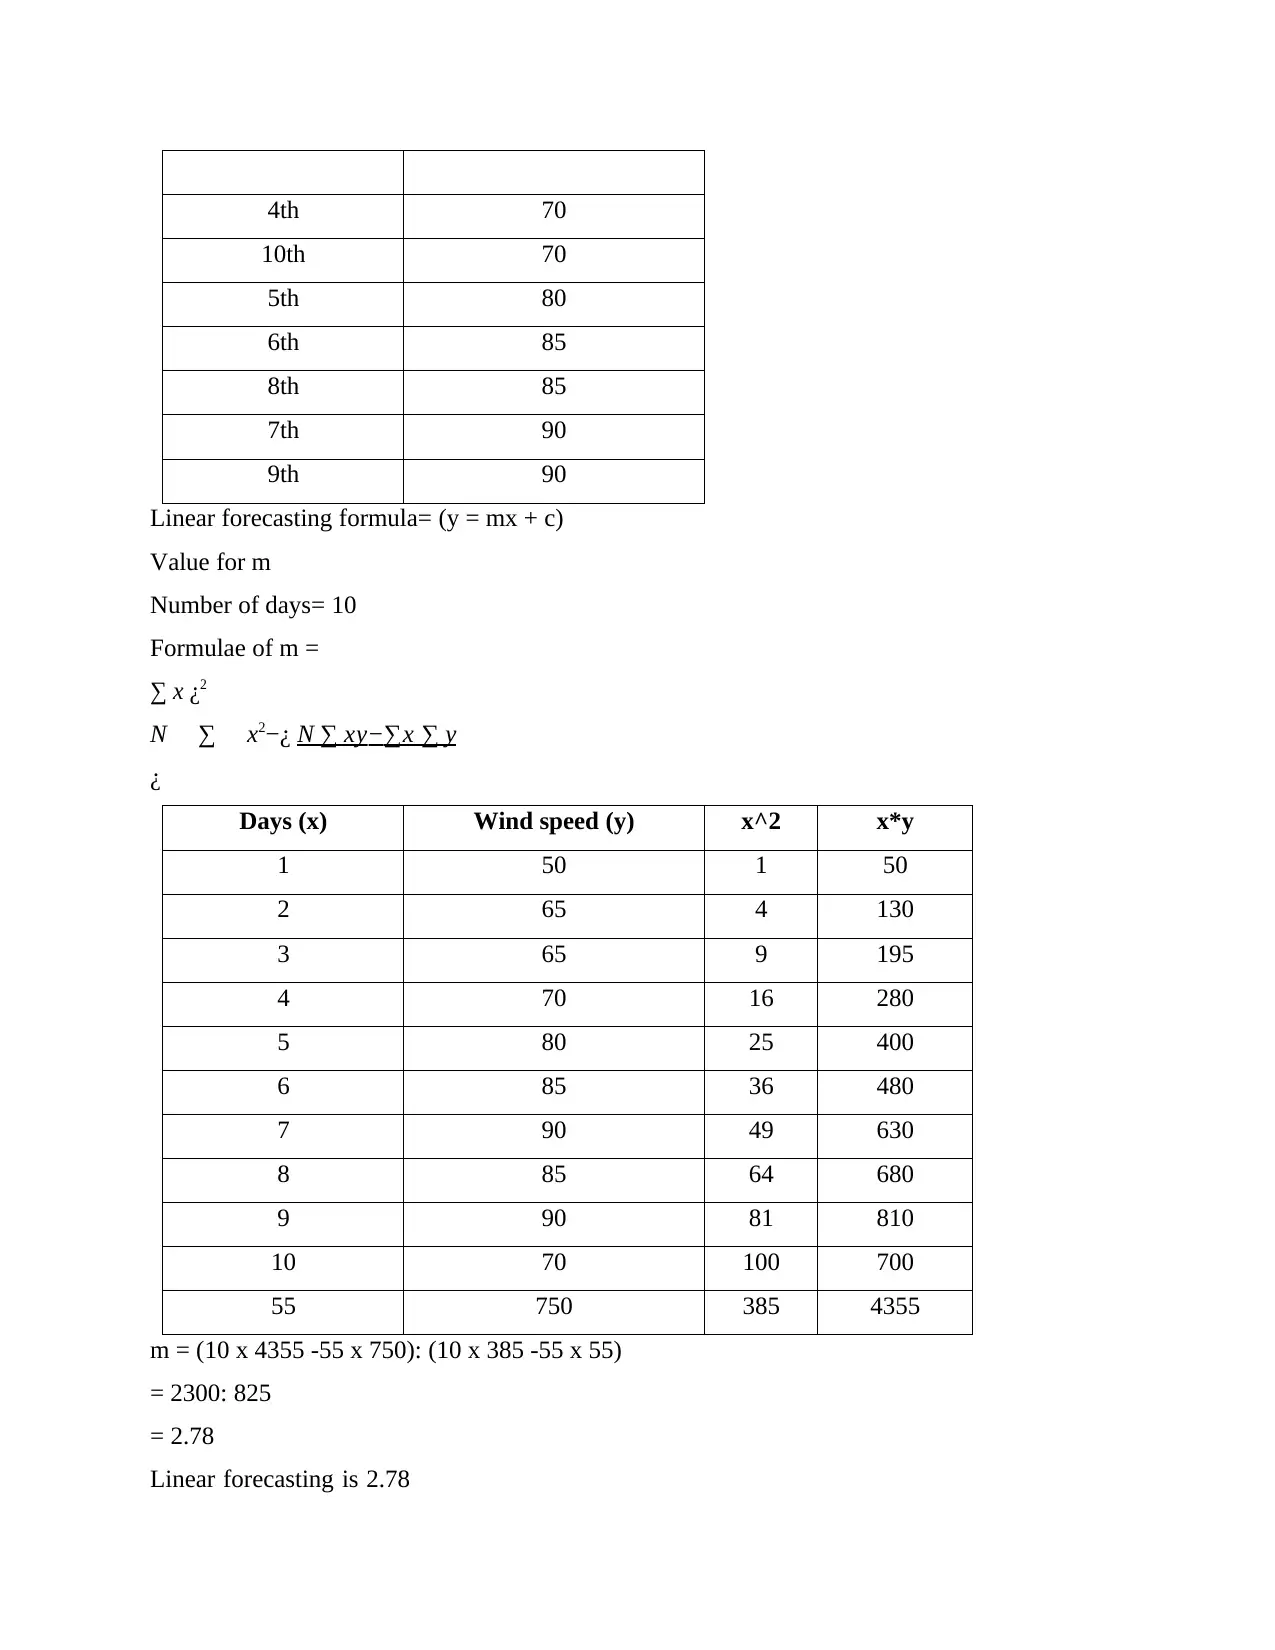
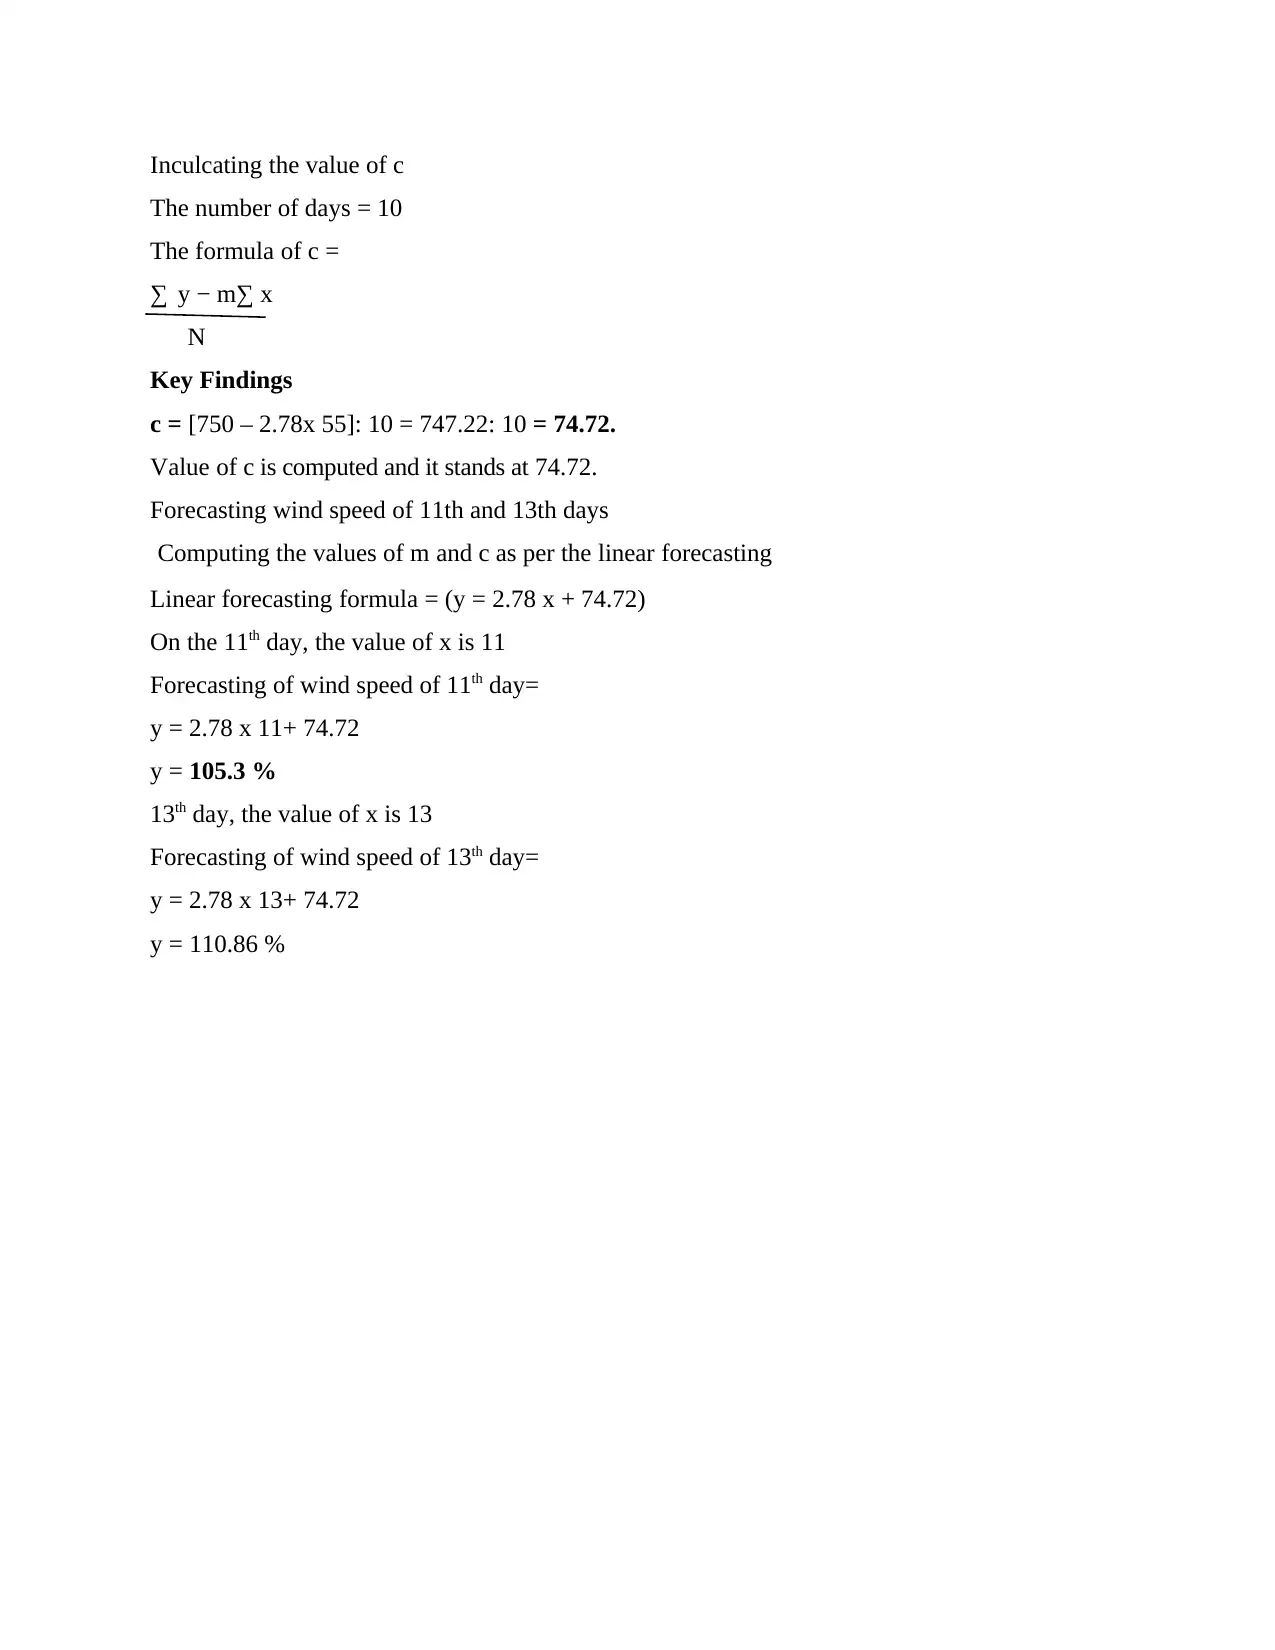
This assignment focuses on data analysis and forecasting techniques, applying them to a dataset of wind speeds over ten days. The analysis includes calculating key statistical measures such as mean, mode, median, range, and standard deviation to understand the central tendency and variability of the data. Furthermore, the assignment employs linear forecasting to predict wind speeds for the 11th and 13th days, demonstrating the application of forecasting methods. The calculations and interpretations provide a comprehensive overview of the dataset and its potential future trends. The student uses the data to determine the linear forecasting which is found to be 2.78. The values of m and c are computed as per the linear forecasting to compute the wind speed.
Document Page
Data Analysis and
Forecasting
tabler-icon-diamond-filled.svg

Paraphrase This Document

Need a fresh take? Get an instant paraphrase of this document with our AI Paraphraser
Document Page
Contents
Contents...........................................................................................................................................2
1.......................................................................................................................................................1
2.......................................................................................................................................................1
3.......................................................................................................................................................2
Mean............................................................................................................................................2
Mode............................................................................................................................................2
Median.........................................................................................................................................3
Range...........................................................................................................................................3
Standard Deviation......................................................................................................................4
4.......................................................................................................................................................4
Document Page
1.
Days Wind speed
1st 50
2nd 65
3rd 65
4th 70
5th 80
6th 85
7th 90
8th 85
9th 90
10th 70
Total Gross 750
2.
3D column chart-
3D bar chart-
Document Page
3.
Mean
The formula of Mean: (μ) =

x

N
Key Findings
Number of days: 10
Observing the wind speed: 750
Mean (μ): 750: 10 = 75 %
As it can be seen from the above calculations that the mean is 75 as per the statistics that
are taken in the above table as it is obtained after calculating the total of the information and after
then dividing it with the total number of quantity that is available in the data set.
Mode
Key Findings
Number of days =10
Wind speed = 50, 65, 65, 70, 80, 85, 90, 85, 90, 70
Mode = 65%, 70%, 85% and 90%.
tabler-icon-diamond-filled.svg

Paraphrase This Document

Need a fresh take? Get an instant paraphrase of this document with our AI Paraphraser
Document Page
From the above it can be seen that there are 4 modes namely 65, 70, 85, and 90, therefore it
can be concluded that there could be no mode or many modes in a data set as per the statistics
given.
Median
Formula for median = number of terms +1 divided by 2
Key Findings
Days Wind speed (%)
1st 50
2nd 65
3rd 65
4th 70
10th 70
5th 80
6th 85
8th 85
7th 90
9th 90
The number of days = 10
Median value of days = (10+ 1): 2 = 11/ 2= 5.5 %
Average median = (upper value + lower value): 2 = [70+80]: 2 = 75 %
Median of the above statistics which is regarded as the midpoint of the data is 75 as per the
calculations that are done.
Range
Formulae for range = (Largest value smallest value)
Key Findings
Largest value of wind speed = 90 %
Smallest value of wind speed = 50%
Range = [90 50] = 40%
Range of the given information is 40 as it came after calculating the lower value and then
subtracting it from the greater value
Document Page
Standard Deviation
Standard deviation (σ) =
x

(¿−μ)
2

N
¿
Key Findings
Days Wind speed (%) Mean (μ) (x-μ) (x-μ)^2
1st 50 75 (50-75)=-25 625
2nd 65 75 (65-75)=-10 100
3rd 65 75 (65-75)-10 100
4th 70 75 (70-75)=-5 25
10th 70 75 (70-75)=-5 25
5th 80 75 (80-75)=5 25
6th 85 75 (85-75)=10 100
8th 85 75 (85-75)=10 100
7th 90 75 (90-75)=15 225
9th 90 75 (90-75)=15 225
Total Gross 750 0 1550
= √ [1550:10]
= 12.44 %
Since standard deviation is one of the most important aspect of each and every company as
well as the industry no matter in which sector or the area the company is dealing and hence it can
be seen from the above calculation which is done precisely and accurately that the standard
deviation comes at 12.44% respectively.
4.
Days Wind speed (%)
1st 50
2nd 65
3rd 65
Document Page
4th 70
10th 70
5th 80
6th 85
8th 85
7th 90
9th 90
Linear forecasting formula= (y = mx + c)
Value for m
Number of days= 10
Formulae of m =
x ¿ 2
N x2−¿ N xy∑x y
¿
Days (x) Wind speed (y) x^2 x*y
1 50 1 50
2 65 4 130
3 65 9 195
4 70 16 280
5 80 25 400
6 85 36 480
7 90 49 630
8 85 64 680
9 90 81 810
10 70 100 700
55 750 385 4355
m = (10 x 4355 -55 x 750): (10 x 385 -55 x 55)
= 2300: 825
= 2.78
Linear forecasting is 2.78
tabler-icon-diamond-filled.svg

Paraphrase This Document

Need a fresh take? Get an instant paraphrase of this document with our AI Paraphraser
Document Page
Inculcating the value of c
The number of days = 10
The formula of c =
y − m∑ x
N
Key Findings
c = [750 – 2.78x 55]: 10 = 747.22: 10 = 74.72.
Value of c is computed and it stands at 74.72.
Forecasting wind speed of 11th and 13th days
Computing the values of m and c as per the linear forecasting
Linear forecasting formula = (y = 2.78 x + 74.72)
On the 11th day, the value of x is 11
Forecasting of wind speed of 11th day=
y = 2.78 x 11+ 74.72
y = 105.3 %
13th day, the value of x is 13
Forecasting of wind speed of 13th day=
y = 2.78 x 13+ 74.72
y = 110.86 %
chevron_up_icon
1 out of 8
circle_padding
hide_on_mobile
zoom_out_icon
[object Object]