BABS Foundation Level Data Analysis and Forecasting Individual Project

Verified

Added on  2023/01/11

|9
|1055
|82
Project
AI Summary
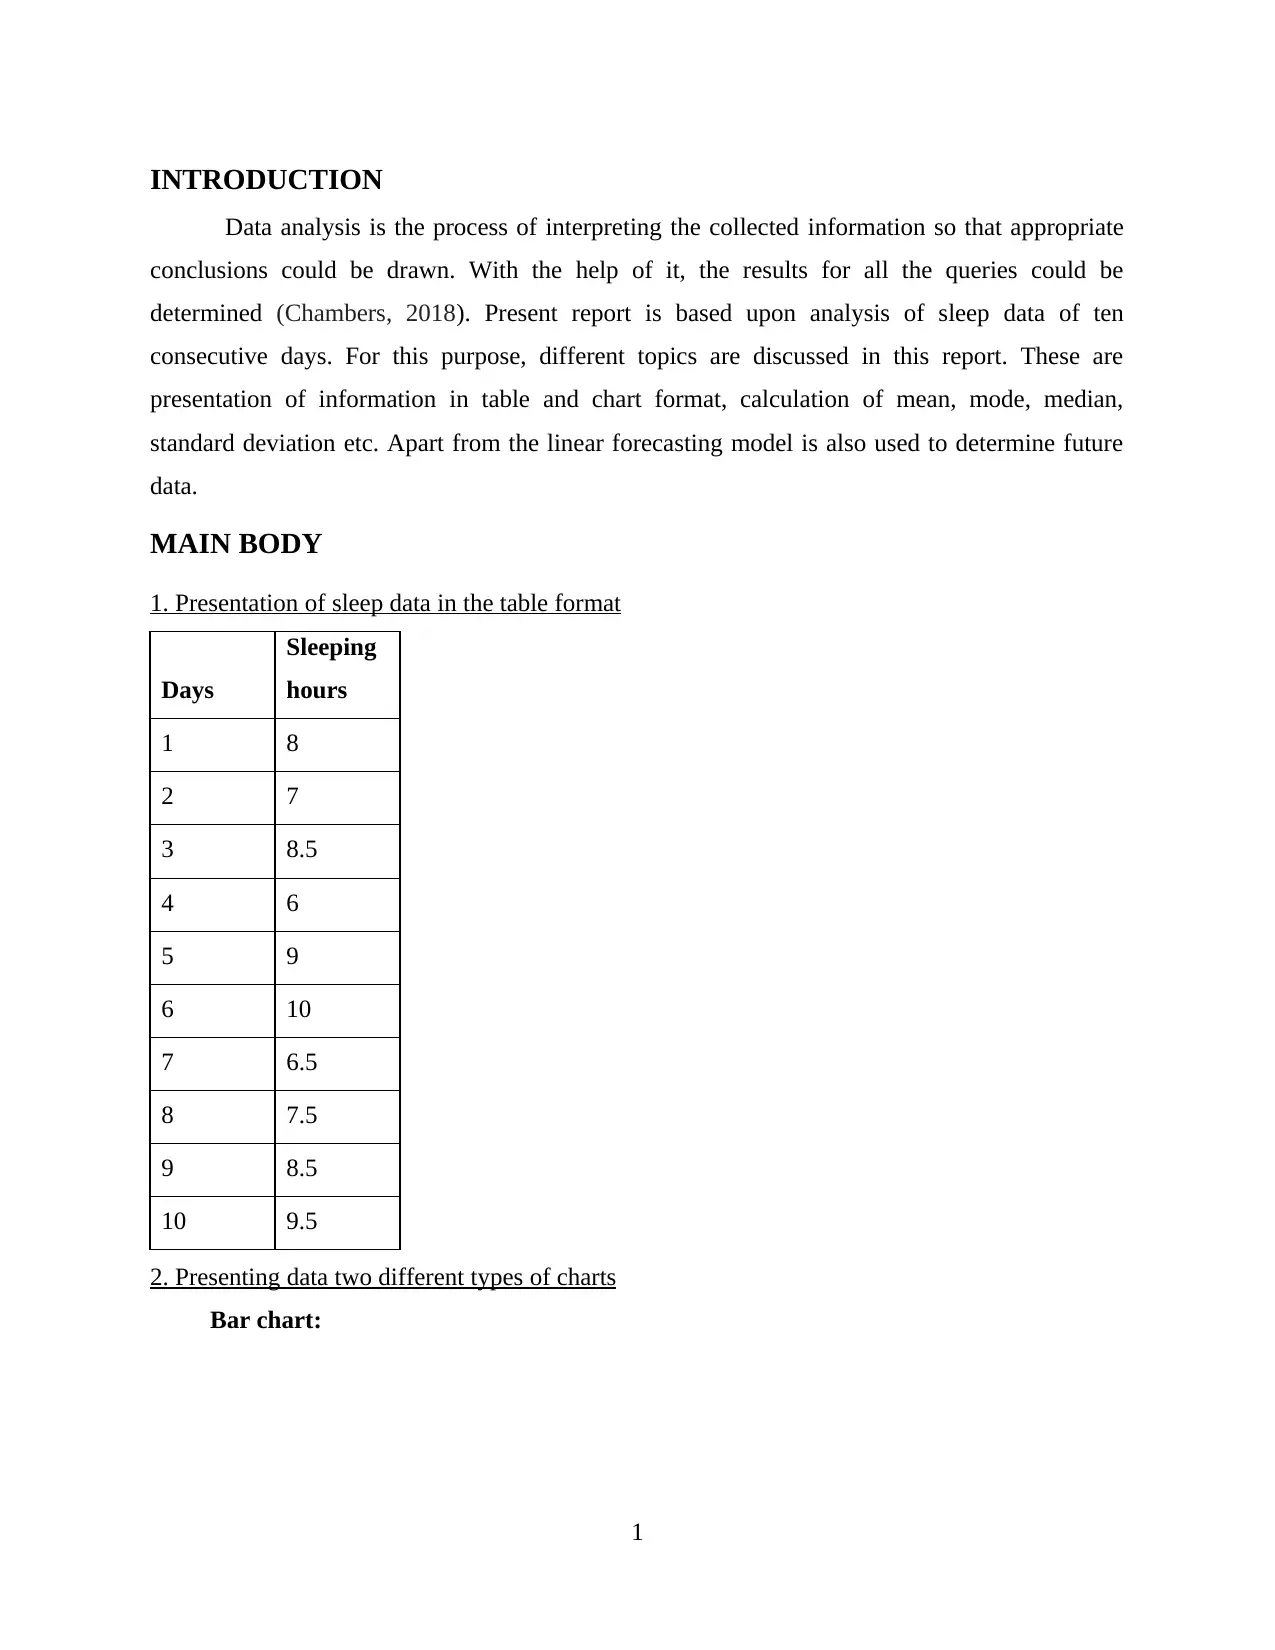
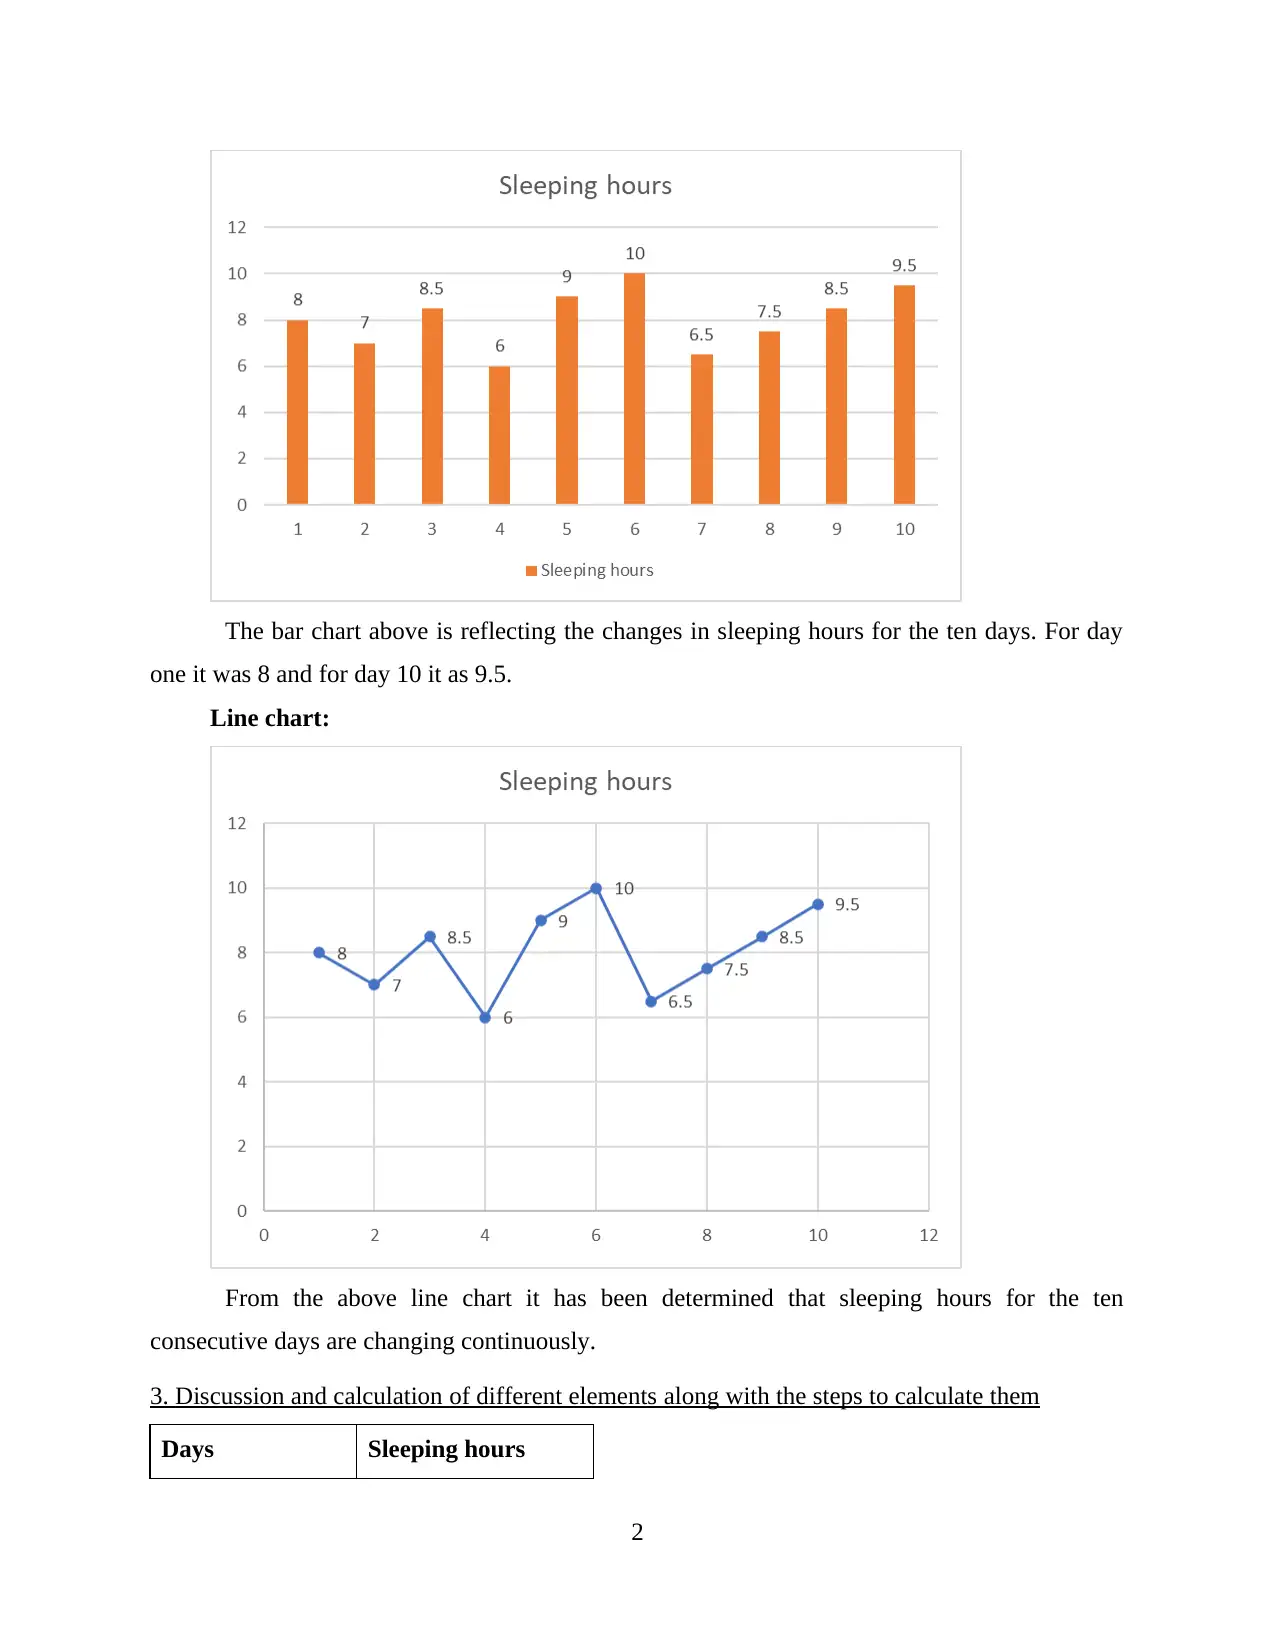
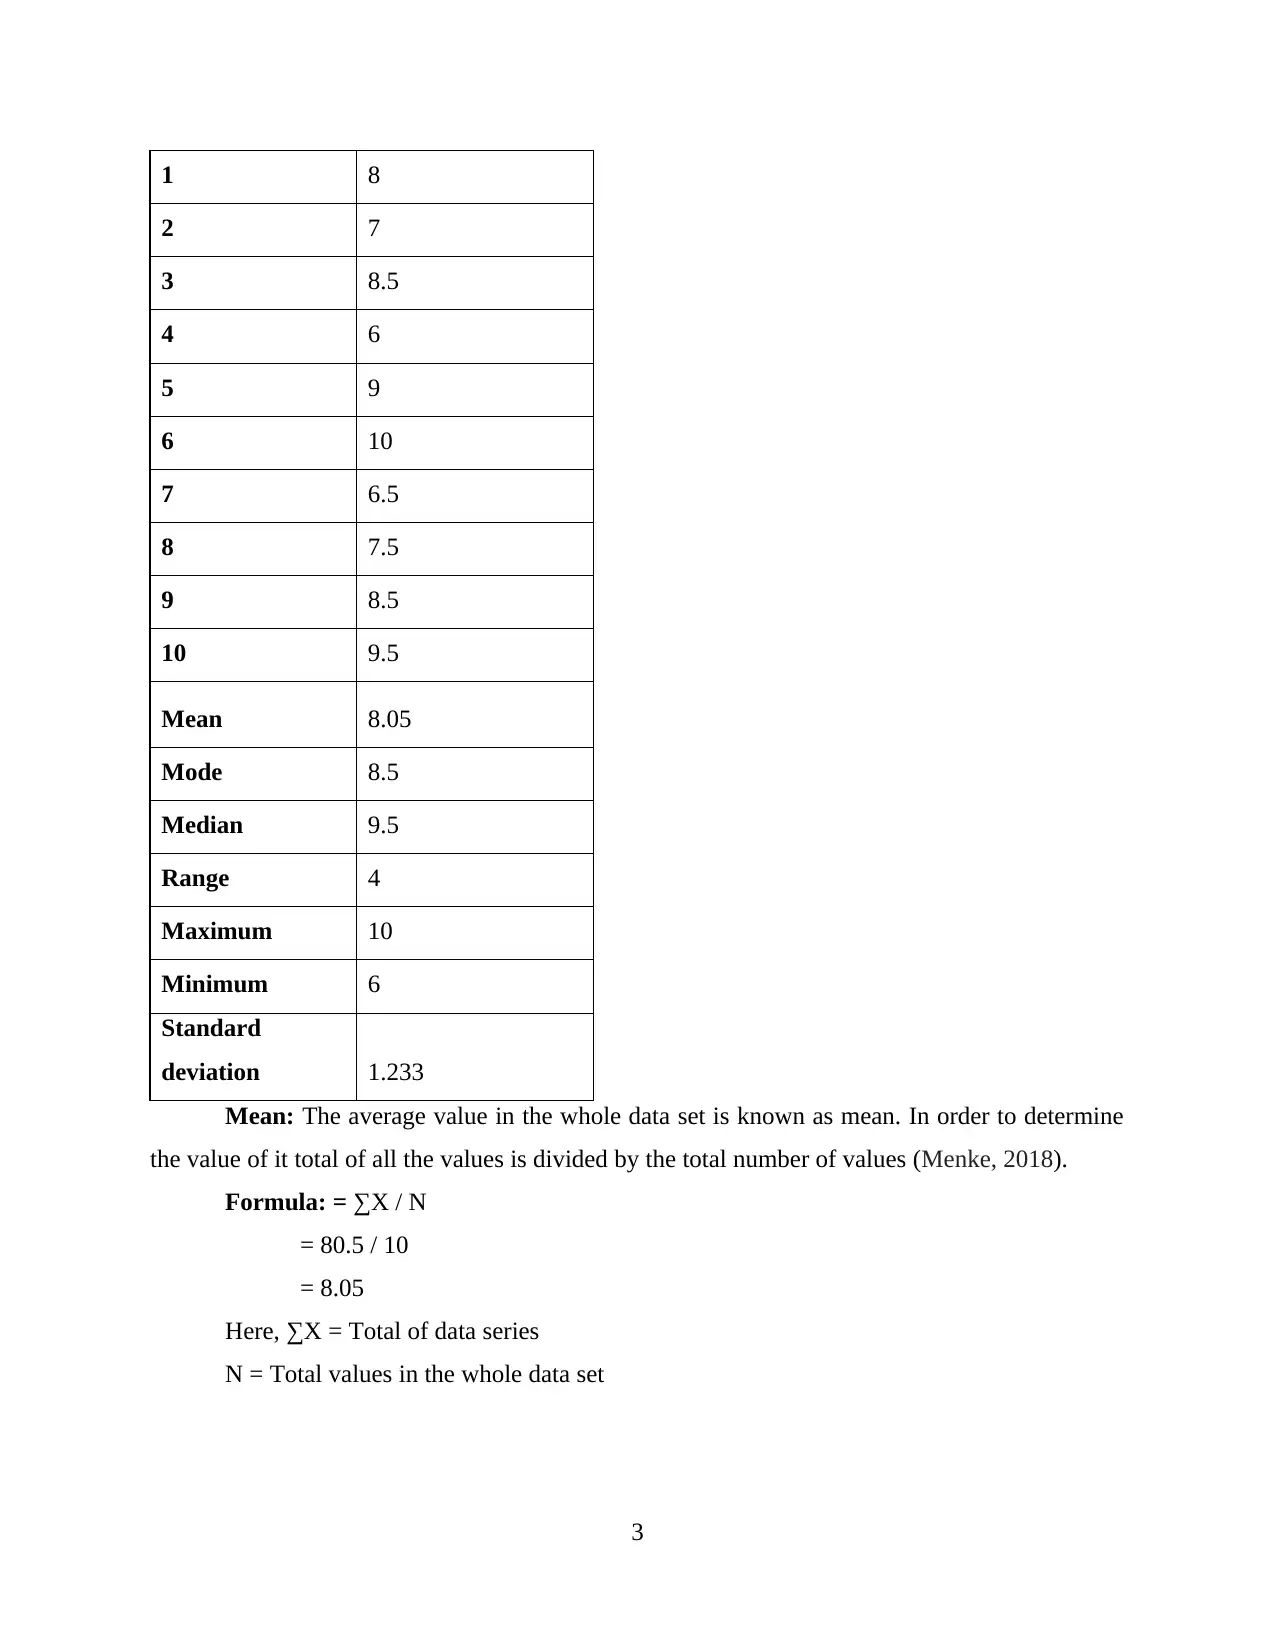
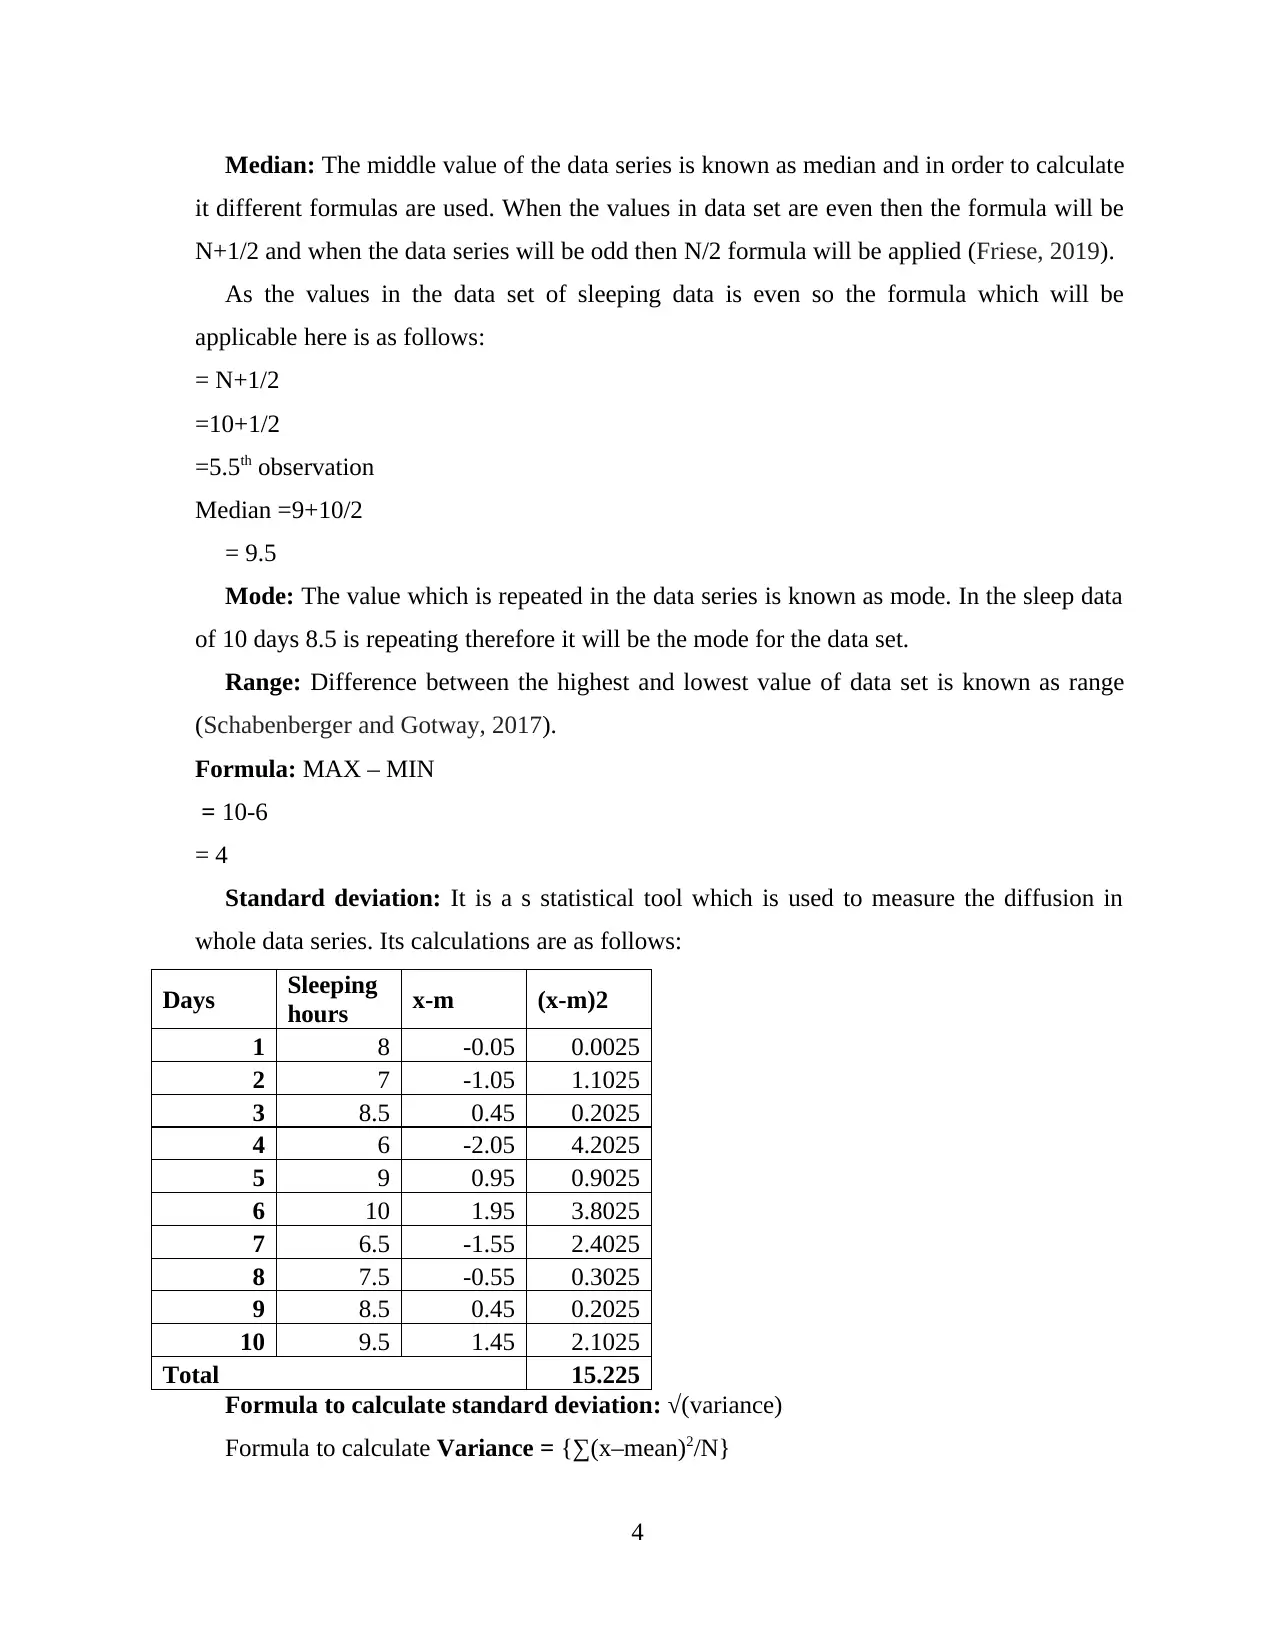
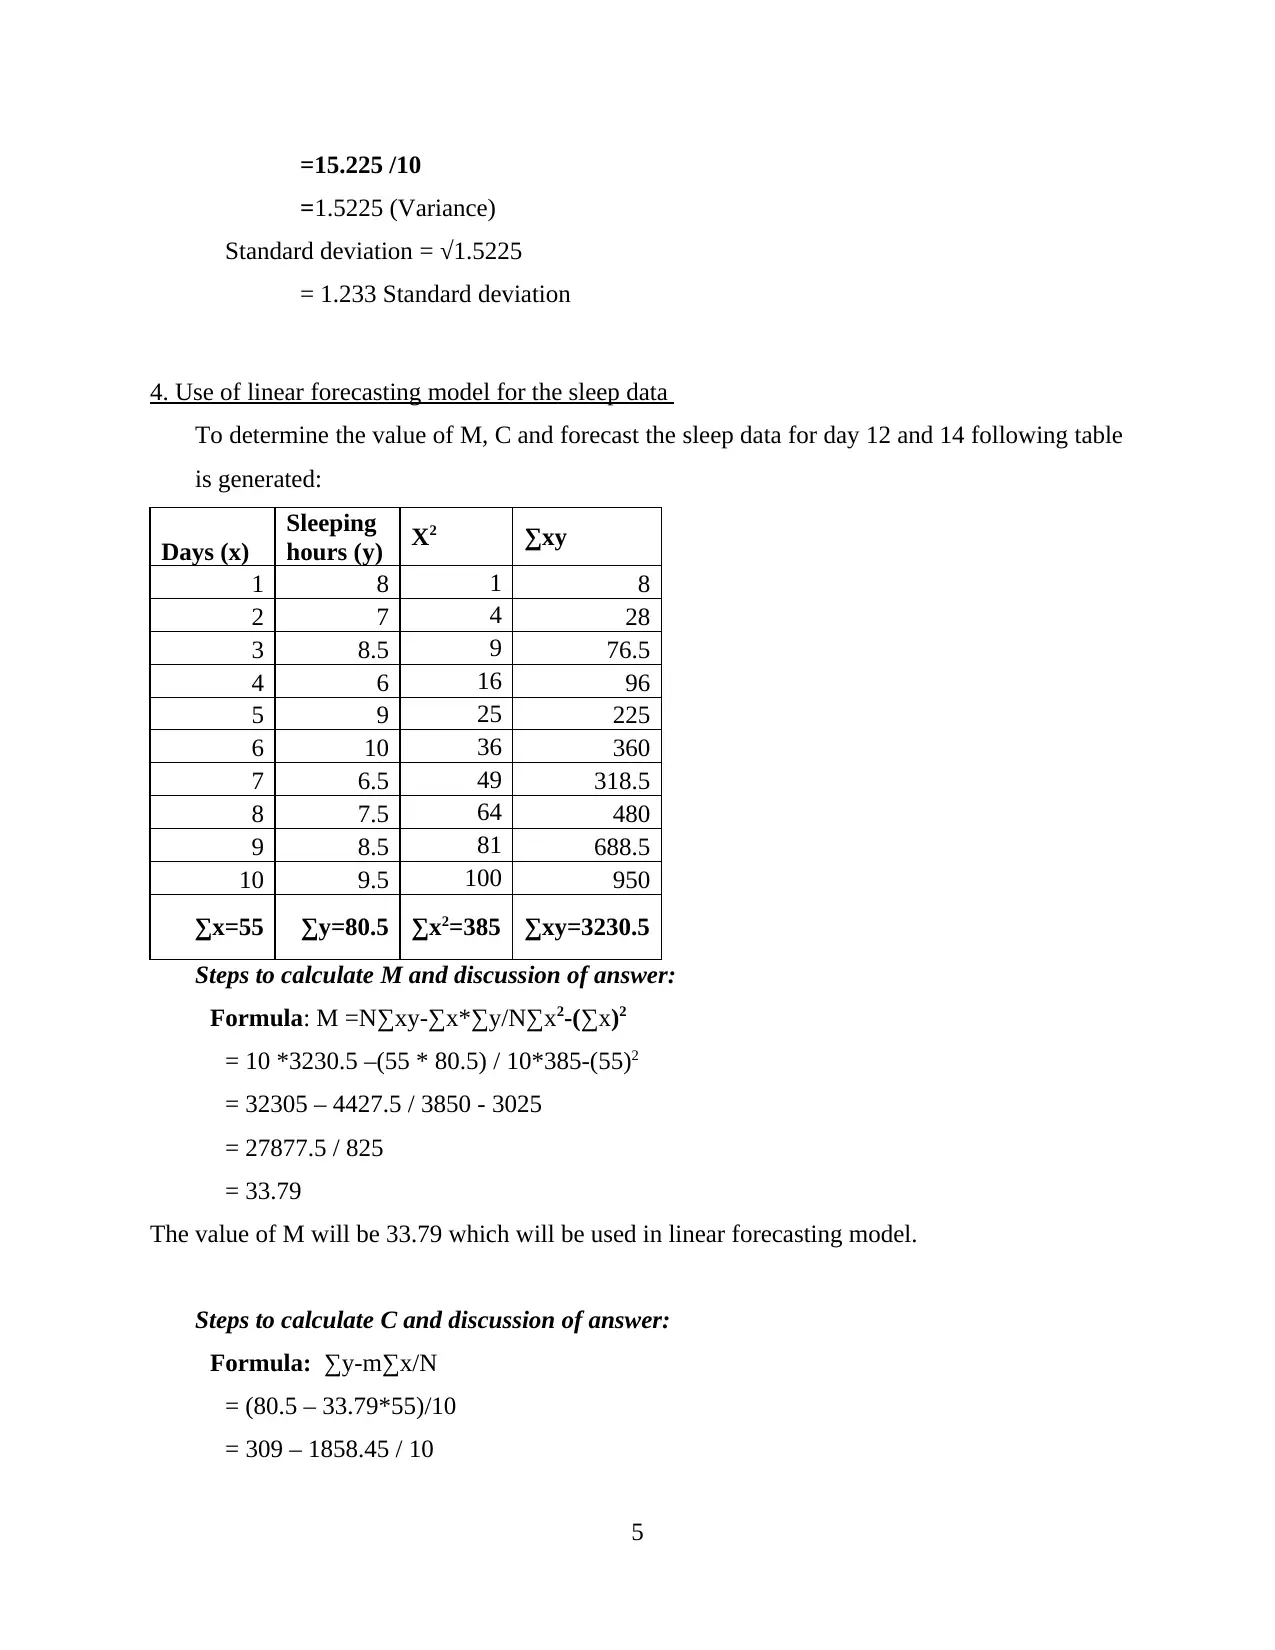
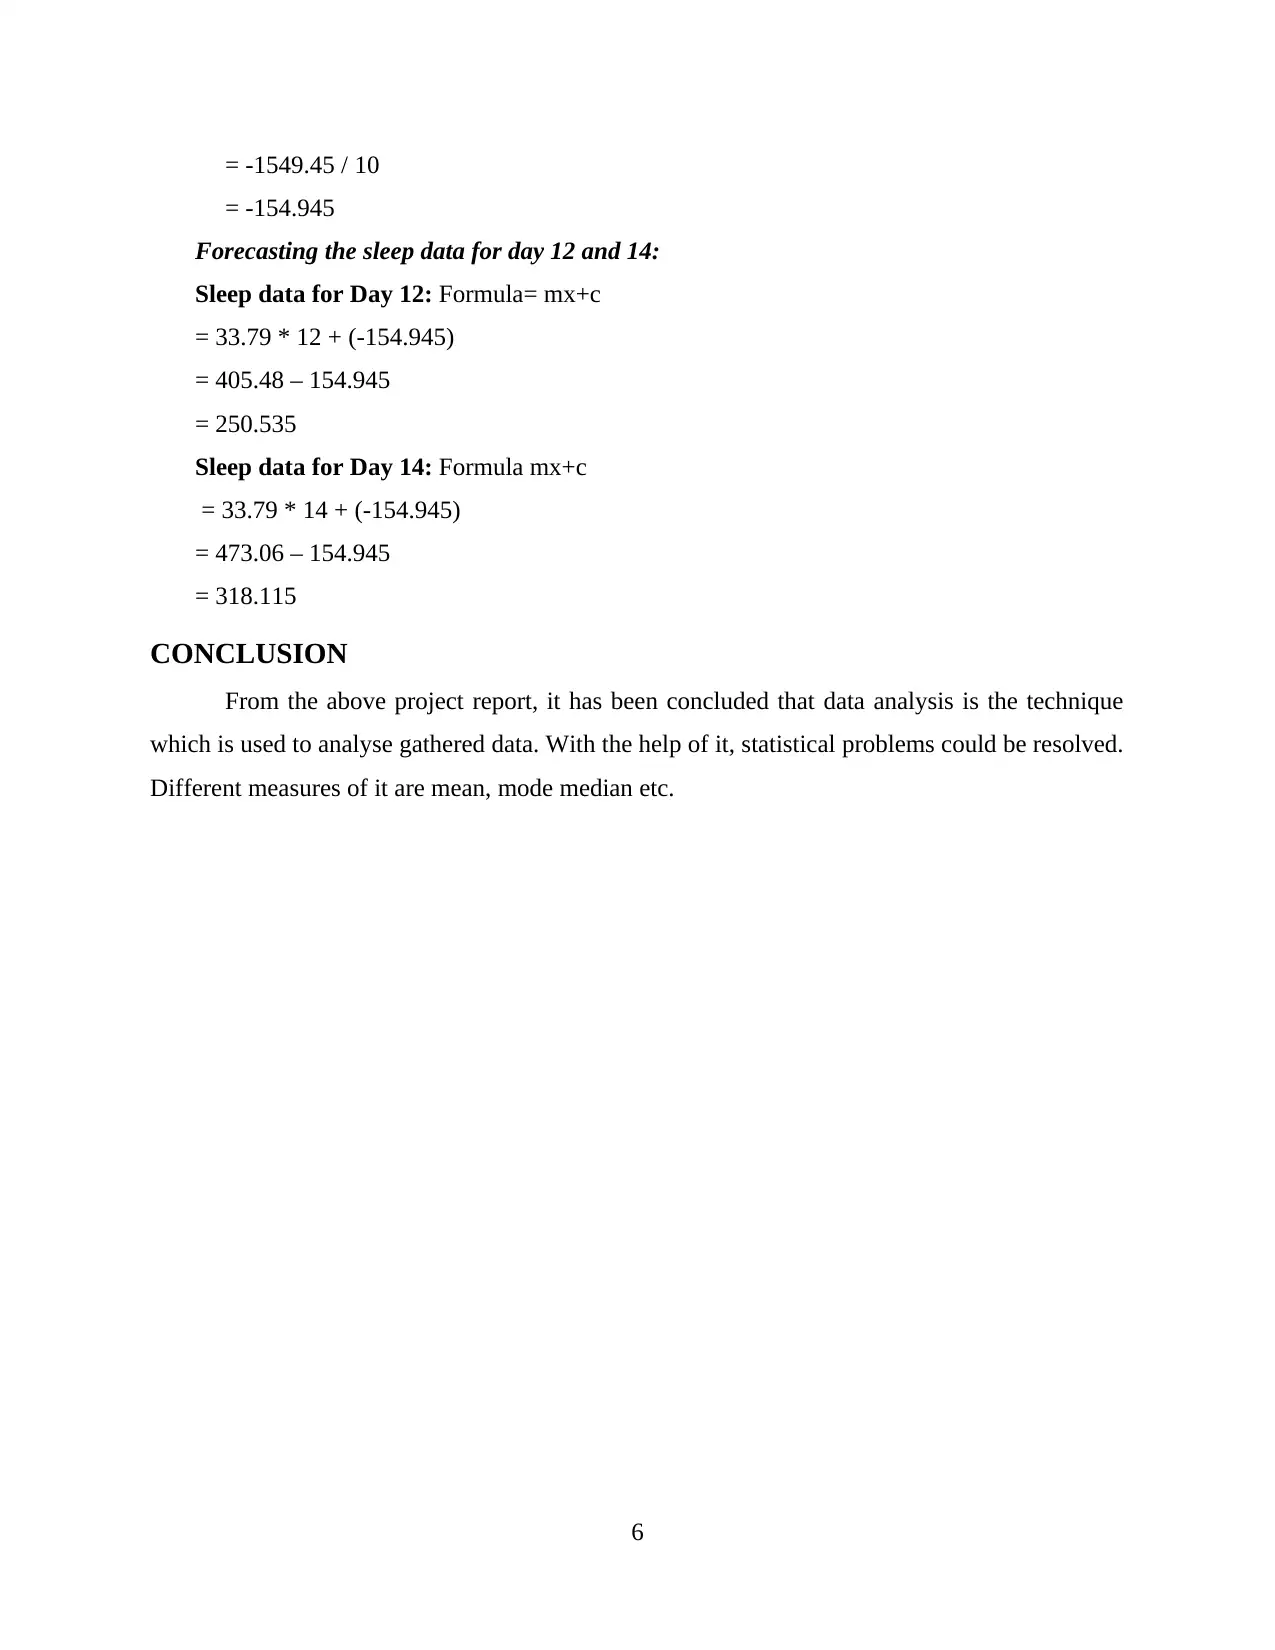
This individual project report focuses on data analysis techniques applied to a ten-day sleep data set. The report begins with data presentation in table and chart formats, followed by calculations of key statistical elements such as mean, mode, median, range, and standard deviation. The student demonstrates the steps involved in calculating these measures, providing formulas and interpretations. Furthermore, a linear forecasting model is implemented to predict future sleep data, with detailed calculations for determining the model's parameters (M and C) and forecasting sleep hours for days 12 and 14. The project concludes with a summary of the findings and references relevant sources used in the analysis.
tabler-icon-diamond-filled.svg

Contribute Materials

Your contribution can guide someone’s learning journey. Share your documents today.
Document Page
Individual Project Data
Analysis Techniques
tabler-icon-diamond-filled.svg

Secure Best Marks with AI Grader

Need help grading? Try our AI Grader for instant feedback on your assignments.
Document Page
Table of Contents
Table of Contents.............................................................................................................................2
INTRODUCTION...........................................................................................................................1
MAIN BODY..................................................................................................................................1
1. Presentation of sleep data in the table format..........................................................................1
2. Presenting data two different types of charts...........................................................................1
3. Discussion and calculation of different elements along with the steps to calculate them.......2
4. Use of linear forecasting model for the sleep data..................................................................5
CONCLUSION................................................................................................................................6
REFERENCES................................................................................................................................7
Document Page
INTRODUCTION
Data analysis is the process of interpreting the collected information so that appropriate
conclusions could be drawn. With the help of it, the results for all the queries could be
determined (Chambers, 2018). Present report is based upon analysis of sleep data of ten
consecutive days. For this purpose, different topics are discussed in this report. These are
presentation of information in table and chart format, calculation of mean, mode, median,
standard deviation etc. Apart from the linear forecasting model is also used to determine future
data.
MAIN BODY
1. Presentation of sleep data in the table format
Days
Sleeping
hours
1 8
2 7
3 8.5
4 6
5 9
6 10
7 6.5
8 7.5
9 8.5
10 9.5
2. Presenting data two different types of charts
Bar chart:
1
Document Page
The bar chart above is reflecting the changes in sleeping hours for the ten days. For day
one it was 8 and for day 10 it as 9.5.
Line chart:
From the above line chart it has been determined that sleeping hours for the ten
consecutive days are changing continuously.
3. Discussion and calculation of different elements along with the steps to calculate them
Days Sleeping hours
2
tabler-icon-diamond-filled.svg

Secure Best Marks with AI Grader

Need help grading? Try our AI Grader for instant feedback on your assignments.
Document Page
1 8
2 7
3 8.5
4 6
5 9
6 10
7 6.5
8 7.5
9 8.5
10 9.5
Mean 8.05
Mode 8.5
Median 9.5
Range 4
Maximum 10
Minimum 6
Standard
deviation 1.233
Mean: The average value in the whole data set is known as mean. In order to determine
the value of it total of all the values is divided by the total number of values (Menke, 2018).
Formula: = ∑X / N
= 80.5 / 10
= 8.05
Here, ∑X = Total of data series
N = Total values in the whole data set
3
Document Page
Median: The middle value of the data series is known as median and in order to calculate
it different formulas are used. When the values in data set are even then the formula will be
N+1/2 and when the data series will be odd then N/2 formula will be applied (Friese, 2019).
As the values in the data set of sleeping data is even so the formula which will be
applicable here is as follows:
= N+1/2
=10+1/2
=5.5th observation
Median =9+10/2
= 9.5
Mode: The value which is repeated in the data series is known as mode. In the sleep data
of 10 days 8.5 is repeating therefore it will be the mode for the data set.
Range: Difference between the highest and lowest value of data set is known as range
(Schabenberger and Gotway, 2017).
Formula: MAX – MIN
= 10-6
= 4
Standard deviation: It is a s statistical tool which is used to measure the diffusion in
whole data series. Its calculations are as follows:
Days Sleeping
hours x-m (x-m)2
1 8 -0.05 0.0025
2 7 -1.05 1.1025
3 8.5 0.45 0.2025
4 6 -2.05 4.2025
5 9 0.95 0.9025
6 10 1.95 3.8025
7 6.5 -1.55 2.4025
8 7.5 -0.55 0.3025
9 8.5 0.45 0.2025
10 9.5 1.45 2.1025
Total 15.225
Formula to calculate standard deviation: √(variance)
Formula to calculate Variance = {∑(x–mean)2/N}
4
Document Page
=15.225 /10
=1.5225 (Variance)
Standard deviation = √1.5225
= 1.233 Standard deviation
4. Use of linear forecasting model for the sleep data
To determine the value of M, C and forecast the sleep data for day 12 and 14 following table
is generated:
Days (x)
Sleeping
hours (y) X2 ∑xy
1 8 1 8
2 7 4 28
3 8.5 9 76.5
4 6 16 96
5 9 25 225
6 10 36 360
7 6.5 49 318.5
8 7.5 64 480
9 8.5 81 688.5
10 9.5 100 950
∑x=55 ∑y=80.5 ∑x2=385 ∑xy=3230.5
Steps to calculate M and discussion of answer:
Formula: M =N∑xy-∑x*∑y/N∑x2-(∑x)2
= 10 *3230.5 –(55 * 80.5) / 10*385-(55)2
= 32305 – 4427.5 / 3850 - 3025
= 27877.5 / 825
= 33.79
The value of M will be 33.79 which will be used in linear forecasting model.
Steps to calculate C and discussion of answer:
Formula: ∑y-m∑x/N
= (80.5 – 33.79*55)/10
= 309 – 1858.45 / 10
5
tabler-icon-diamond-filled.svg

Paraphrase This Document

Need a fresh take? Get an instant paraphrase of this document with our AI Paraphraser
Document Page
= -1549.45 / 10
= -154.945
Forecasting the sleep data for day 12 and 14:
Sleep data for Day 12: Formula= mx+c
= 33.79 * 12 + (-154.945)
= 405.48 – 154.945
= 250.535
Sleep data for Day 14: Formula mx+c
= 33.79 * 14 + (-154.945)
= 473.06 – 154.945
= 318.115
CONCLUSION
From the above project report, it has been concluded that data analysis is the technique
which is used to analyse gathered data. With the help of it, statistical problems could be resolved.
Different measures of it are mean, mode median etc.
6
Document Page
REFERENCES
Books and Journals:
Chambers, J. M., 2018. Graphical methods for data analysis. CRC Press.
Friese, S., 2019. Qualitative data analysis with ATLAS. ti. SAGE Publications Limited.
Menke, W., 2018. Geophysical data analysis: Discrete inverse theory. Academic press.
Schabenberger, O. and Gotway, C. A., 2017. Statistical methods for spatial data analysis. CRC
press.
7
chevron_up_icon
1 out of 9
circle_padding
hide_on_mobile
zoom_out_icon
logo.png

Your All-in-One AI-Powered Toolkit for Academic Success.

Available 24*7 on WhatsApp / Email

[object Object]