Data Analysis and Forecasting Report: Expenditure and Forecasting

Verified

Added on  2022/12/27

|9
|1489
|55
Report
AI Summary
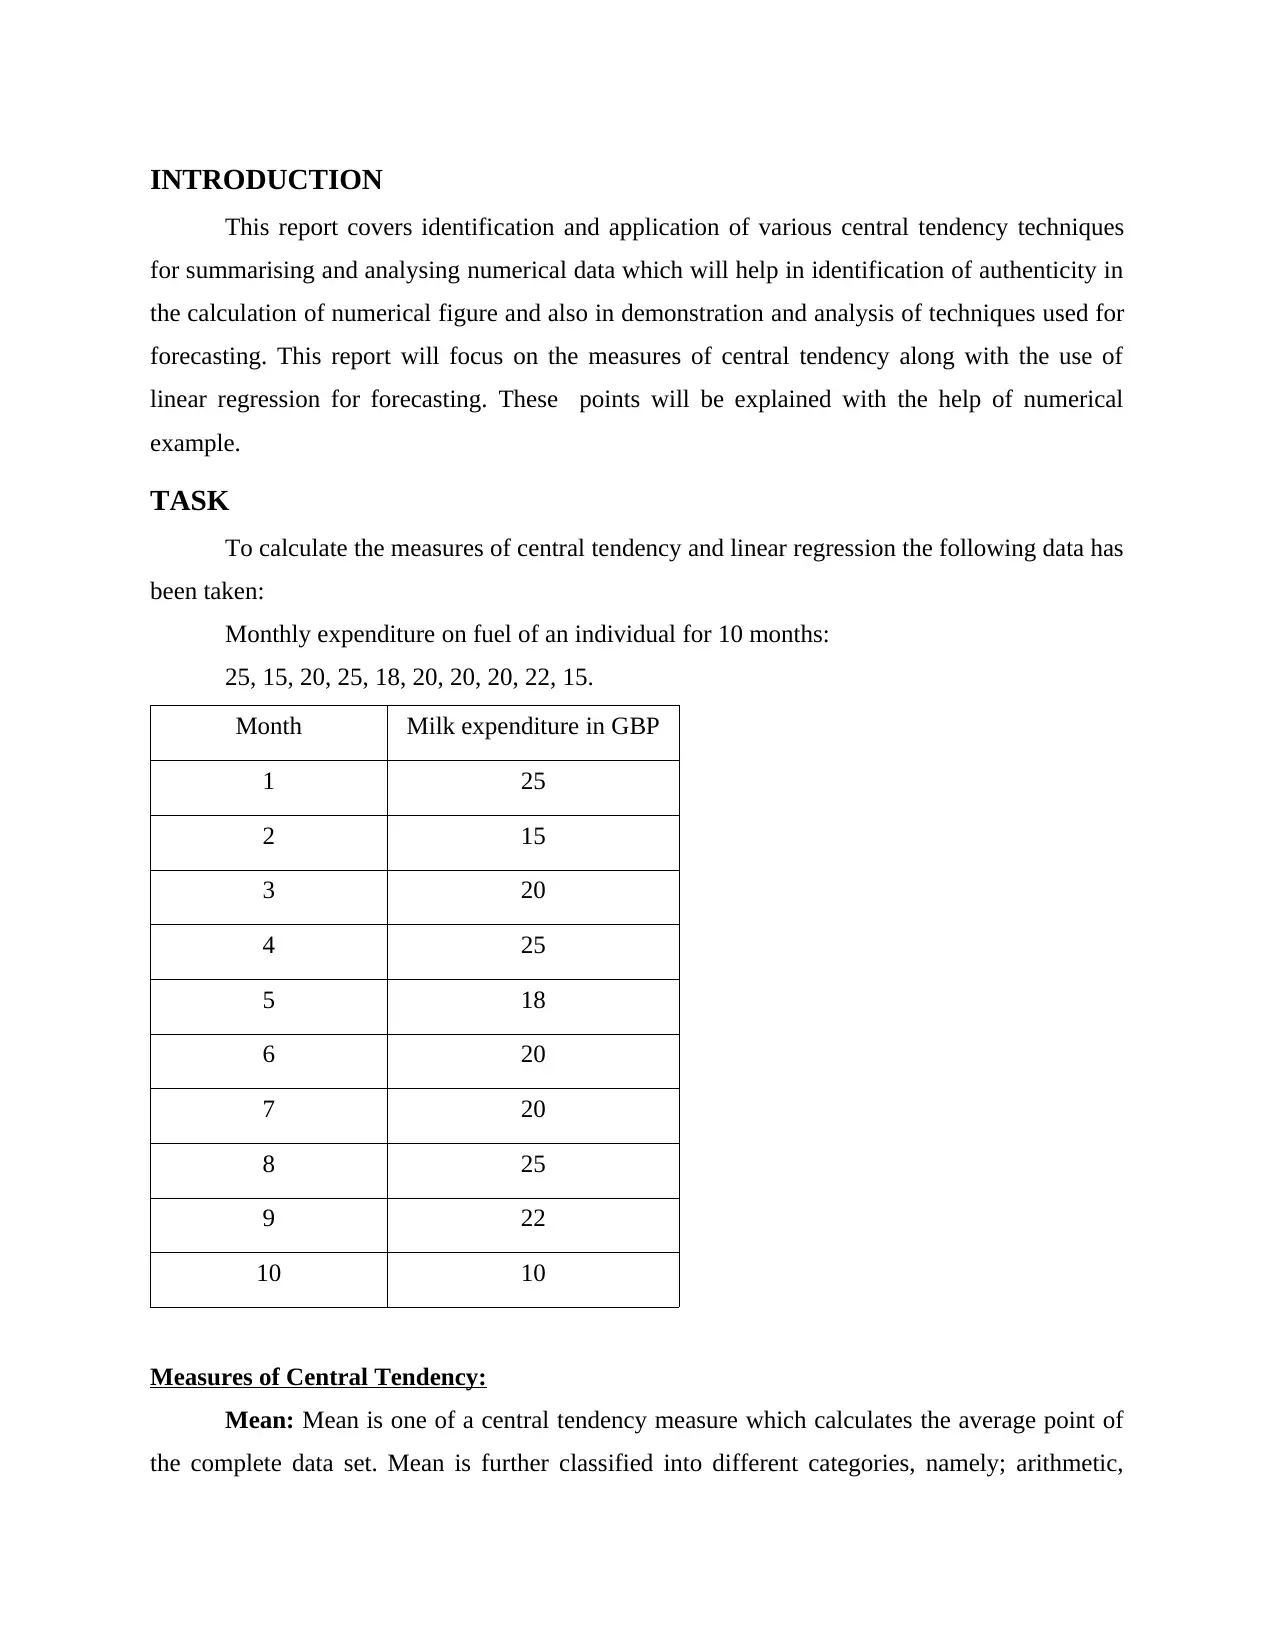
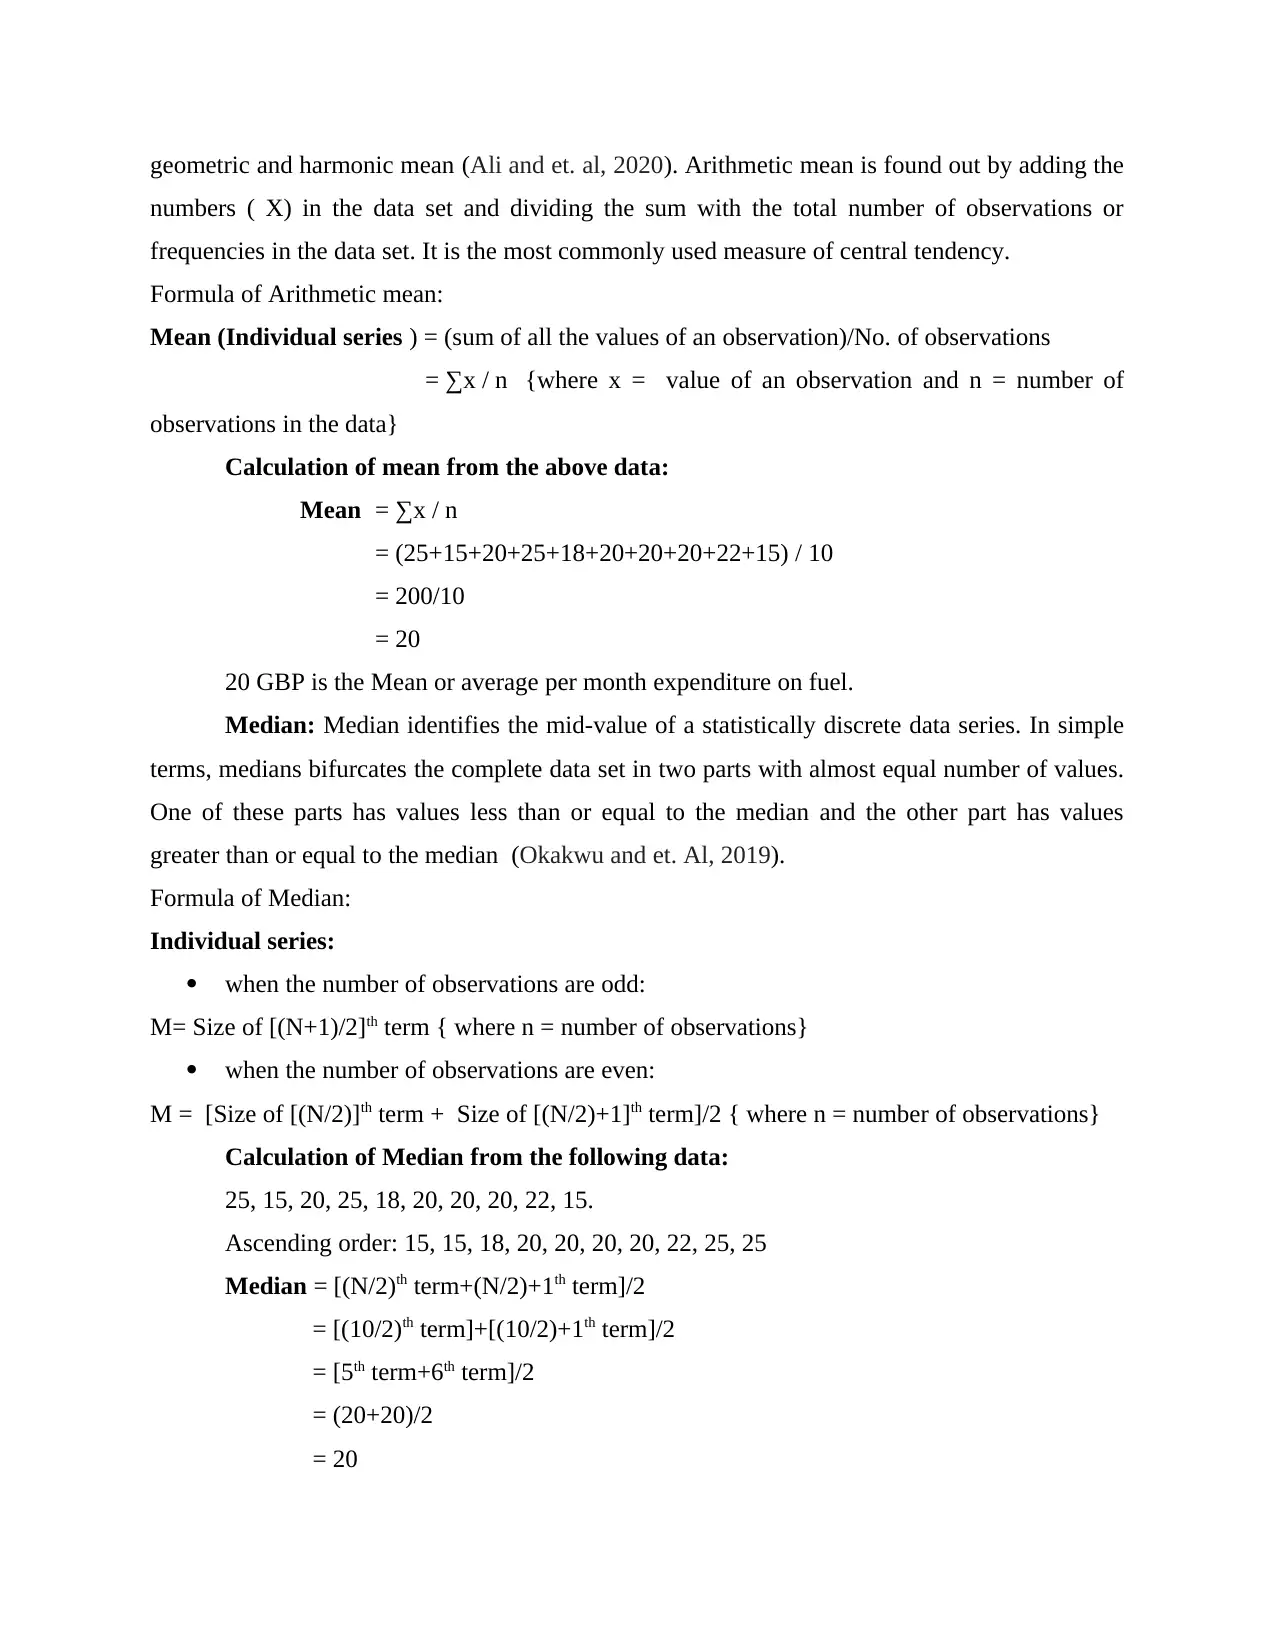
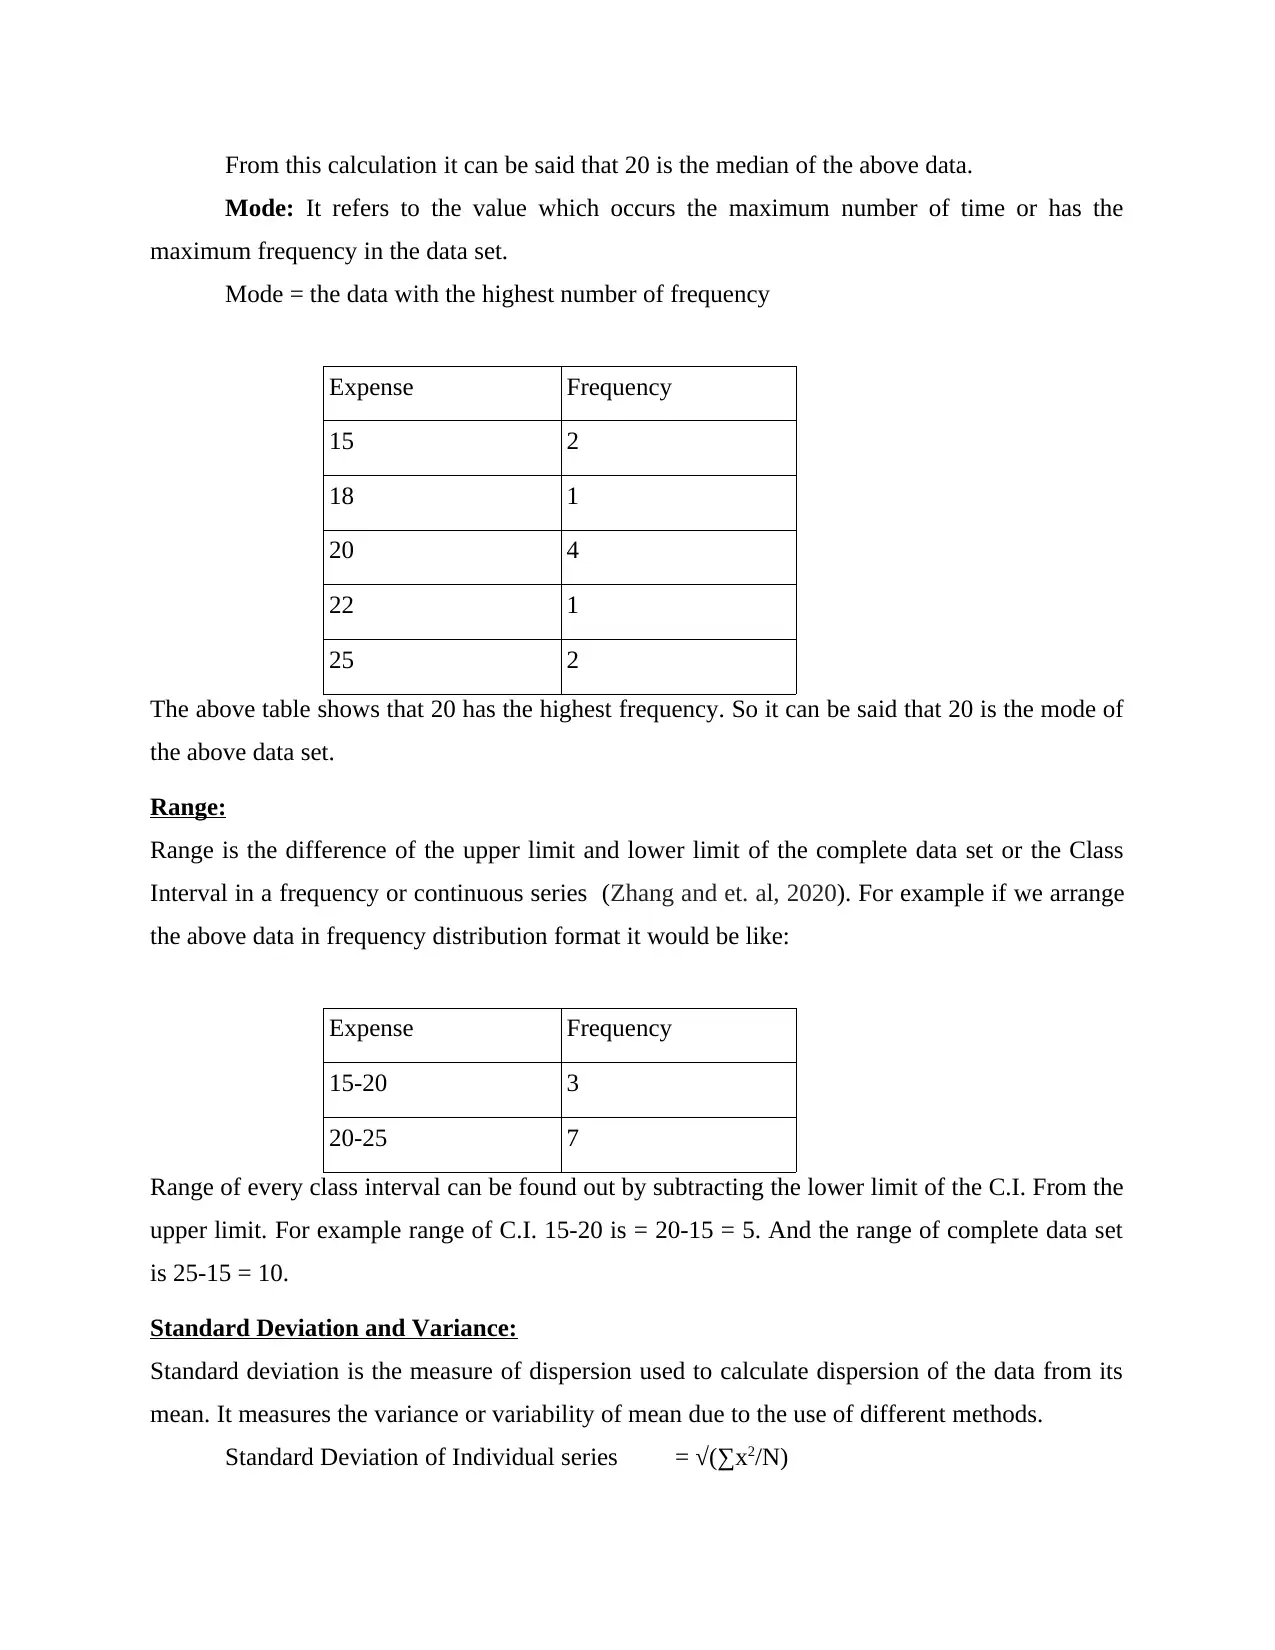
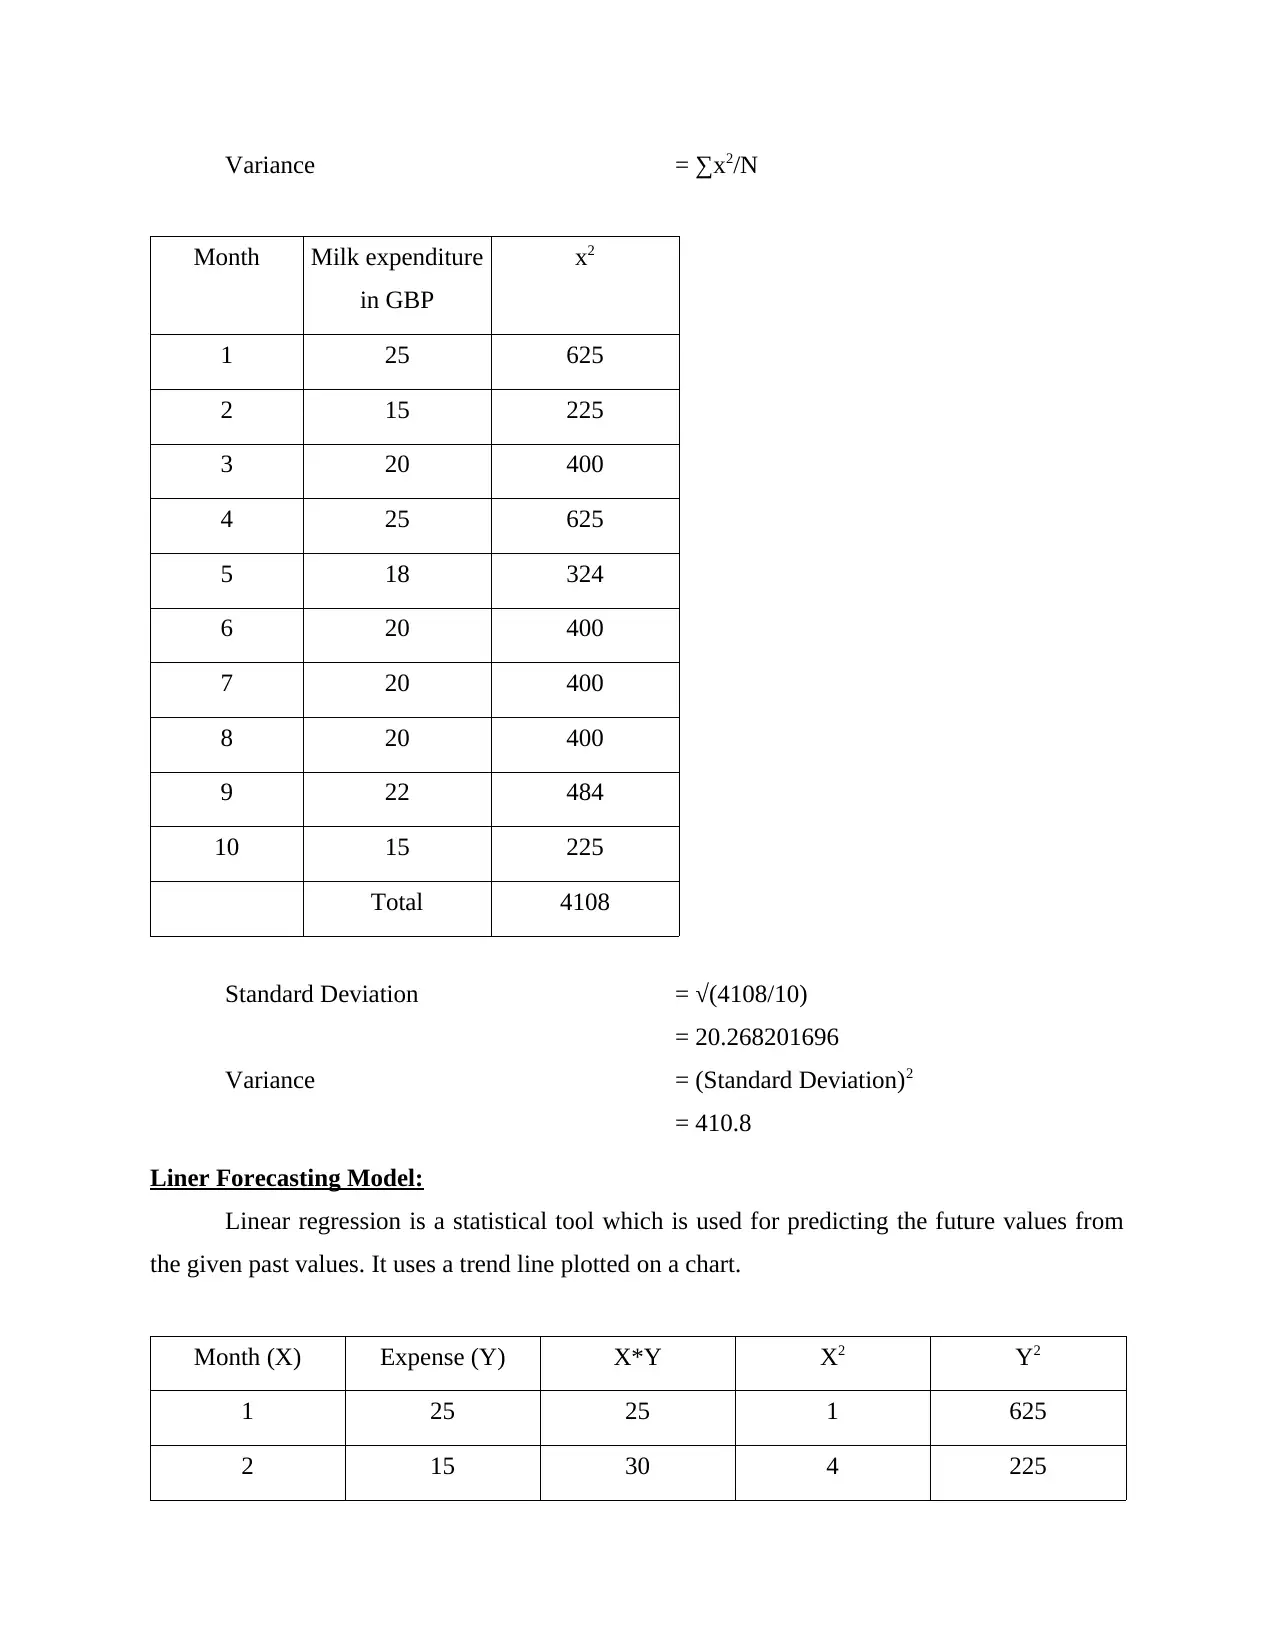
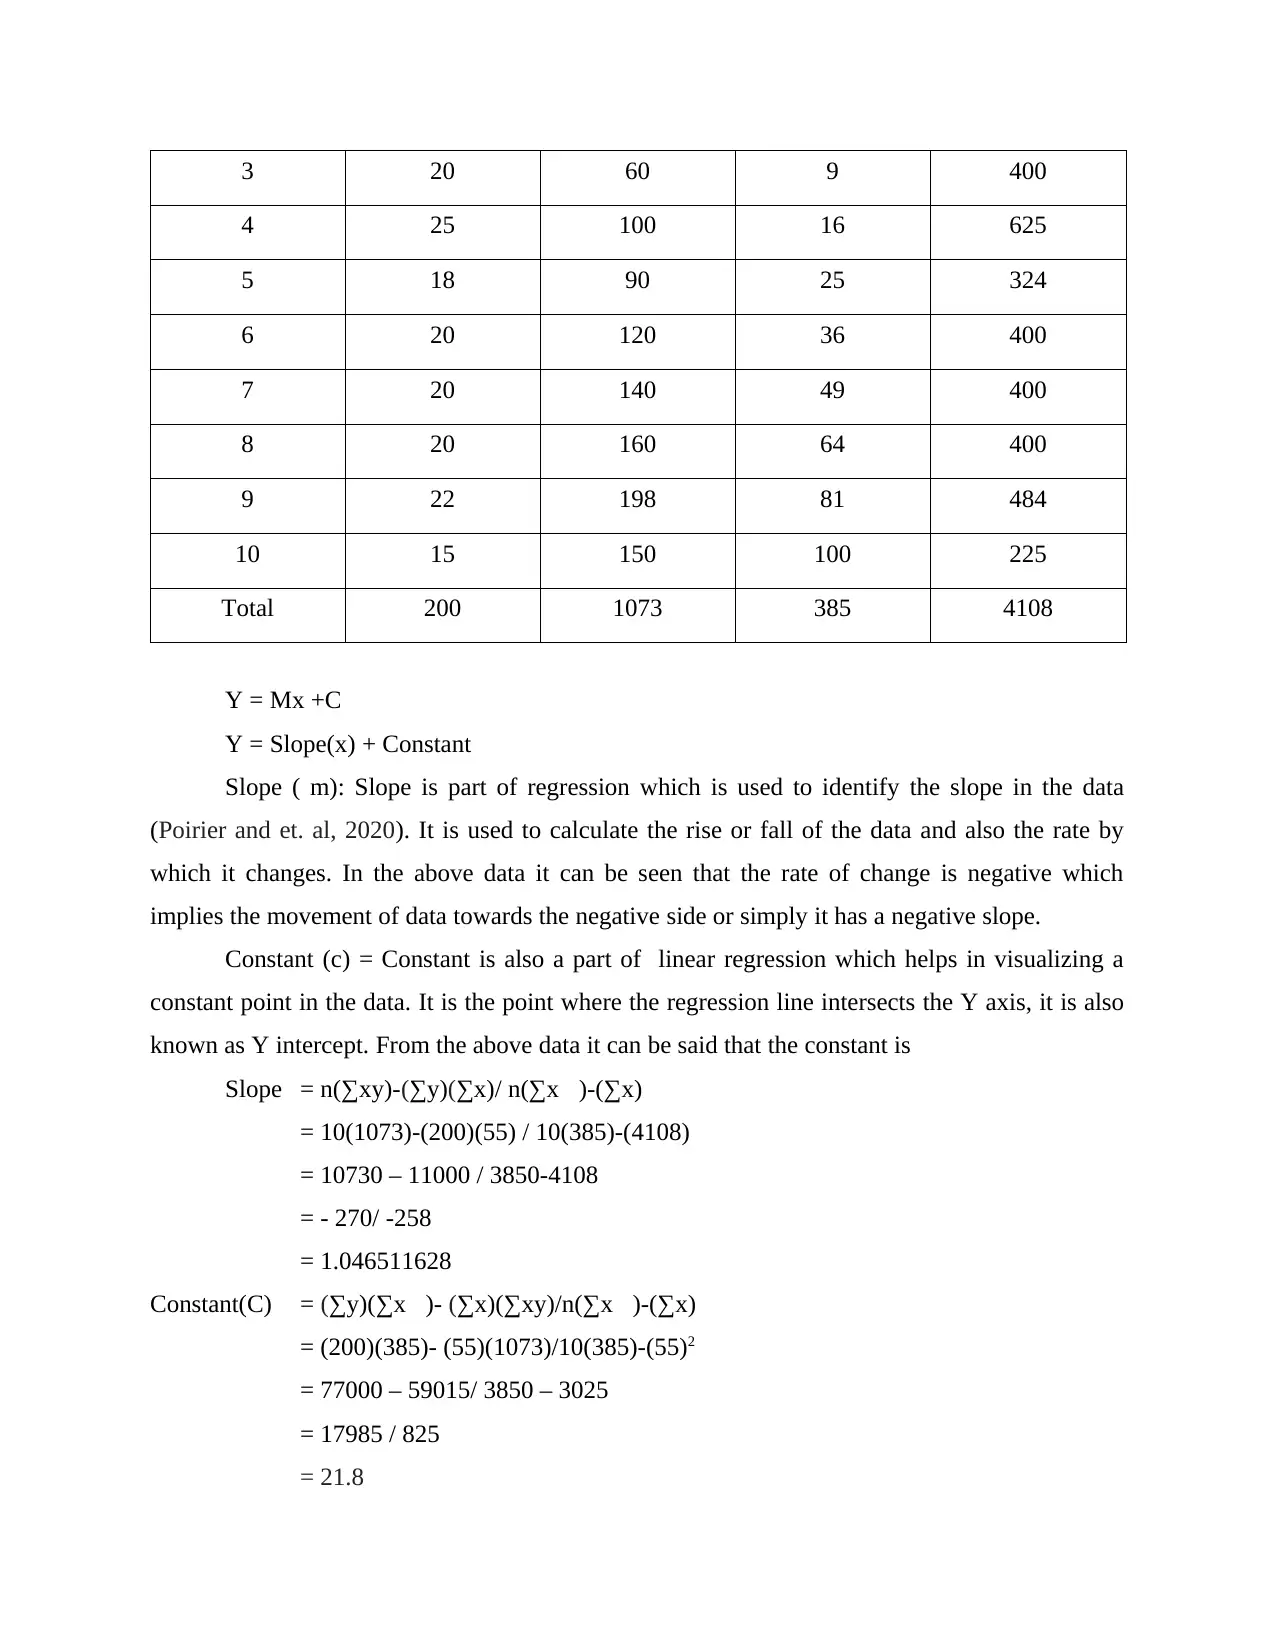
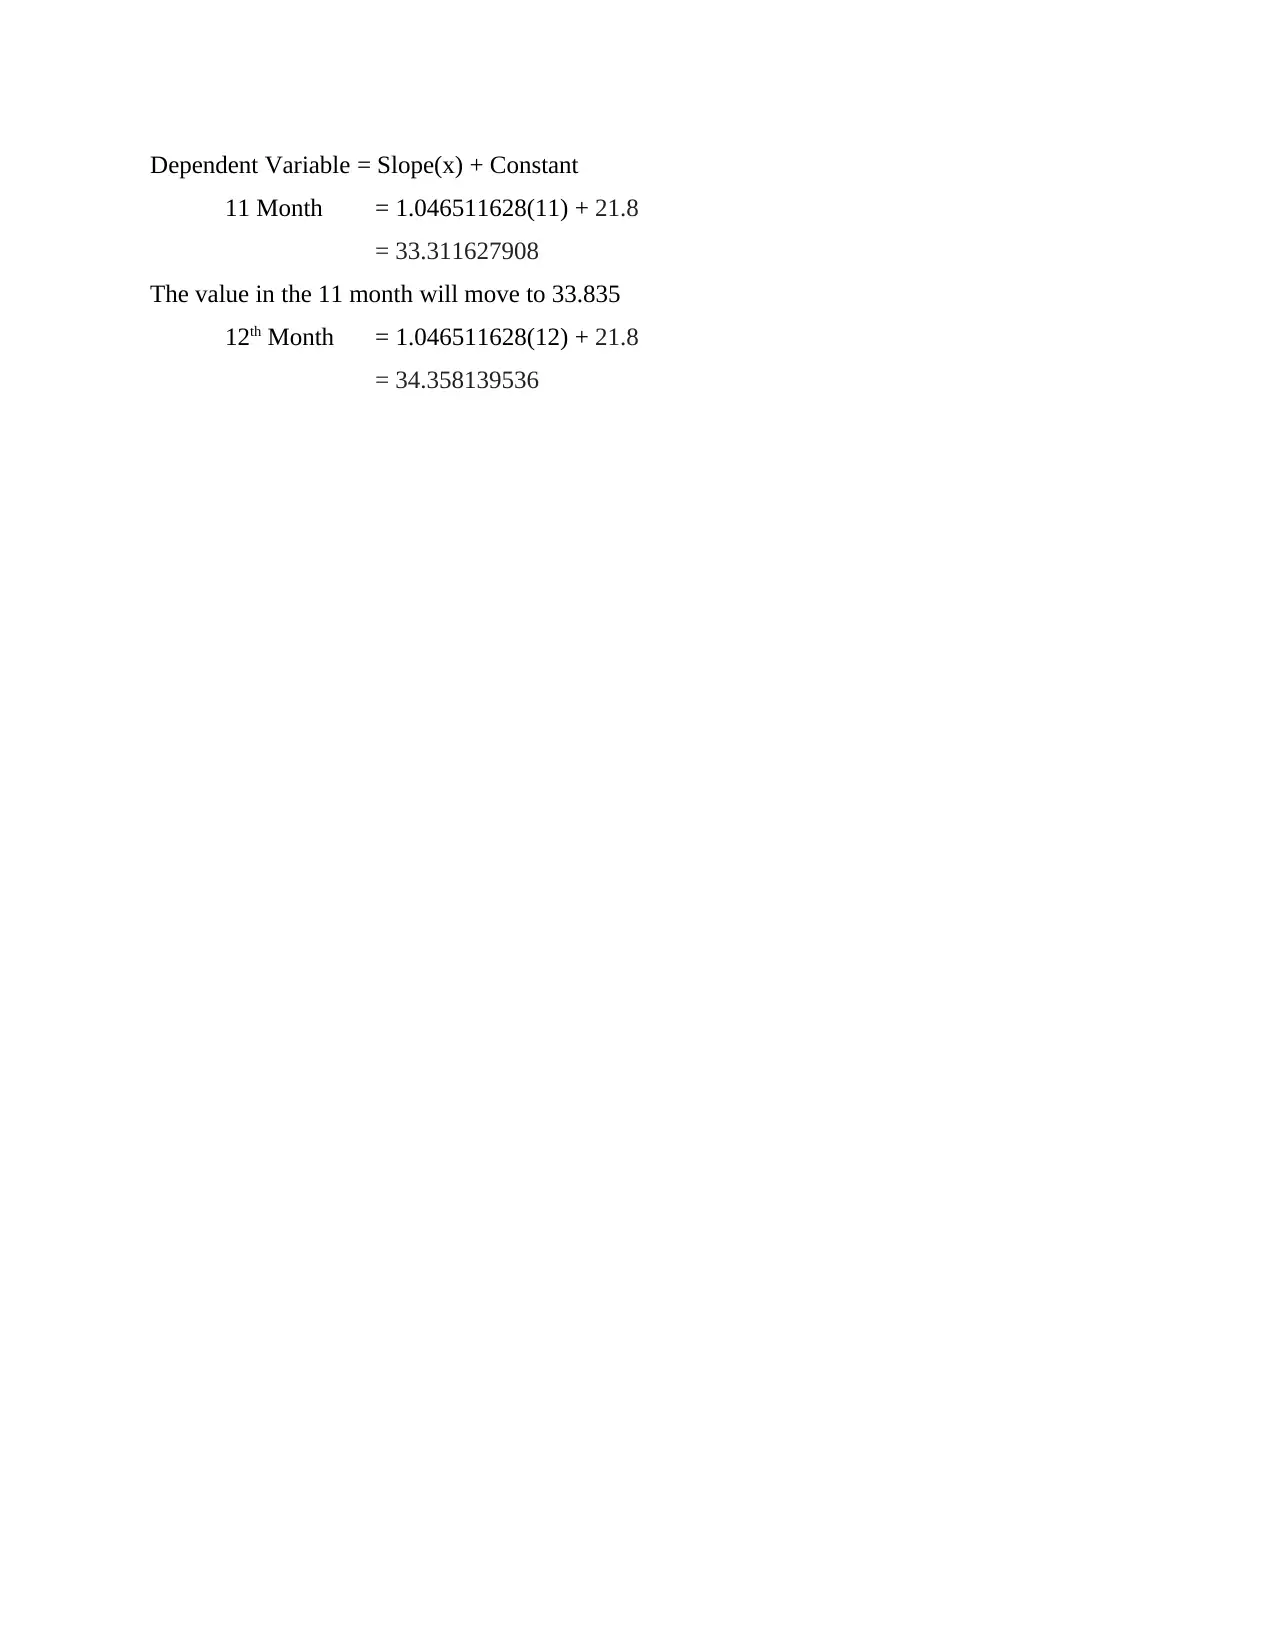
This report provides a detailed analysis of data using various statistical techniques. It begins with an introduction to the concepts of data analysis and forecasting, followed by a task section that presents a numerical dataset of monthly fuel expenditures. The report then delves into measures of central tendency, including mean, median, and mode, providing formulas and calculations for each. It also covers the range, standard deviation, and variance to assess data dispersion. Furthermore, the report applies linear regression for forecasting future values, explaining the slope and constant components of the model. Finally, the report includes a list of references used in the analysis.
Document Page
Data Analysis and
Forecasting
tabler-icon-diamond-filled.svg

Paraphrase This Document

Need a fresh take? Get an instant paraphrase of this document with our AI Paraphraser
Document Page
Table of Contents
INTRODUCTION...........................................................................................................................3
TASK ..............................................................................................................................................3
Measures of Central Tendency:..................................................................................................3
Range:.........................................................................................................................................5
Standard Deviation and Variance:..............................................................................................5
Liner Forecasting Model:............................................................................................................6
REFERENCES................................................................................................................................8
Document Page
INTRODUCTION
This report covers identification and application of various central tendency techniques
for summarising and analysing numerical data which will help in identification of authenticity in
the calculation of numerical figure and also in demonstration and analysis of techniques used for
forecasting. This report will focus on the measures of central tendency along with the use of
linear regression for forecasting. These points will be explained with the help of numerical
example.
TASK
To calculate the measures of central tendency and linear regression the following data has
been taken:
Monthly expenditure on fuel of an individual for 10 months:
25, 15, 20, 25, 18, 20, 20, 20, 22, 15.
Month Milk expenditure in GBP
1 25
2 15
3 20
4 25
5 18
6 20
7 20
8 25
9 22
10 10
Measures of Central Tendency:
Mean: Mean is one of a central tendency measure which calculates the average point of
the complete data set. Mean is further classified into different categories, namely; arithmetic,
Document Page
geometric and harmonic mean (Ali and et. al, 2020). Arithmetic mean is found out by adding the
numbers ( X) in the data set and dividing the sum with the total number of observations or
frequencies in the data set. It is the most commonly used measure of central tendency.
Formula of Arithmetic mean:
Mean (Individual series ) = (sum of all the values of an observation)/No. of observations
= ∑x / n {where x = value of an observation and n = number of
observations in the data}
Calculation of mean from the above data:
Mean = ∑x / n
= (25+15+20+25+18+20+20+20+22+15) / 10
= 200/10
= 20
20 GBP is the Mean or average per month expenditure on fuel.
Median: Median identifies the mid-value of a statistically discrete data series. In simple
terms, medians bifurcates the complete data set in two parts with almost equal number of values.
One of these parts has values less than or equal to the median and the other part has values
greater than or equal to the median (Okakwu and et. Al, 2019).
Formula of Median:
Individual series:
when the number of observations are odd:
M= Size of [(N+1)/2]th term { where n = number of observations}
when the number of observations are even:
M = [Size of [(N/2)]th term + Size of [(N/2)+1]th term]/2 { where n = number of observations}
Calculation of Median from the following data:
25, 15, 20, 25, 18, 20, 20, 20, 22, 15.
Ascending order: 15, 15, 18, 20, 20, 20, 20, 22, 25, 25
Median = [(N/2)th term+(N/2)+1th term]/2
= [(10/2)th term]+[(10/2)+1th term]/2
= [5th term+6th term]/2
= (20+20)/2
= 20
tabler-icon-diamond-filled.svg

Paraphrase This Document

Need a fresh take? Get an instant paraphrase of this document with our AI Paraphraser
Document Page
From this calculation it can be said that 20 is the median of the above data.
Mode: It refers to the value which occurs the maximum number of time or has the
maximum frequency in the data set.
Mode = the data with the highest number of frequency
Expense Frequency
15 2
18 1
20 4
22 1
25 2
The above table shows that 20 has the highest frequency. So it can be said that 20 is the mode of
the above data set.
Range:
Range is the difference of the upper limit and lower limit of the complete data set or the Class
Interval in a frequency or continuous series (Zhang and et. al, 2020). For example if we arrange
the above data in frequency distribution format it would be like:
Expense Frequency
15-20 3
20-25 7
Range of every class interval can be found out by subtracting the lower limit of the C.I. From the
upper limit. For example range of C.I. 15-20 is = 20-15 = 5. And the range of complete data set
is 25-15 = 10.
Standard Deviation and Variance:
Standard deviation is the measure of dispersion used to calculate dispersion of the data from its
mean. It measures the variance or variability of mean due to the use of different methods.
Standard Deviation of Individual series = √(∑x2/N)
Document Page
Variance = ∑x2/N
Month Milk expenditure
in GBP
x2
1 25 625
2 15 225
3 20 400
4 25 625
5 18 324
6 20 400
7 20 400
8 20 400
9 22 484
10 15 225
Total 4108
Standard Deviation = √(4108/10)
= 20.268201696
Variance = (Standard Deviation)2
= 410.8
Liner Forecasting Model:
Linear regression is a statistical tool which is used for predicting the future values from
the given past values. It uses a trend line plotted on a chart.
Month (X) Expense (Y) X*Y X2 Y2
1 25 25 1 625
2 15 30 4 225
Document Page
3 20 60 9 400
4 25 100 16 625
5 18 90 25 324
6 20 120 36 400
7 20 140 49 400
8 20 160 64 400
9 22 198 81 484
10 15 150 100 225
Total 200 1073 385 4108
Y = Mx +C
Y = Slope(x) + Constant
Slope ( m): Slope is part of regression which is used to identify the slope in the data
(Poirier and et. al, 2020). It is used to calculate the rise or fall of the data and also the rate by
which it changes. In the above data it can be seen that the rate of change is negative which
implies the movement of data towards the negative side or simply it has a negative slope.
Constant (c) = Constant is also a part of linear regression which helps in visualizing a
constant point in the data. It is the point where the regression line intersects the Y axis, it is also
known as Y intercept. From the above data it can be said that the constant is
Slope = n(∑xy)-(∑y)(∑x)/ n(∑x)-(∑x)
= 10(1073)-(200)(55) / 10(385)-(4108)
= 10730 – 11000 / 3850-4108
= - 270/ -258
= 1.046511628
Constant(C) = (∑y)(∑x)- (∑x)(∑xy)/n(∑x)-(∑x)
= (200)(385)- (55)(1073)/10(385)-(55)2
= 77000 – 59015/ 3850 – 3025
= 17985 / 825
= 21.8
tabler-icon-diamond-filled.svg

Paraphrase This Document

Need a fresh take? Get an instant paraphrase of this document with our AI Paraphraser
Document Page
Dependent Variable = Slope(x) + Constant
11 Month = 1.046511628(11) + 21.8
= 33.311627908
The value in the 11 month will move to 33.835
12th Month = 1.046511628(12) + 21.8
= 34.358139536
Document Page
REFERENCES
Books and Journals
Ali, M. and et. al, 2020. Forecasting long-term precipitation for water resource management: a
new multi-step data-intelligent modelling approach. Hydrological Sciences Journal.
65(16). pp.2693-2708.
Okakwu, I. K. and et. al, 2019. A comparative study of time series analysis for forecasting
energy demand in Nigeria. Nigerian Journal of Technology. 38(2). pp.465-469.
Zhang, B. and et. al, 2020. Backwash sequence optimization of a pilot-scale ultrafiltration
membrane system using data-driven modeling for parameter forecasting. Journal of
Membrane Science. 612. p.118464.
Poirier, C. and et. al, 2020. Real-time forecasting of the COVID-19 outbreak in Chinese
provinces: machine learning approach using novel digital data and estimates from
mechanistic models. Journal of medical Internet research. 22(8). p.e20285.
chevron_up_icon
1 out of 9
circle_padding
hide_on_mobile
zoom_out_icon
[object Object]