Numeracy and Data Analysis: Monthly Data and Forecasting Report
VerifiedAdded on 2022/12/14
|12
|1400
|495
Report
AI Summary
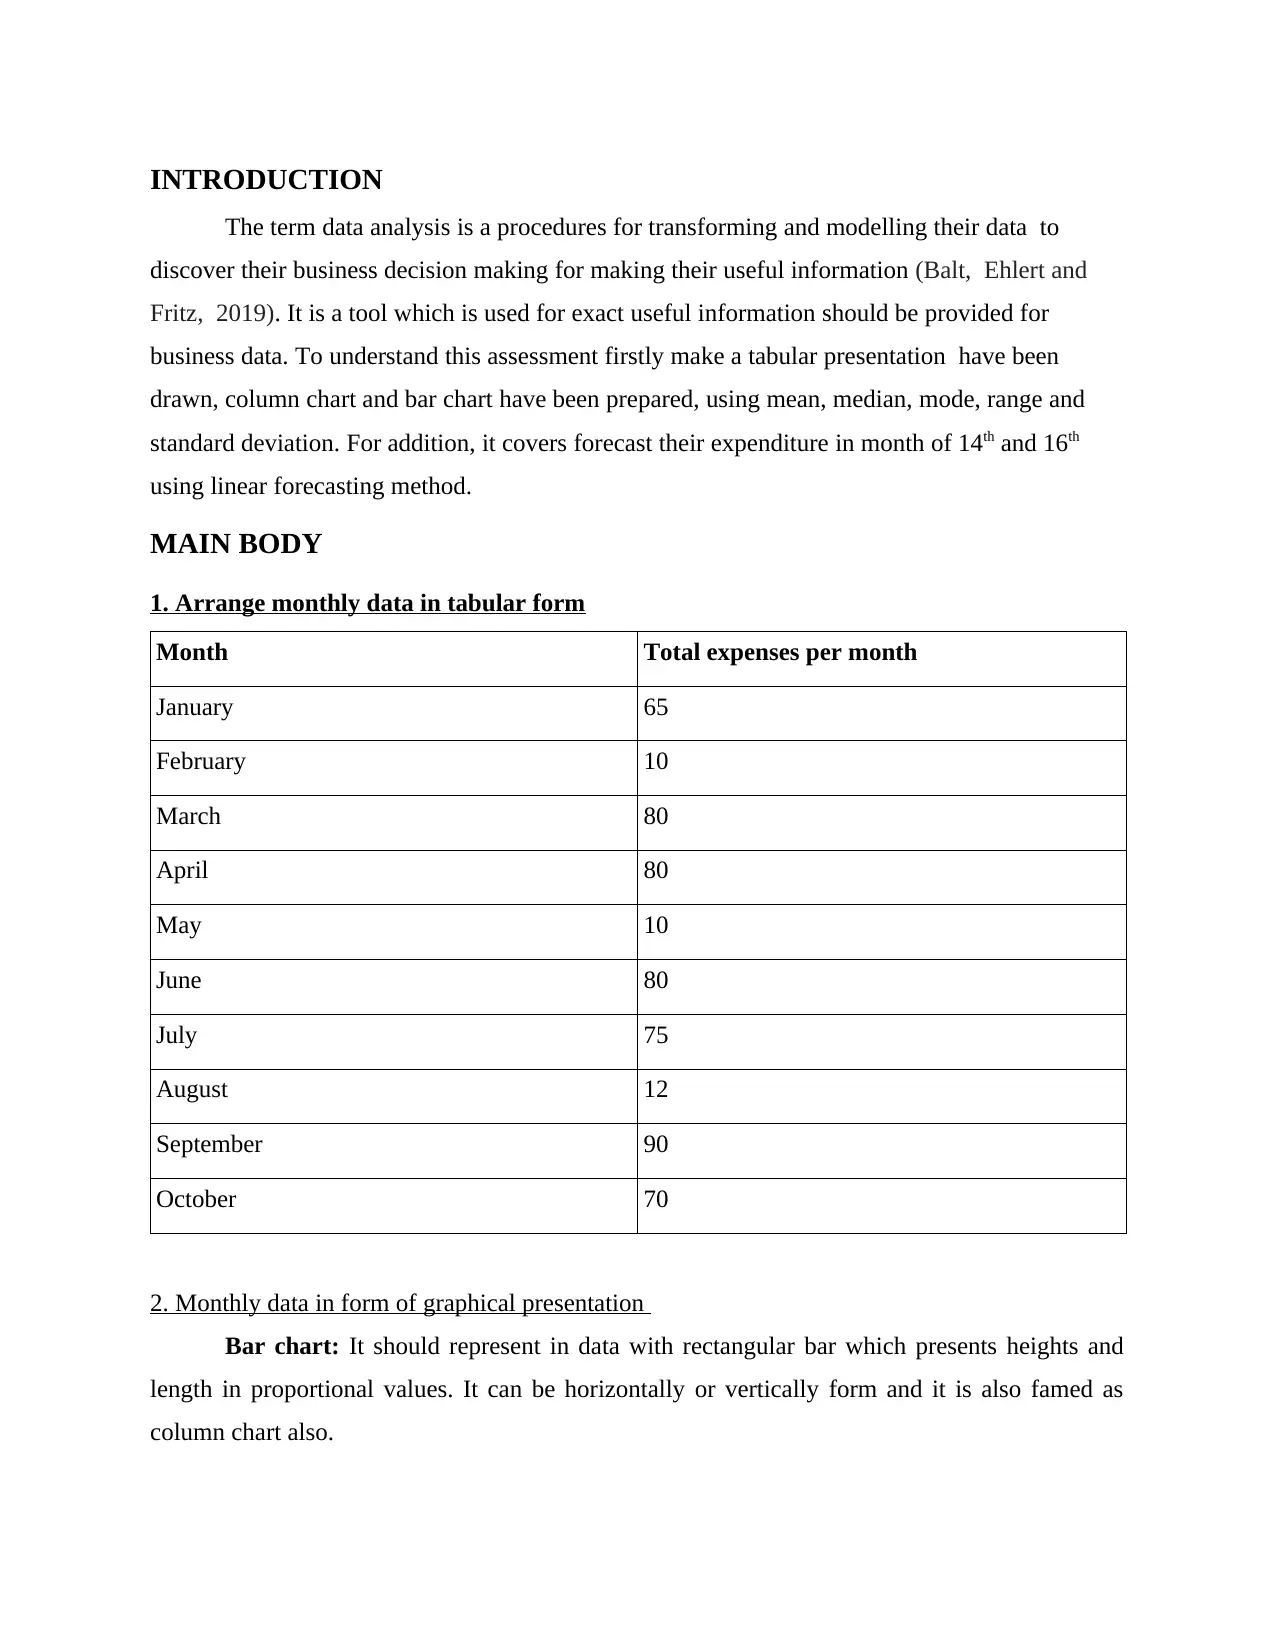
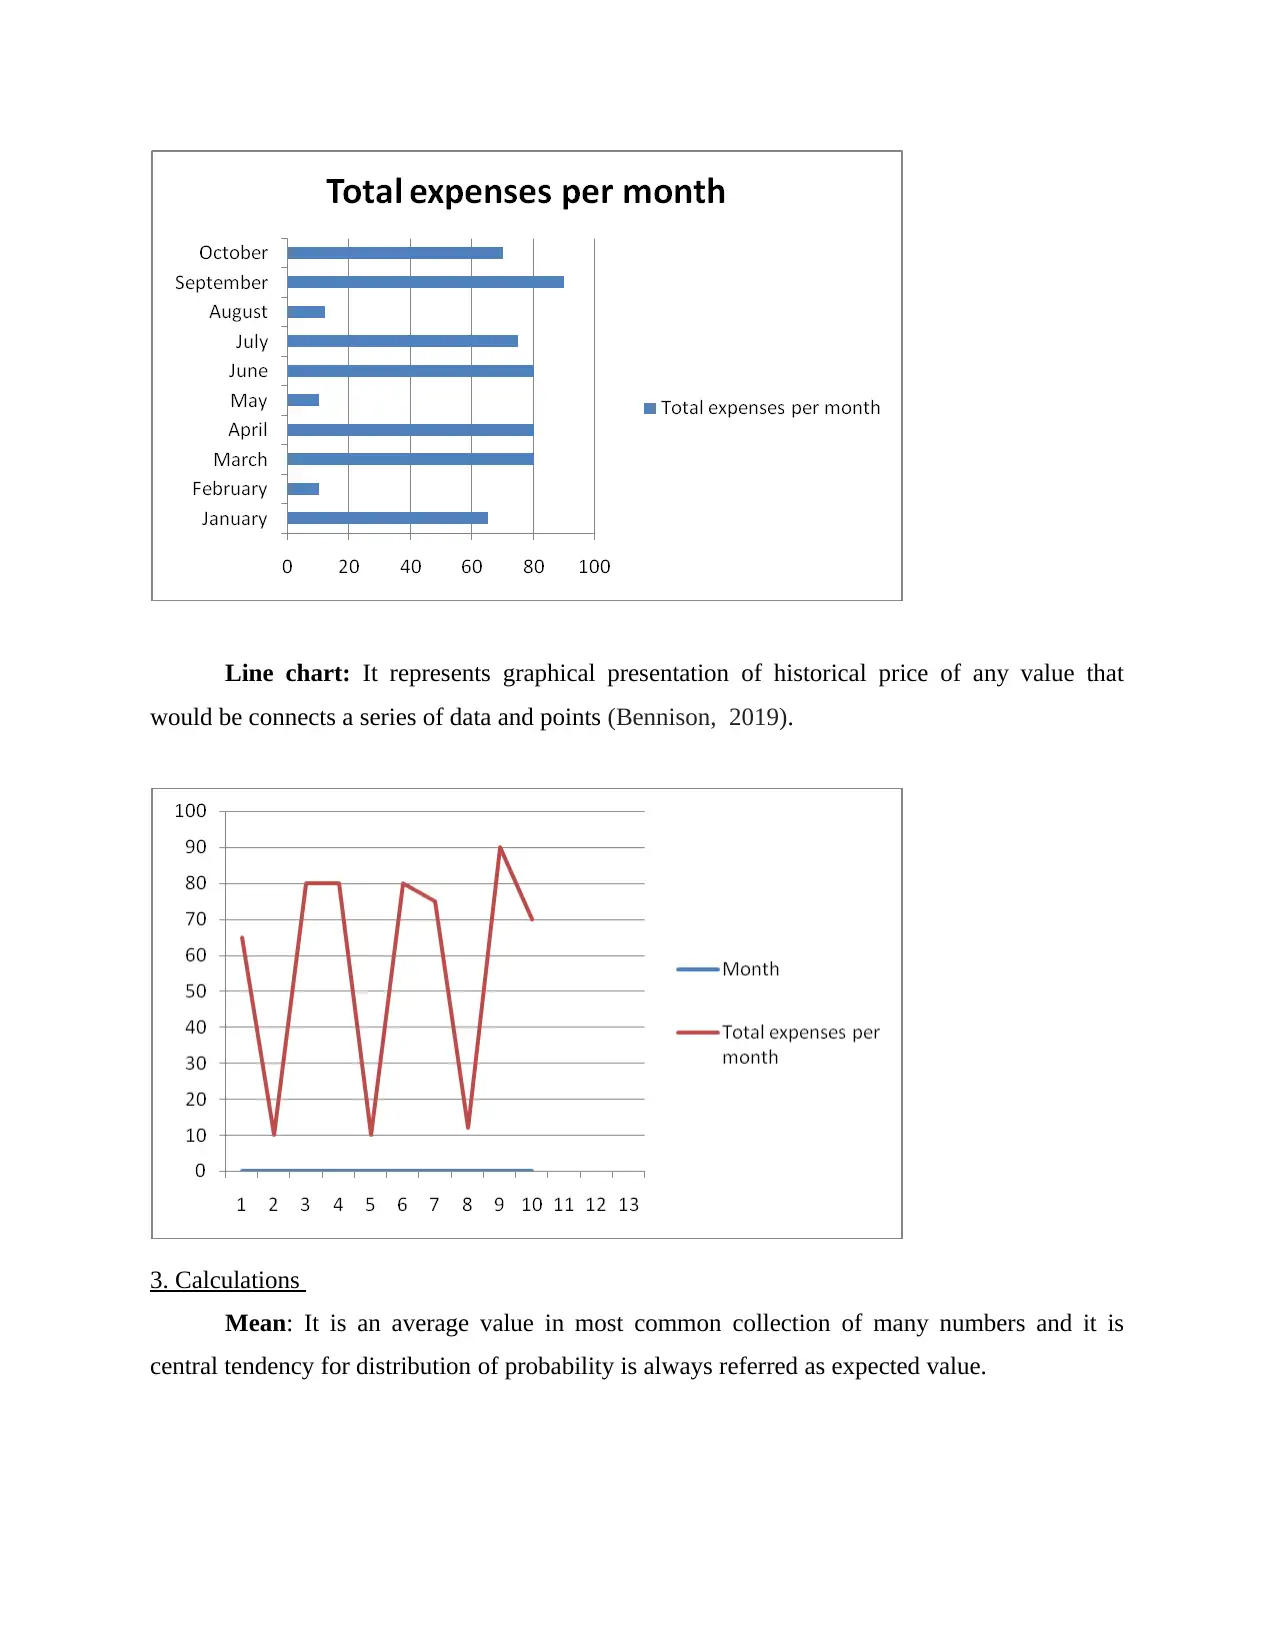
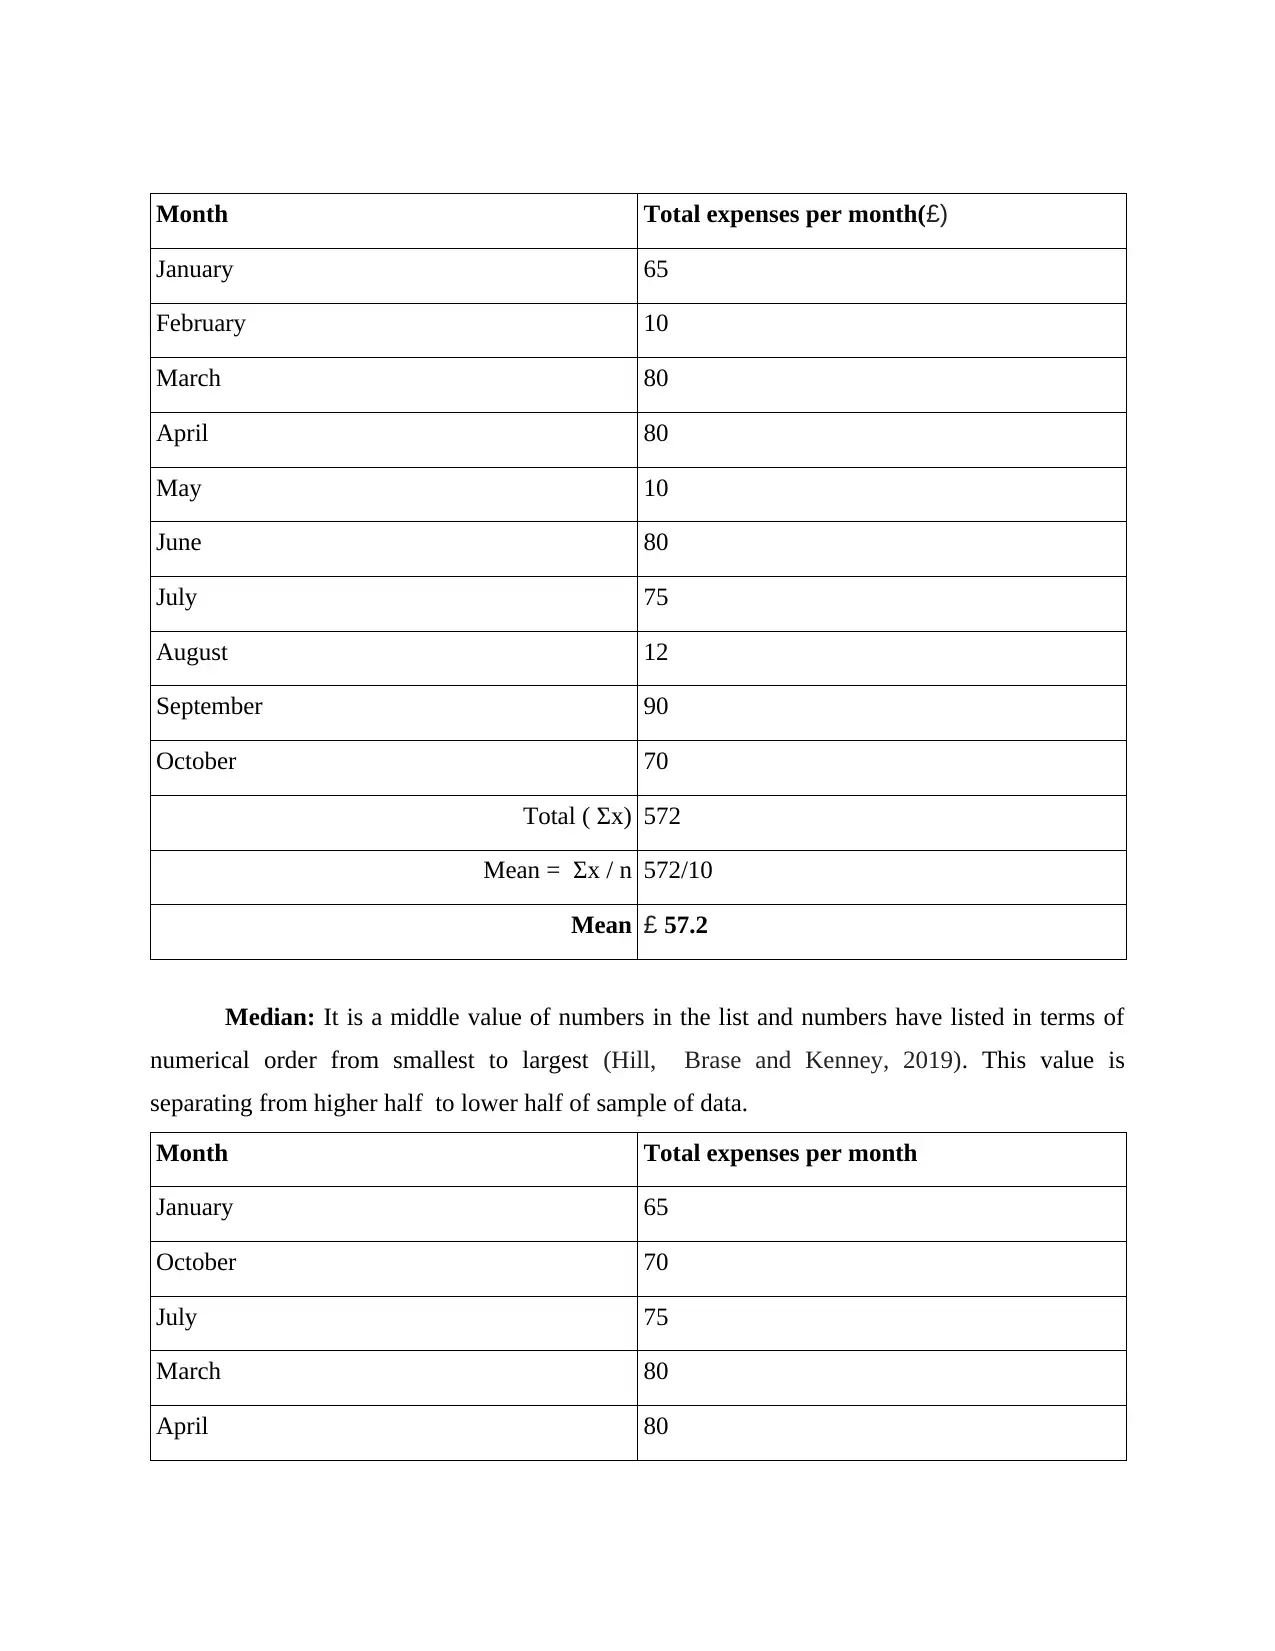
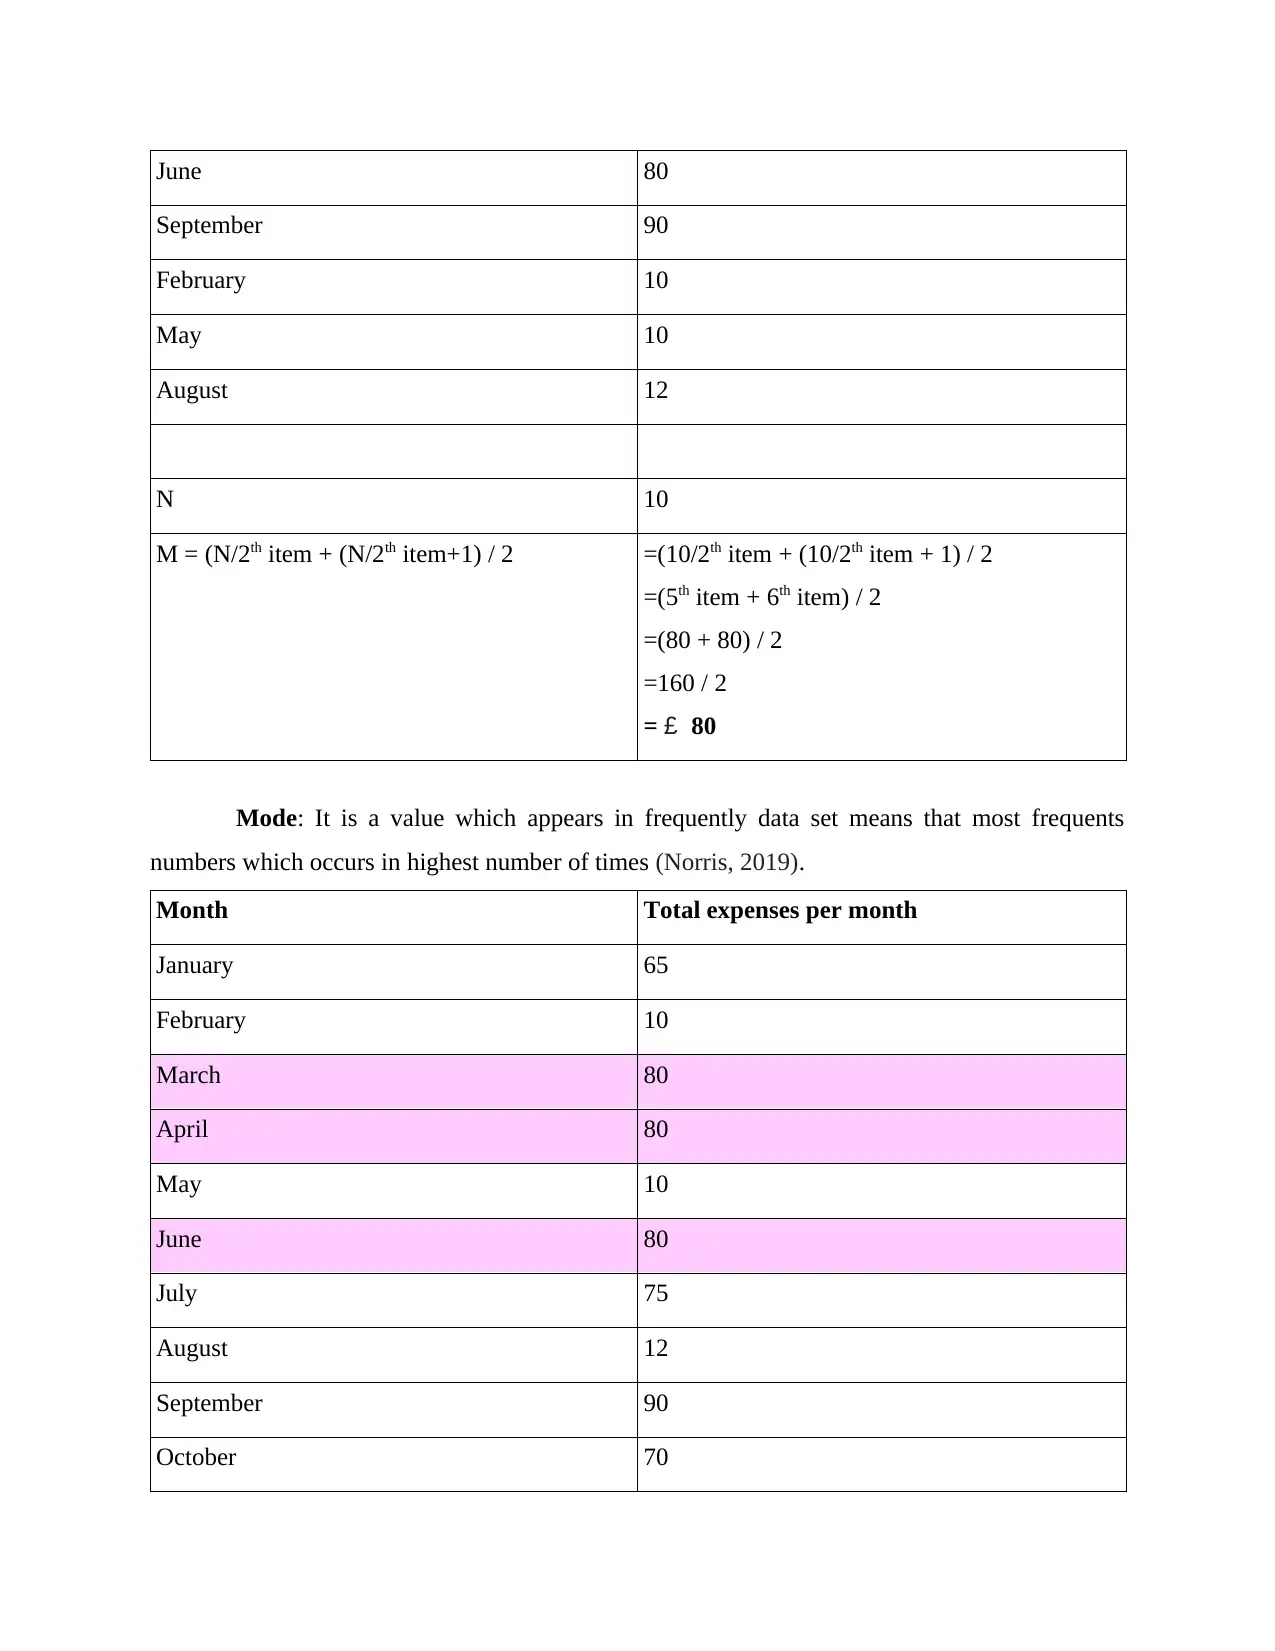
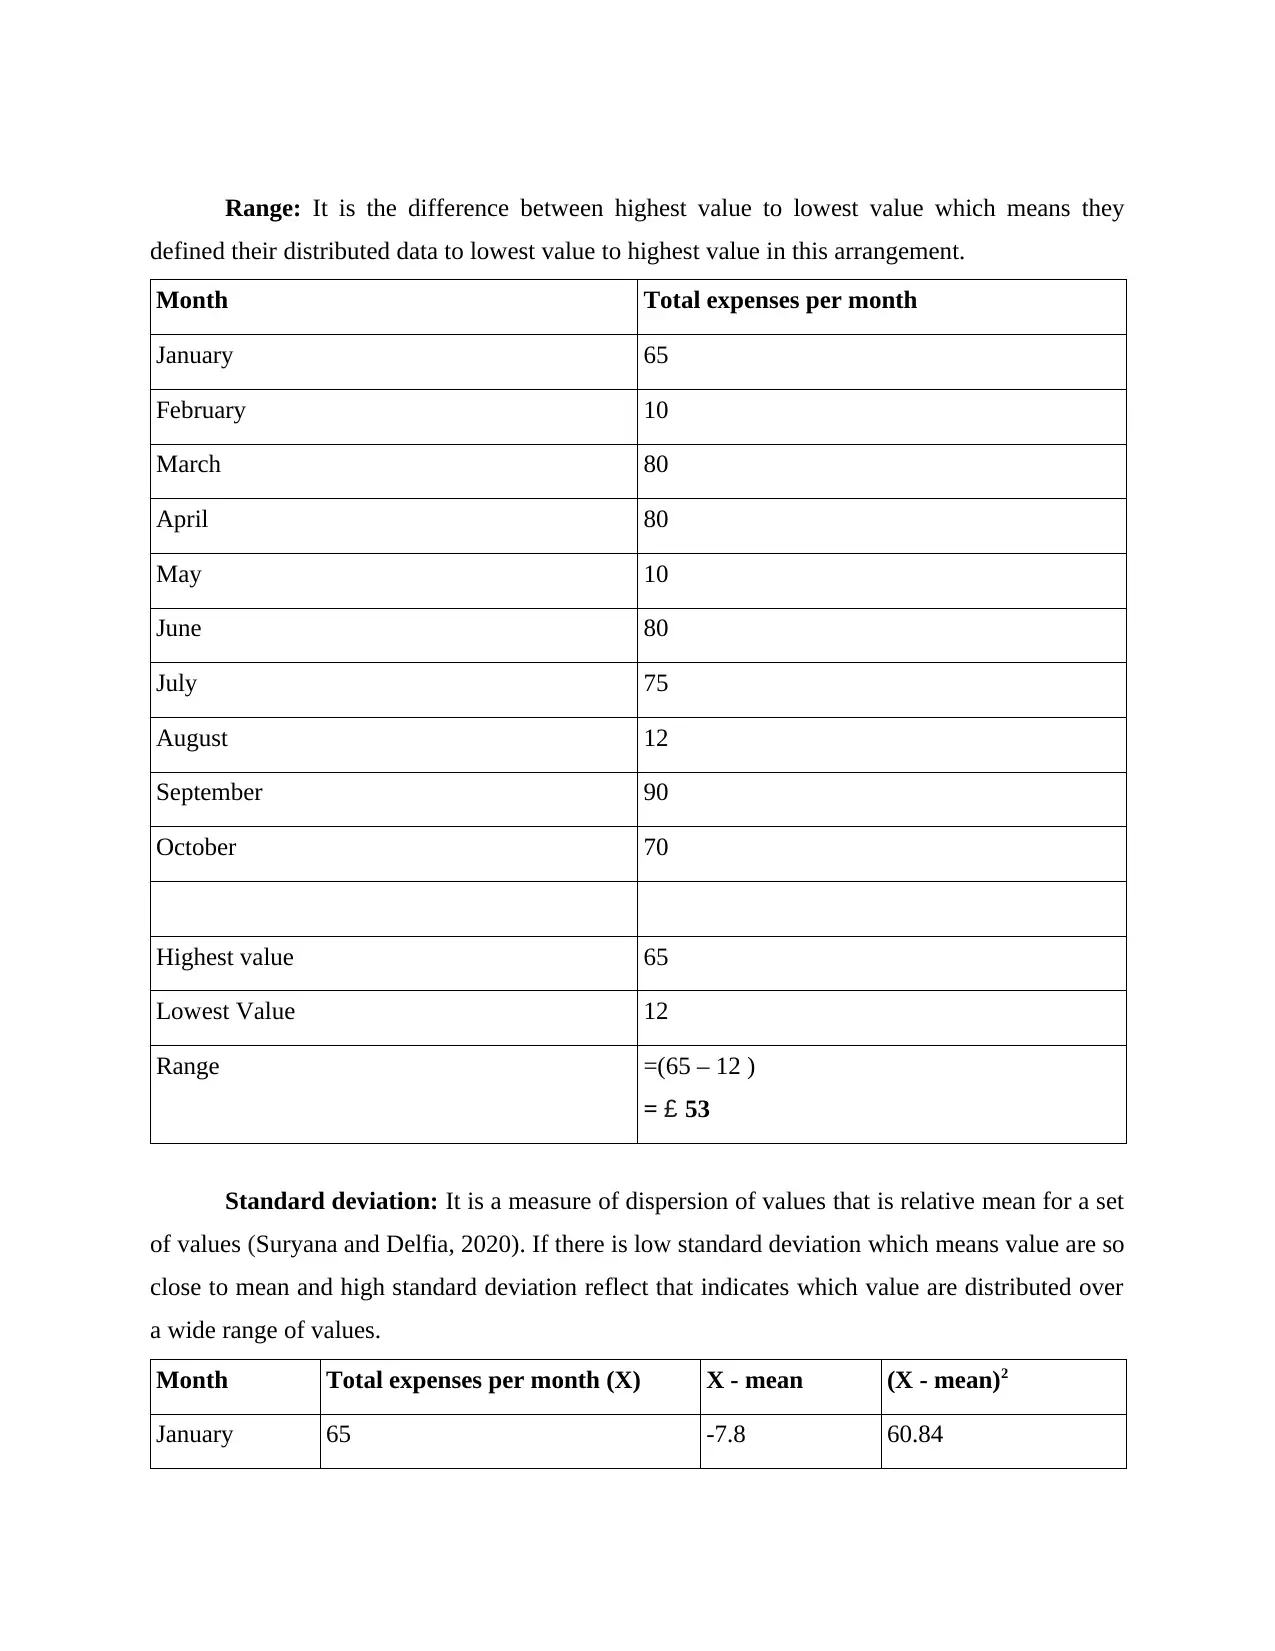
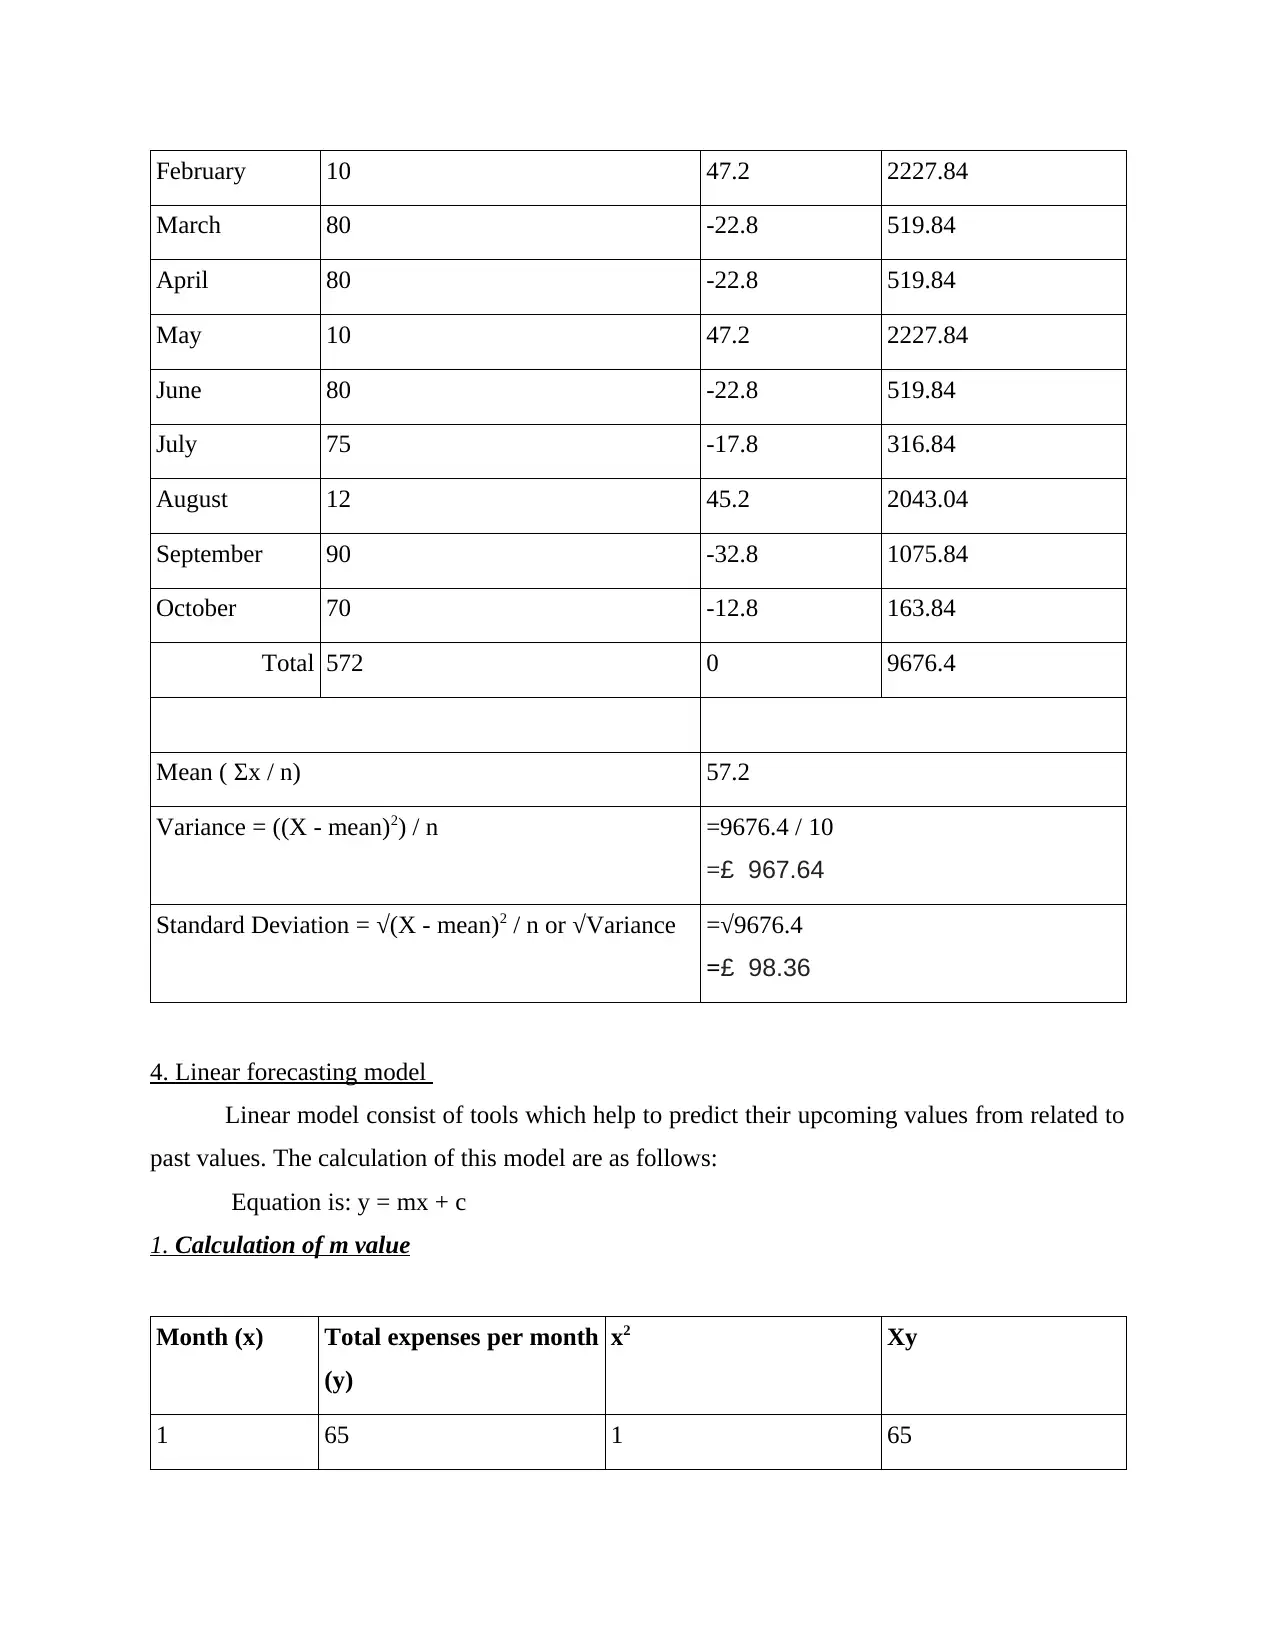
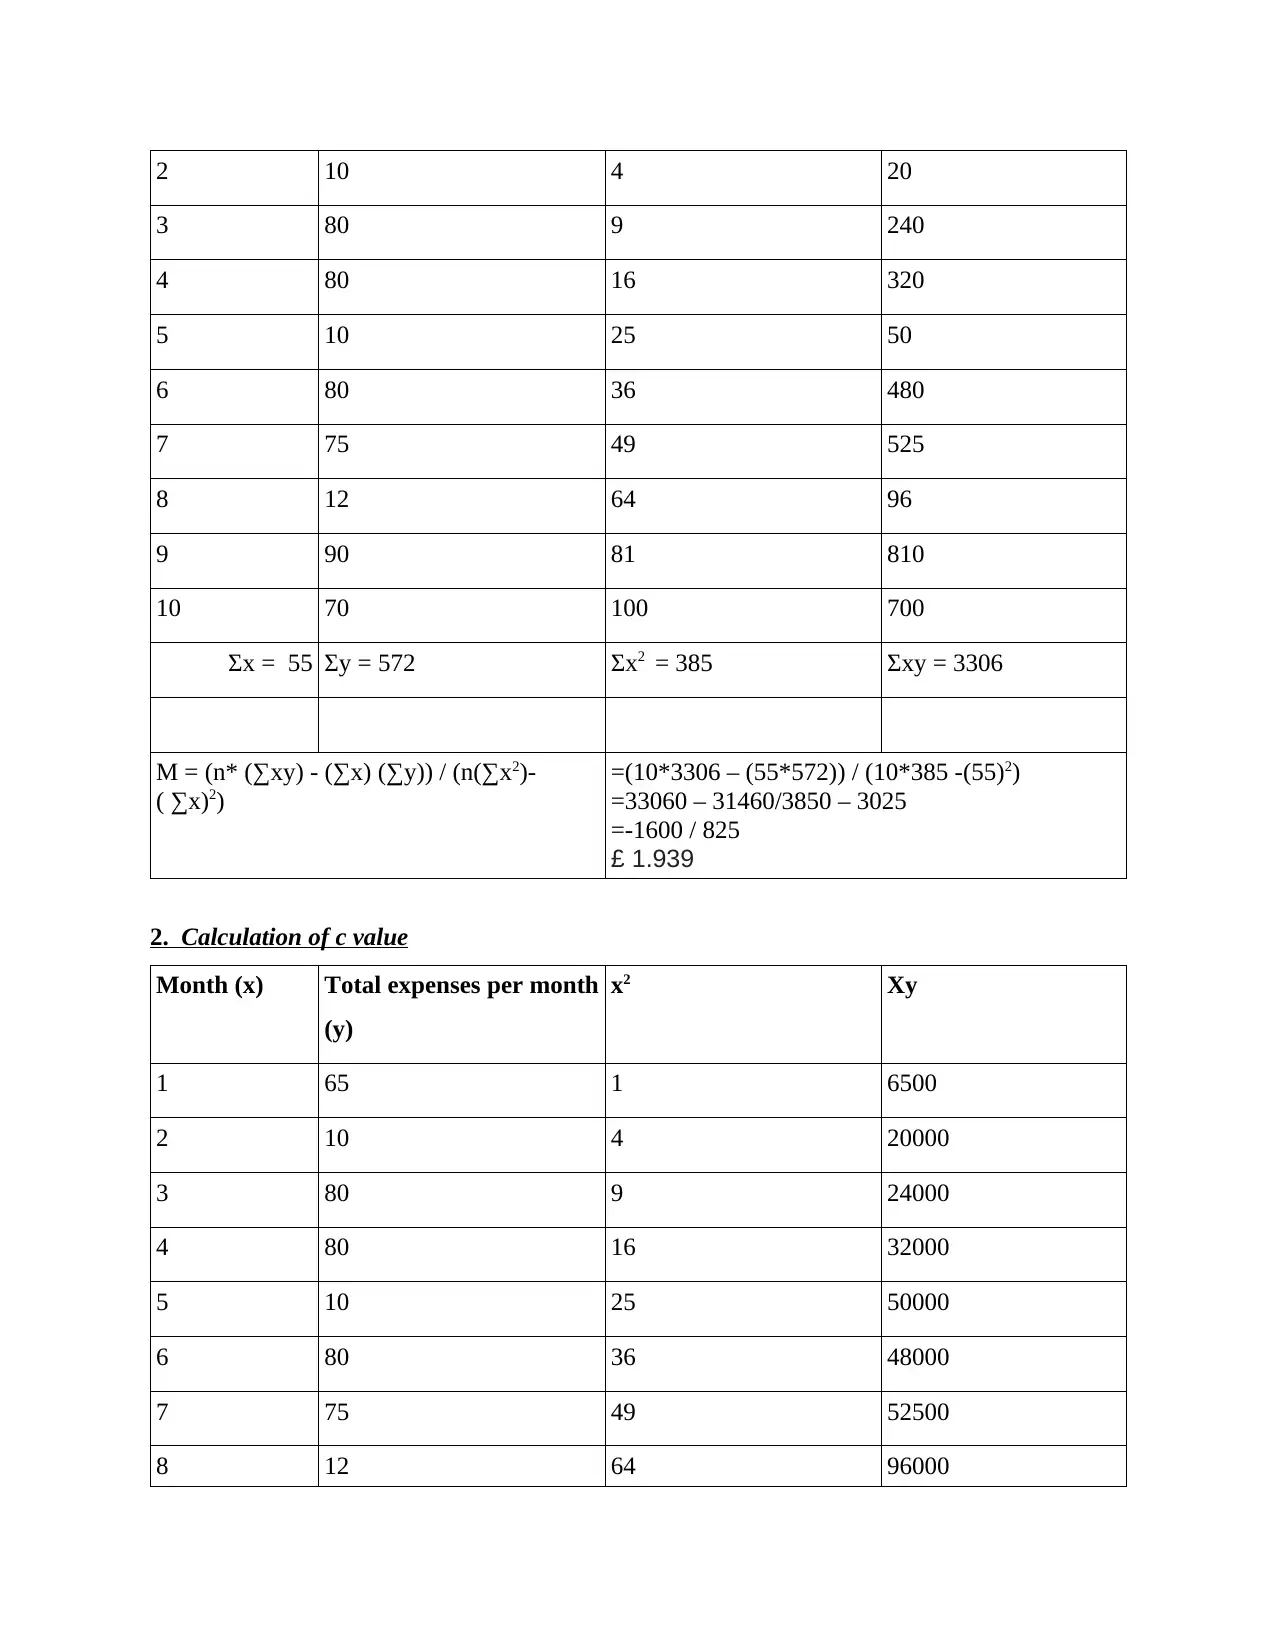
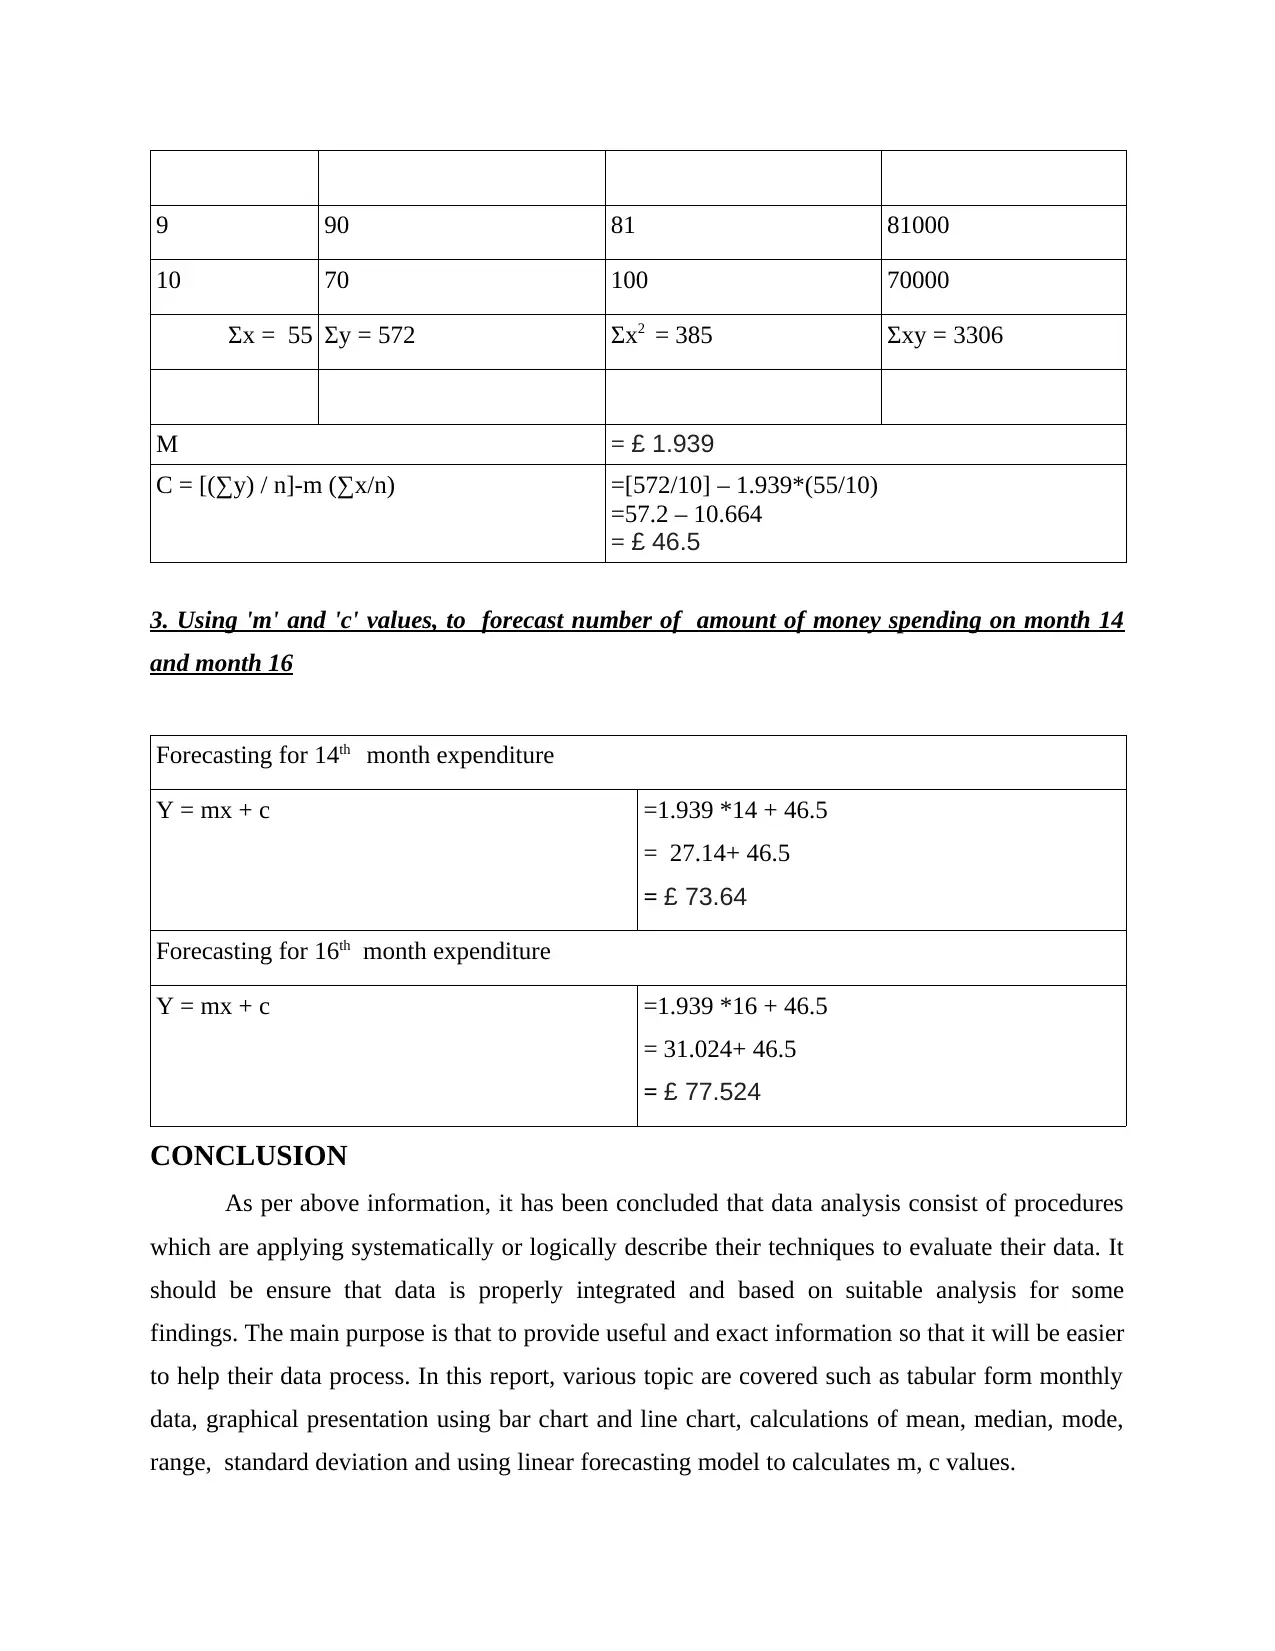
This report provides a comprehensive analysis of monthly data, encompassing tabular presentations, graphical representations (bar and line charts), and statistical calculations including mean, median, mode, range, and standard deviation. The core objective is to analyze monthly expenses, and the report also incorporates a linear forecasting model to predict future expenditures for the 14th and 16th months. The methodology involves arranging data, creating visual aids, and applying statistical techniques to derive meaningful insights. The report concludes by summarizing the findings and emphasizing the importance of data analysis in business decision-making. References to relevant sources support the analysis, demonstrating a strong understanding of data analysis principles and practical application.

Numeracy and
Data Analysis
Data Analysis
Paraphrase This Document
Need a fresh take? Get an instant paraphrase of this document with our AI Paraphraser

Table of Contents
INTRODUCTION...........................................................................................................................3
MAIN BODY...................................................................................................................................3
1. Arrange monthly data in tabular form.....................................................................................3
2. Monthly data in form of graphical presentation .....................................................................3
3. Calculations .............................................................................................................................4
4. Linear forecasting model ........................................................................................................7
CONCLUSION................................................................................................................................9
REFERENCES .............................................................................................................................10

INTRODUCTION
The term data analysis is a procedures for transforming and modelling their data to
discover their business decision making for making their useful information (Balt, Ehlert and
Fritz, 2019). It is a tool which is used for exact useful information should be provided for
business data. To understand this assessment firstly make a tabular presentation have been
drawn, column chart and bar chart have been prepared, using mean, median, mode, range and
standard deviation. For addition, it covers forecast their expenditure in month of 14th and 16th
using linear forecasting method.
MAIN BODY
1. Arrange monthly data in tabular form
Month Total expenses per month
January 65
February 10
March 80
April 80
May 10
June 80
July 75
August 12
September 90
October 70
2. Monthly data in form of graphical presentation
Bar chart: It should represent in data with rectangular bar which presents heights and
length in proportional values. It can be horizontally or vertically form and it is also famed as
column chart also.
⊘ This is a preview!⊘
Do you want full access?
Subscribe today to unlock all pages.

Trusted by 1+ million students worldwide

Line chart: It represents graphical presentation of historical price of any value that
would be connects a series of data and points (Bennison, 2019).
3. Calculations
Mean: It is an average value in most common collection of many numbers and it is
central tendency for distribution of probability is always referred as expected value.
would be connects a series of data and points (Bennison, 2019).
3. Calculations
Mean: It is an average value in most common collection of many numbers and it is
central tendency for distribution of probability is always referred as expected value.
Paraphrase This Document
Need a fresh take? Get an instant paraphrase of this document with our AI Paraphraser

Month Total expenses per month(£)
January 65
February 10
March 80
April 80
May 10
June 80
July 75
August 12
September 90
October 70
Total ( Σx) 572
Mean = Σx / n 572/10
Mean £ 57.2
Median: It is a middle value of numbers in the list and numbers have listed in terms of
numerical order from smallest to largest (Hill, Brase and Kenney, 2019). This value is
separating from higher half to lower half of sample of data.
Month Total expenses per month
January 65
October 70
July 75
March 80
April 80
January 65
February 10
March 80
April 80
May 10
June 80
July 75
August 12
September 90
October 70
Total ( Σx) 572
Mean = Σx / n 572/10
Mean £ 57.2
Median: It is a middle value of numbers in the list and numbers have listed in terms of
numerical order from smallest to largest (Hill, Brase and Kenney, 2019). This value is
separating from higher half to lower half of sample of data.
Month Total expenses per month
January 65
October 70
July 75
March 80
April 80

June 80
September 90
February 10
May 10
August 12
N 10
M = (N/2th item + (N/2th item+1) / 2 =(10/2th item + (10/2th item + 1) / 2
=(5th item + 6th item) / 2
=(80 + 80) / 2
=160 / 2
= £ 80
Mode: It is a value which appears in frequently data set means that most frequents
numbers which occurs in highest number of times (Norris, 2019).
Month Total expenses per month
January 65
February 10
March 80
April 80
May 10
June 80
July 75
August 12
September 90
October 70
September 90
February 10
May 10
August 12
N 10
M = (N/2th item + (N/2th item+1) / 2 =(10/2th item + (10/2th item + 1) / 2
=(5th item + 6th item) / 2
=(80 + 80) / 2
=160 / 2
= £ 80
Mode: It is a value which appears in frequently data set means that most frequents
numbers which occurs in highest number of times (Norris, 2019).
Month Total expenses per month
January 65
February 10
March 80
April 80
May 10
June 80
July 75
August 12
September 90
October 70
⊘ This is a preview!⊘
Do you want full access?
Subscribe today to unlock all pages.

Trusted by 1+ million students worldwide

Range: It is the difference between highest value to lowest value which means they
defined their distributed data to lowest value to highest value in this arrangement.
Month Total expenses per month
January 65
February 10
March 80
April 80
May 10
June 80
July 75
August 12
September 90
October 70
Highest value 65
Lowest Value 12
Range =(65 – 12 )
= £ 53
Standard deviation: It is a measure of dispersion of values that is relative mean for a set
of values (Suryana and Delfia, 2020). If there is low standard deviation which means value are so
close to mean and high standard deviation reflect that indicates which value are distributed over
a wide range of values.
Month Total expenses per month (X) X - mean (X - mean)2
January 65 -7.8 60.84
Paraphrase This Document
Need a fresh take? Get an instant paraphrase of this document with our AI Paraphraser

February 10 47.2 2227.84
March 80 -22.8 519.84
April 80 -22.8 519.84
May 10 47.2 2227.84
June 80 -22.8 519.84
July 75 -17.8 316.84
August 12 45.2 2043.04
September 90 -32.8 1075.84
October 70 -12.8 163.84
Total 572 0 9676.4
Mean ( Σx / n) 57.2
Variance = ((X - mean)2) / n =9676.4 / 10
=£ 967.64
Standard Deviation = √(X - mean)2 / n or √Variance =√9676.4
=£ 98.36
4. Linear forecasting model
Linear model consist of tools which help to predict their upcoming values from related to
past values. The calculation of this model are as follows:
Equation is: y = mx + c
1. Calculation of m value
Month (x) Total expenses per month
(y)
x2 Xy
1 65 1 65

2 10 4 20
3 80 9 240
4 80 16 320
5 10 25 50
6 80 36 480
7 75 49 525
8 12 64 96
9 90 81 810
10 70 100 700
Σx = 55 Σy = 572 Σx2 = 385 Σxy = 3306
M = (n* (∑xy) - (∑x) (∑y)) / (n(∑x2)-
( ∑x)2)
=(10*3306 – (55*572)) / (10*385 -(55)2)
=33060 – 31460/3850 – 3025
=-1600 / 825
£ 1.939
2. Calculation of c value
Month (x) Total expenses per month
(y)
x2 Xy
1 65 1 6500
2 10 4 20000
3 80 9 24000
4 80 16 32000
5 10 25 50000
6 80 36 48000
7 75 49 52500
8 12 64 96000
⊘ This is a preview!⊘
Do you want full access?
Subscribe today to unlock all pages.

Trusted by 1+ million students worldwide

9 90 81 81000
10 70 100 70000
Σx = 55 Σy = 572 Σx2 = 385 Σxy = 3306
M = £ 1.939
C = [(∑y) / n]-m (∑x/n) =[572/10] – 1.939*(55/10)
=57.2 – 10.664
= £ 46.5
3. Using 'm' and 'c' values, to forecast number of amount of money spending on month 14
and month 16
Forecasting for 14th month expenditure
Y = mx + c =1.939 *14 + 46.5
= 27.14+ 46.5
= £ 73.64
Forecasting for 16th month expenditure
Y = mx + c =1.939 *16 + 46.5
= 31.024+ 46.5
= £ 77.524
CONCLUSION
As per above information, it has been concluded that data analysis consist of procedures
which are applying systematically or logically describe their techniques to evaluate their data. It
should be ensure that data is properly integrated and based on suitable analysis for some
findings. The main purpose is that to provide useful and exact information so that it will be easier
to help their data process. In this report, various topic are covered such as tabular form monthly
data, graphical presentation using bar chart and line chart, calculations of mean, median, mode,
range, standard deviation and using linear forecasting model to calculates m, c values.
Paraphrase This Document
Need a fresh take? Get an instant paraphrase of this document with our AI Paraphraser


REFERENCES
Books and Journals
Balt, M., Ehlert, A. and Fritz, A., 2019. Assessment in Inclusive Mathematics Education:
Approaches to Designing Progress Assessments for Numeracy Learning. In Inclusive
mathematics education (pp. 197-216). Springer, Cham.
Bennison, A., 2019. Numeracy across the Curriculum in Initial Teacher Education. Mathematics
Education Research Group of Australasia.
Hill, W. T., Brase, G. L. and Kenney, K. L., 2019. Developing a better and more user-friendly
numeracy scale for patients. HLRP: Health Literacy Research and Practice. 3(3).
pp.e174-e180.
Norris, S., 2019. Systematically working with multimodal data: Research methods in multimodal
discourse analysis. John Wiley & Sons.
Suryana, D. and Delfia, E., 2020, July. Implementation of Children’s Numerical Skill Learning
Activity in Early Childhood Education. In International Conference of Early Childhood
Education (ICECE 2019) (pp. 20-25). Atlantis Press.
⊘ This is a preview!⊘
Do you want full access?
Subscribe today to unlock all pages.

Trusted by 1+ million students worldwide
1 out of 12