Data Analysis and Forecasting Report: Data Analysis Methods
VerifiedAdded on 2022/12/27
|10
|1395
|83
Report
AI Summary
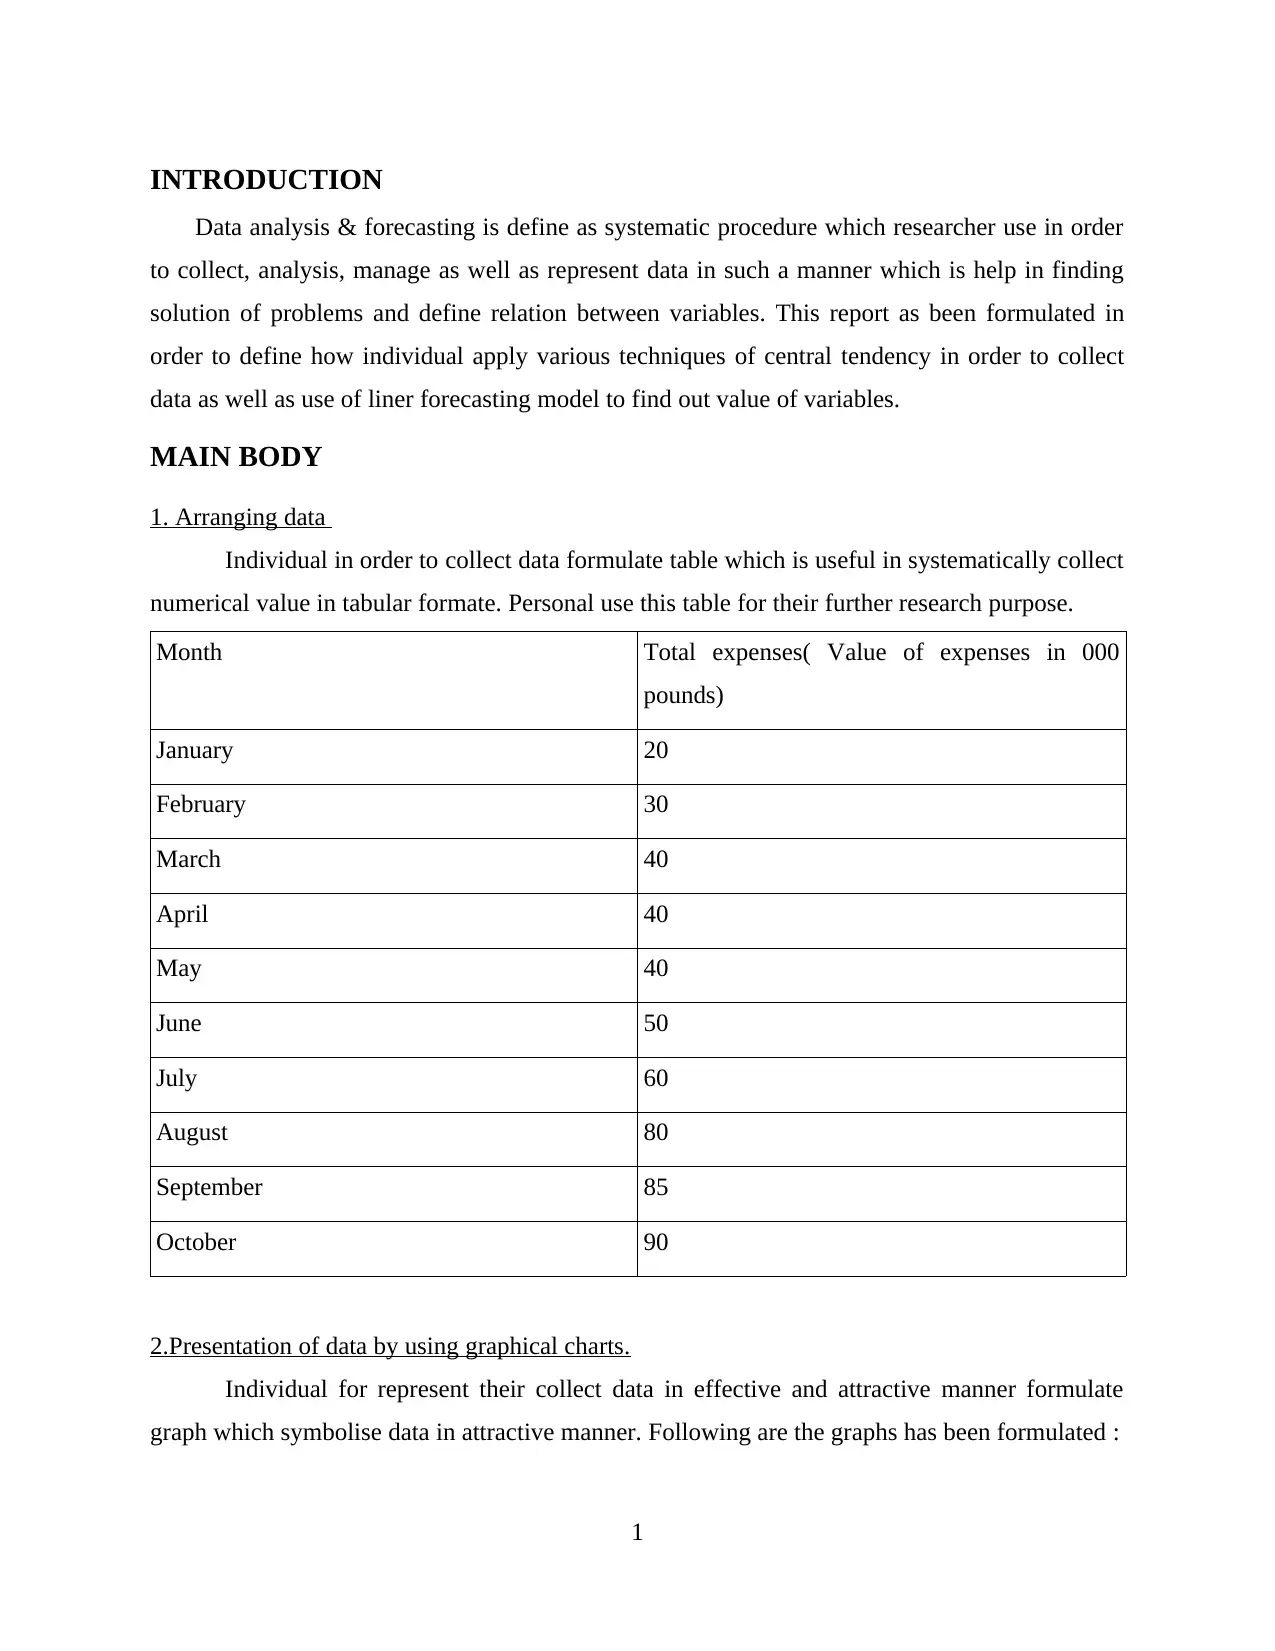
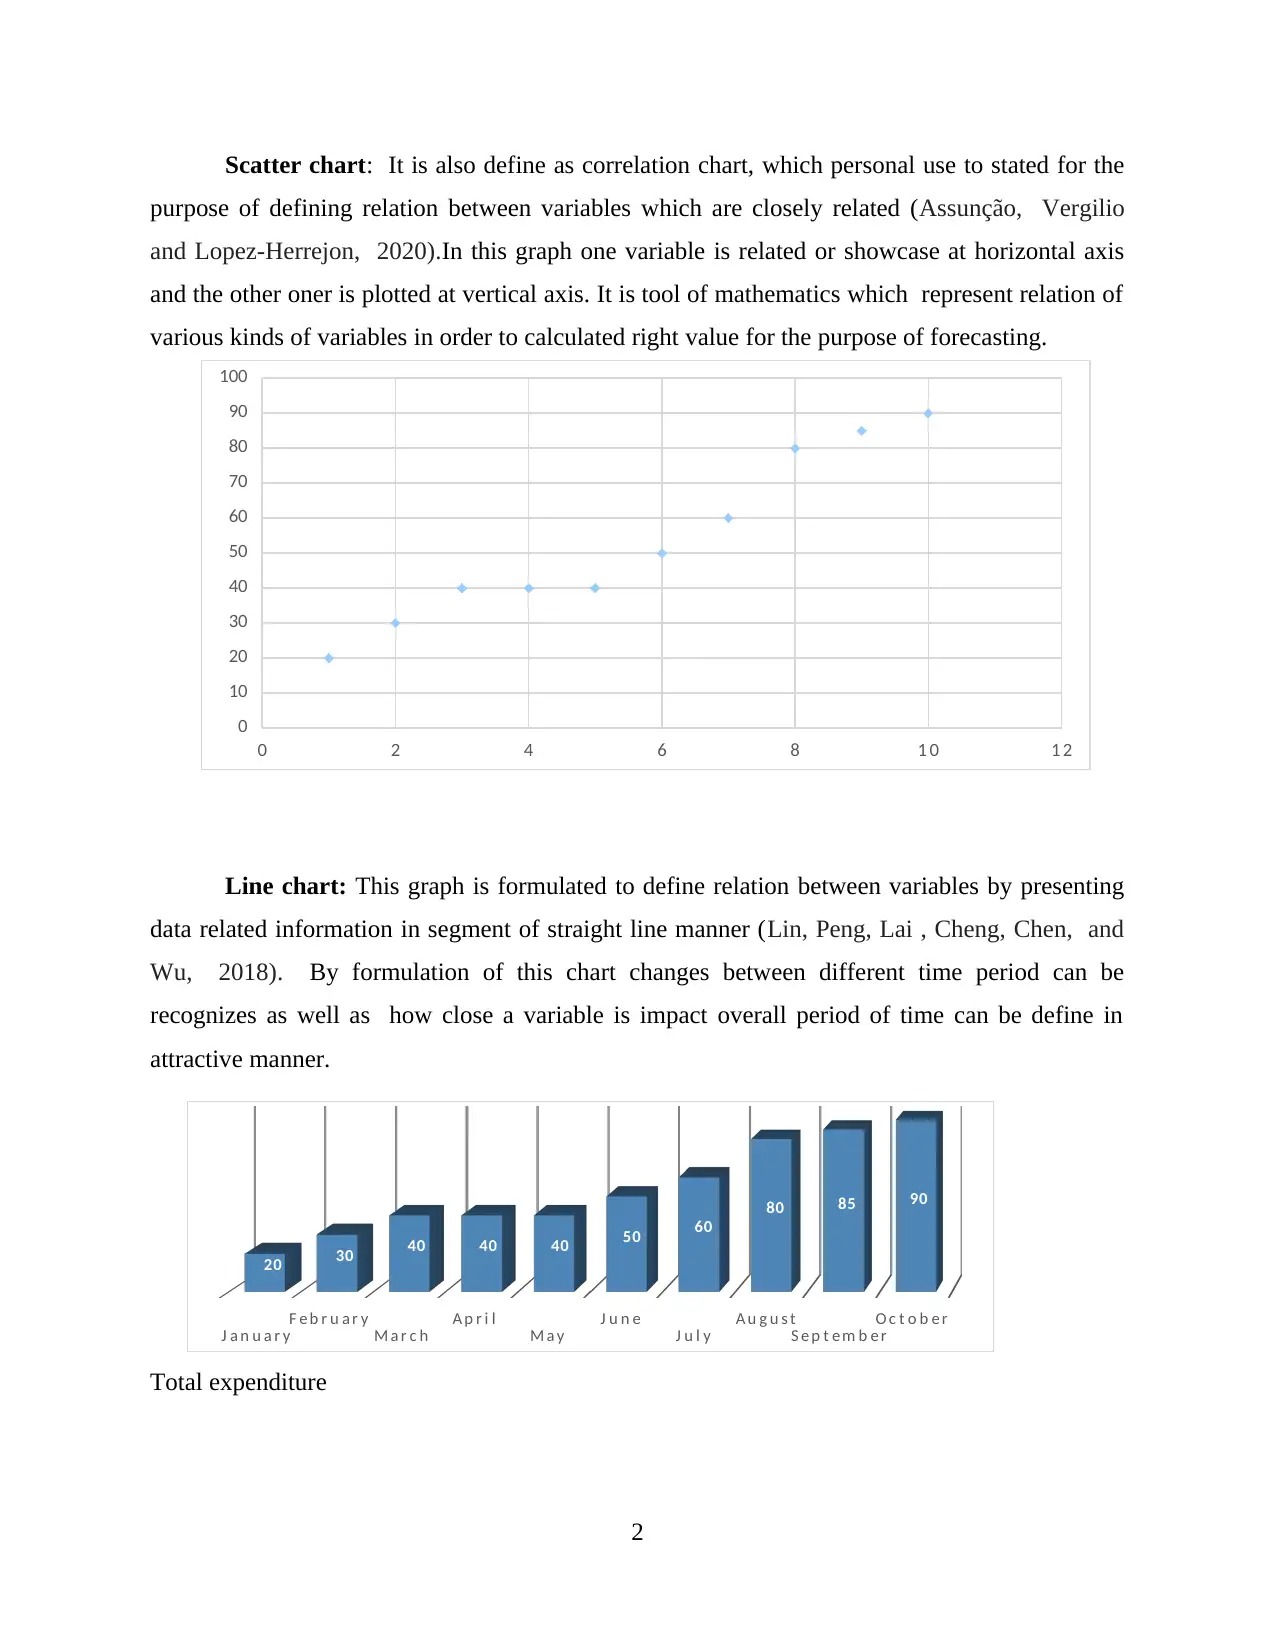
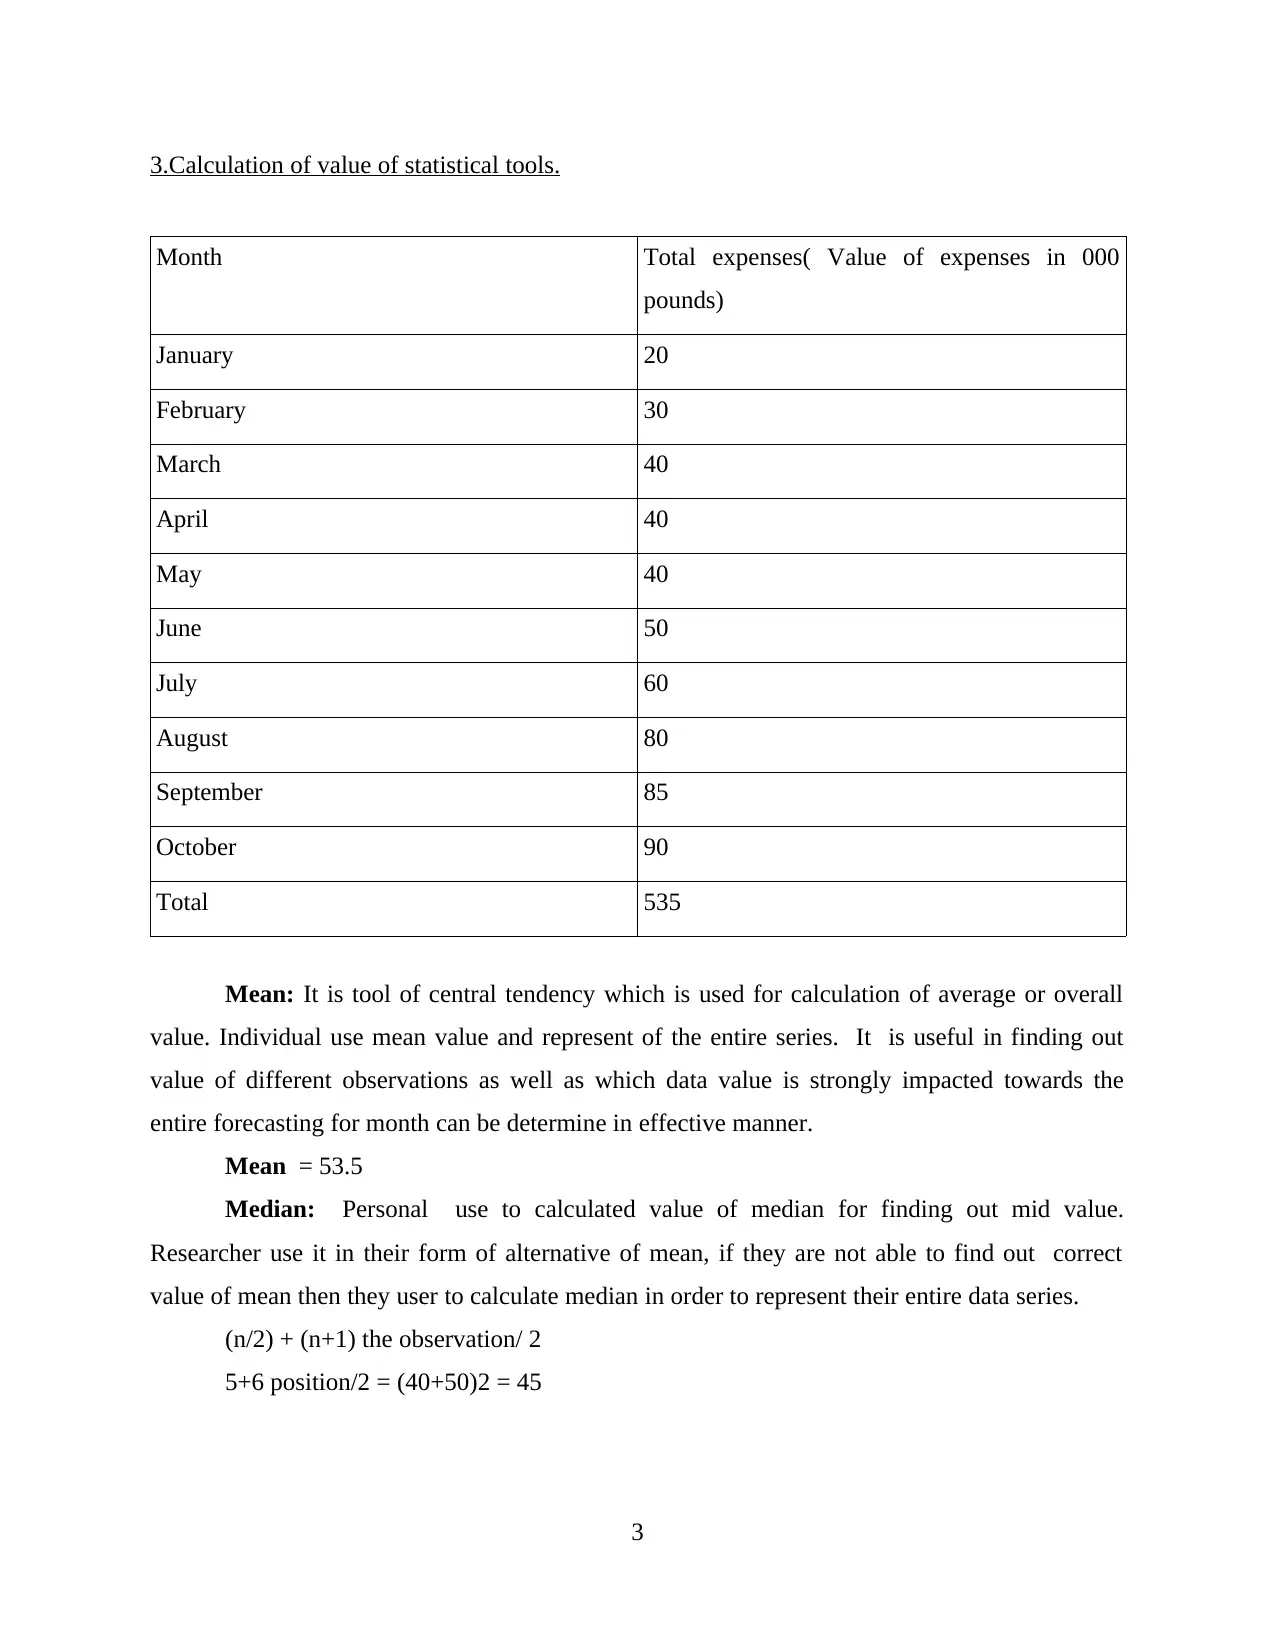
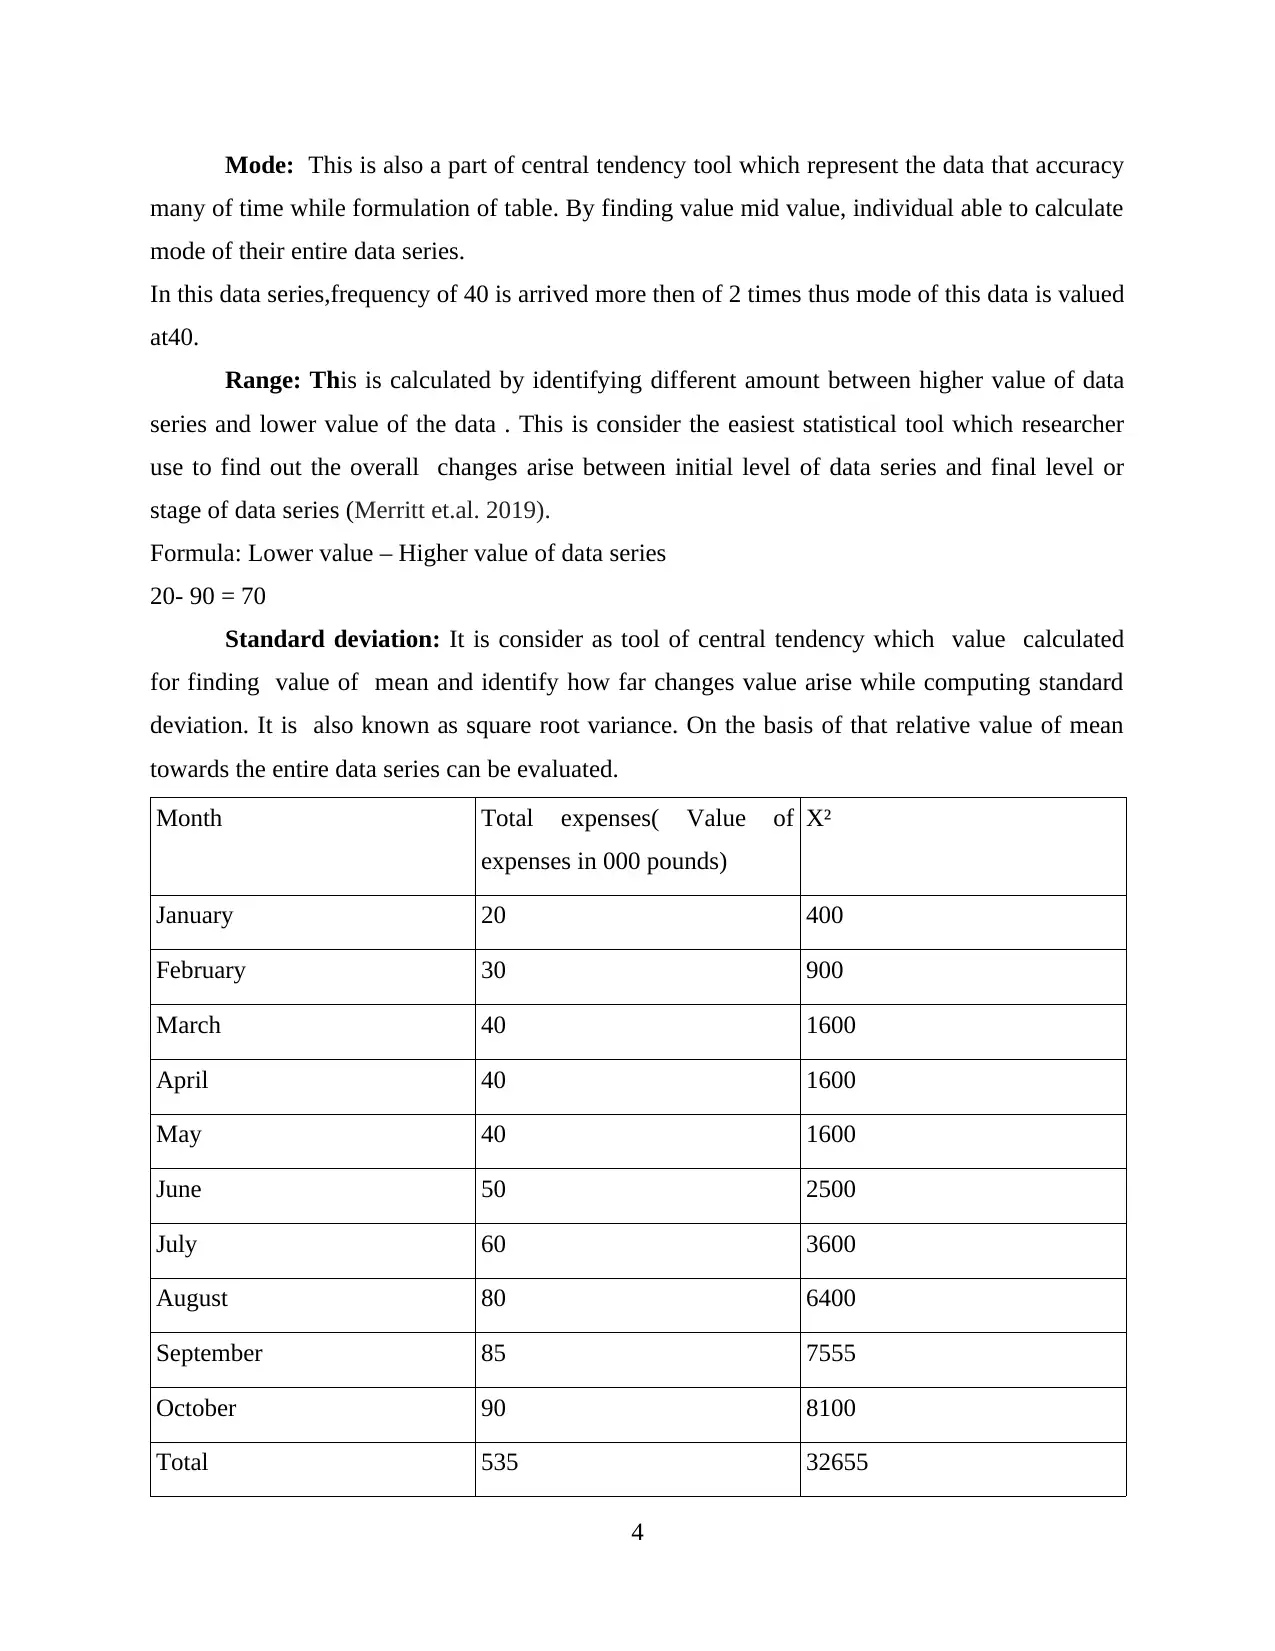
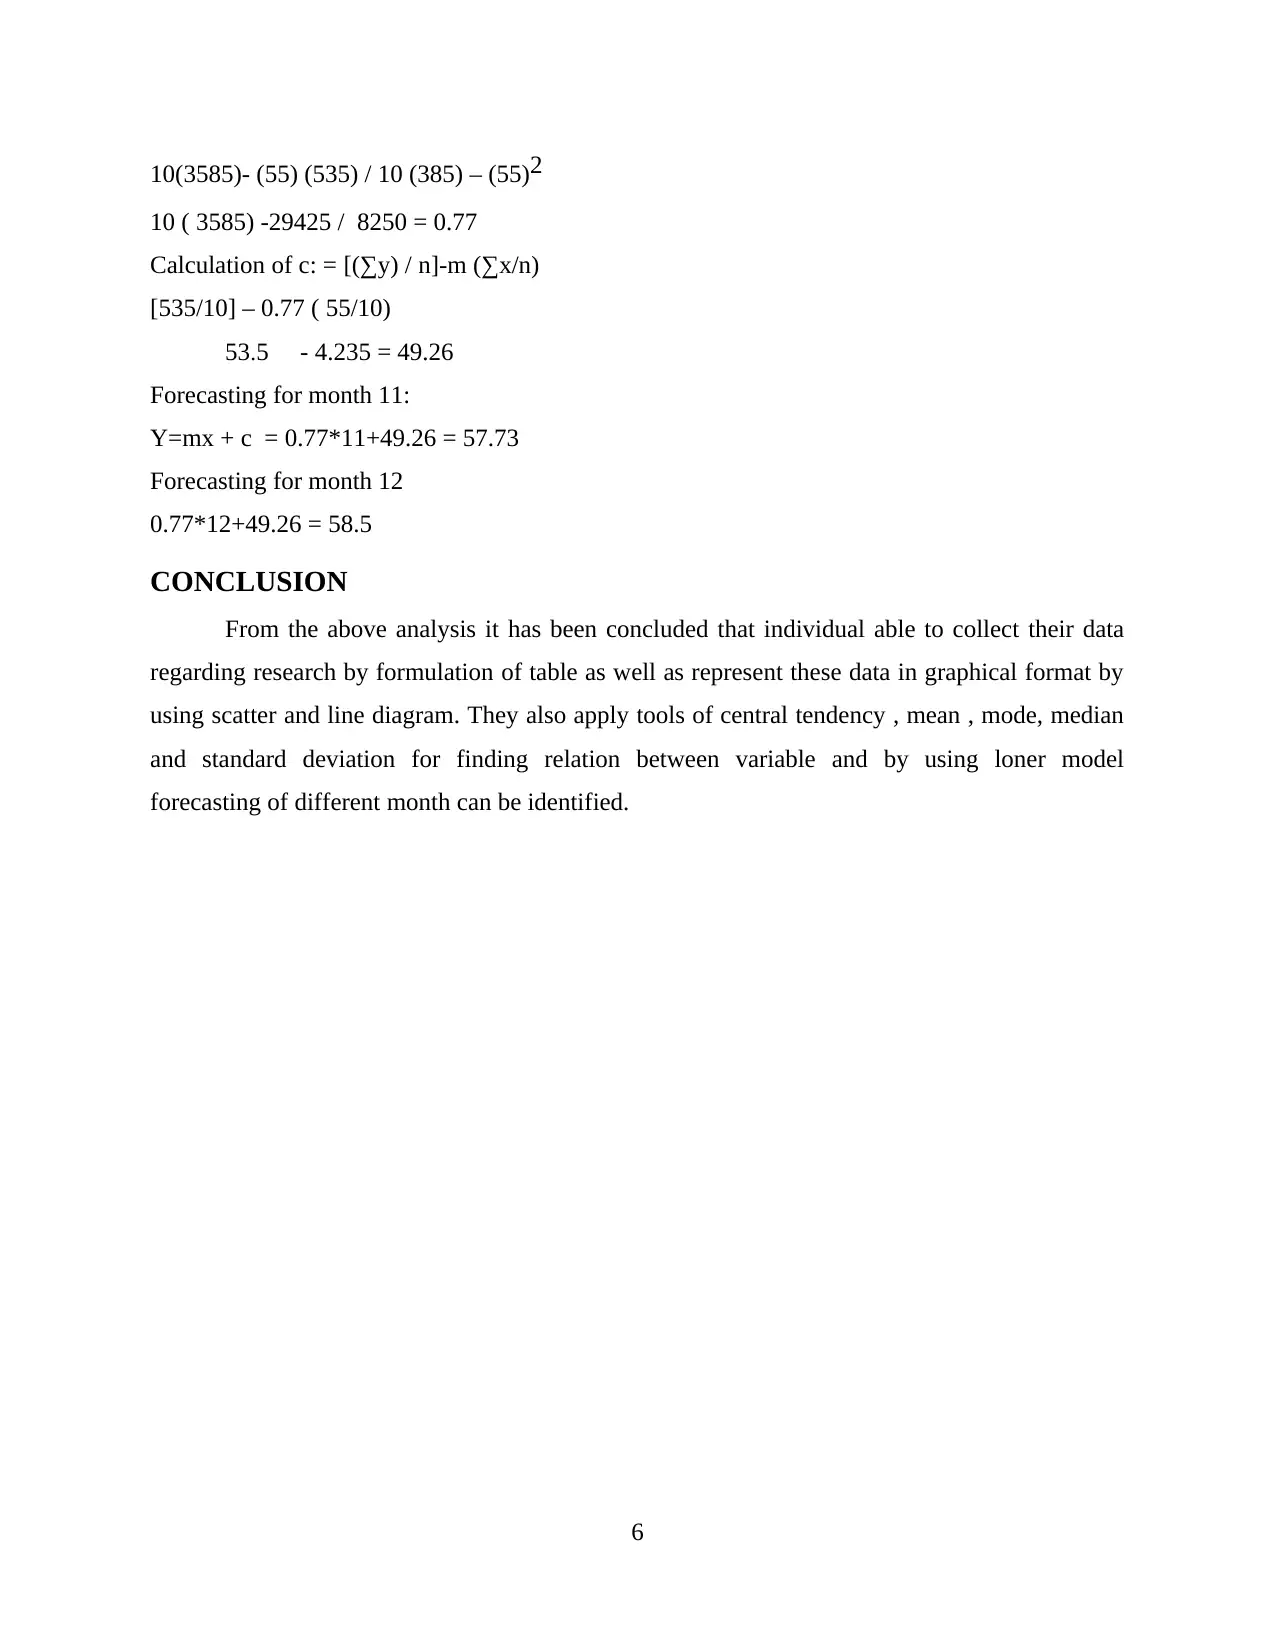
This report provides a comprehensive overview of data analysis and forecasting techniques. It begins by explaining how to arrange data in a tabular format for systematic collection and analysis. The report then details the use of graphical charts, specifically scatter and line charts, to visually represent data and identify relationships between variables. The core of the report focuses on calculating statistical tools, including mean, median, mode, range, and standard deviation, to analyze central tendencies and data distribution. Finally, it demonstrates the application of a linear model for forecasting future values, using past data to predict trends and outcomes. The report concludes with a discussion of the findings and their implications.

DATA ANALYSIS AND FORECASTING
Paraphrase This Document
Need a fresh take? Get an instant paraphrase of this document with our AI Paraphraser

Table of Contents
INTRODUCTION...........................................................................................................................1
MAIN BODY...................................................................................................................................1
1. Arranging data ........................................................................................................................1
2.Presentation of data by using graphical charts..........................................................................1
3.Calculation of value of statistical tools.....................................................................................2
4.Computation of value of variables by using linear model of forecasting.................................4
CONCLUSION................................................................................................................................5
REFERENCES................................................................................................................................6

⊘ This is a preview!⊘
Do you want full access?
Subscribe today to unlock all pages.

Trusted by 1+ million students worldwide

INTRODUCTION
Data analysis & forecasting is define as systematic procedure which researcher use in order
to collect, analysis, manage as well as represent data in such a manner which is help in finding
solution of problems and define relation between variables. This report as been formulated in
order to define how individual apply various techniques of central tendency in order to collect
data as well as use of liner forecasting model to find out value of variables.
MAIN BODY
1. Arranging data
Individual in order to collect data formulate table which is useful in systematically collect
numerical value in tabular formate. Personal use this table for their further research purpose.
Month Total expenses( Value of expenses in 000
pounds)
January 20
February 30
March 40
April 40
May 40
June 50
July 60
August 80
September 85
October 90
2.Presentation of data by using graphical charts.
Individual for represent their collect data in effective and attractive manner formulate
graph which symbolise data in attractive manner. Following are the graphs has been formulated :
1
Paraphrase This Document
Need a fresh take? Get an instant paraphrase of this document with our AI Paraphraser

Scatter chart: It is also define as correlation chart, which personal use to stated for the
purpose of defining relation between variables which are closely related (Assunção, Vergilio
and Lopez-Herrejon, 2020).In this graph one variable is related or showcase at horizontal axis
and the other oner is plotted at vertical axis. It is tool of mathematics which represent relation of
various kinds of variables in order to calculated right value for the purpose of forecasting.
Line chart: This graph is formulated to define relation between variables by presenting
data related information in segment of straight line manner (Lin, Peng, Lai , Cheng, Chen, and
Wu, 2018). By formulation of this chart changes between different time period can be
recognizes as well as how close a variable is impact overall period of time can be define in
attractive manner.
Total expenditure
2
J a n u a r y
F e b r u a r y
M a r c h
A p r i l
M a y
J u n e
J u l y
A u g u s t
S e p t e m b e r
O c t o b e r
20 30 40 40 40 50 60
80 85 90
0 2 4 6 8 1 0 1 2
0
10
20
30
40
50
60
70
80
90
100

3.Calculation of value of statistical tools.
Month Total expenses( Value of expenses in 000
pounds)
January 20
February 30
March 40
April 40
May 40
June 50
July 60
August 80
September 85
October 90
Total 535
Mean: It is tool of central tendency which is used for calculation of average or overall
value. Individual use mean value and represent of the entire series. It is useful in finding out
value of different observations as well as which data value is strongly impacted towards the
entire forecasting for month can be determine in effective manner.
Mean = 53.5
Median: Personal use to calculated value of median for finding out mid value.
Researcher use it in their form of alternative of mean, if they are not able to find out correct
value of mean then they user to calculate median in order to represent their entire data series.
(n/2) + (n+1) the observation/ 2
5+6 position/2 = (40+50)2 = 45
3
⊘ This is a preview!⊘
Do you want full access?
Subscribe today to unlock all pages.

Trusted by 1+ million students worldwide

Mode: This is also a part of central tendency tool which represent the data that accuracy
many of time while formulation of table. By finding value mid value, individual able to calculate
mode of their entire data series.
In this data series,frequency of 40 is arrived more then of 2 times thus mode of this data is valued
at40.
Range: This is calculated by identifying different amount between higher value of data
series and lower value of the data . This is consider the easiest statistical tool which researcher
use to find out the overall changes arise between initial level of data series and final level or
stage of data series (Merritt et.al. 2019).
Formula: Lower value – Higher value of data series
20- 90 = 70
Standard deviation: It is consider as tool of central tendency which value calculated
for finding value of mean and identify how far changes value arise while computing standard
deviation. It is also known as square root variance. On the basis of that relative value of mean
towards the entire data series can be evaluated.
Month Total expenses( Value of
expenses in 000 pounds)
X²
January 20 400
February 30 900
March 40 1600
April 40 1600
May 40 1600
June 50 2500
July 60 3600
August 80 6400
September 85 7555
October 90 8100
Total 535 32655
4
Paraphrase This Document
Need a fresh take? Get an instant paraphrase of this document with our AI Paraphraser

√∑X²/ N - (∑X/N)²
√32655/10- (535/10)²
√3265.5 – 2862.25 = 20.08
4.Computation of value of variables by using linear model of forecasting.
This tool is use in order to find out futurist value by calculating and observing past value
of data series. Individual apply this model in order to find out accurate and reliable value for the
purpose of formulation of future policies regarding with related data series. This model is
generally apply for finding out quantitative value of prices for finding out relation between
depended and independent variable of data series (Rayat, 2018).
X Y x2 x y
1 20 1 20
2 30 4 60
3 40 9 120
4 40 16 160
5 40 25 200
6 50 36 300
7 60 49 420
8 80 64 640
9 85 81 765
10 90 100 900
55 535 385 3585
Y= mx + c
m= n (∑x y) - (∑x) (∑y)/ n(∑x2) -( ∑x)2
5

10(3585)- (55) (535) / 10 (385) – (55)2
10 ( 3585) -29425 / 8250 = 0.77
Calculation of c: = [(∑y) / n]-m (∑x/n)
[535/10] – 0.77 ( 55/10)
53.5 - 4.235 = 49.26
Forecasting for month 11:
Y=mx + c = 0.77*11+49.26 = 57.73
Forecasting for month 12
0.77*12+49.26 = 58.5
CONCLUSION
From the above analysis it has been concluded that individual able to collect their data
regarding research by formulation of table as well as represent these data in graphical format by
using scatter and line diagram. They also apply tools of central tendency , mean , mode, median
and standard deviation for finding relation between variable and by using loner model
forecasting of different month can be identified.
6
⊘ This is a preview!⊘
Do you want full access?
Subscribe today to unlock all pages.

Trusted by 1+ million students worldwide

REFERENCES
Books and journals
Assunção, W. K., Vergilio, S. R. and Lopez-Herrejon, R. E., 2020. Automatic extraction of
product line architecture and feature models from UML class diagram
variants. Information and Software Technology. 117 . p.106198.
Lin, P., Peng, Z., Lai, Y., Cheng, S., Chen, Z. and Wu, L., 2018. Short-term power prediction for
photovoltaic power plants using a hybrid improved Kmeans-GRA-Elman model based
on multivariate meteorological factors and historical power datasets. Energy
Conversion and Management .177. pp.704-717.
Merritt et.al. 2019. Beyond measures of central tendency: novel methods to examine sex
differences in neuropsychological performance following sports-related concussion in
collegiate athletes. Journal of the International Neuropsychological Society:
JINS. 25(10). pp.1094-1100.
Rayat, C. S., 2018. Measures of Central Tendency. In Statistical Methods in Medical
Research (pp. 33-46). Springer, Singapore.
7
1 out of 10
Related Documents
Your All-in-One AI-Powered Toolkit for Academic Success.
+13062052269
info@desklib.com
Available 24*7 on WhatsApp / Email
Unlock your academic potential
Copyright © 2020–2025 A2Z Services. All Rights Reserved. Developed and managed by ZUCOL.


