Data Analysis and Forecasting for Numeracy and Data Analysis Module

Verified

Added on  2023/06/10

|11
|1414
|254
Homework Assignment
AI Summary
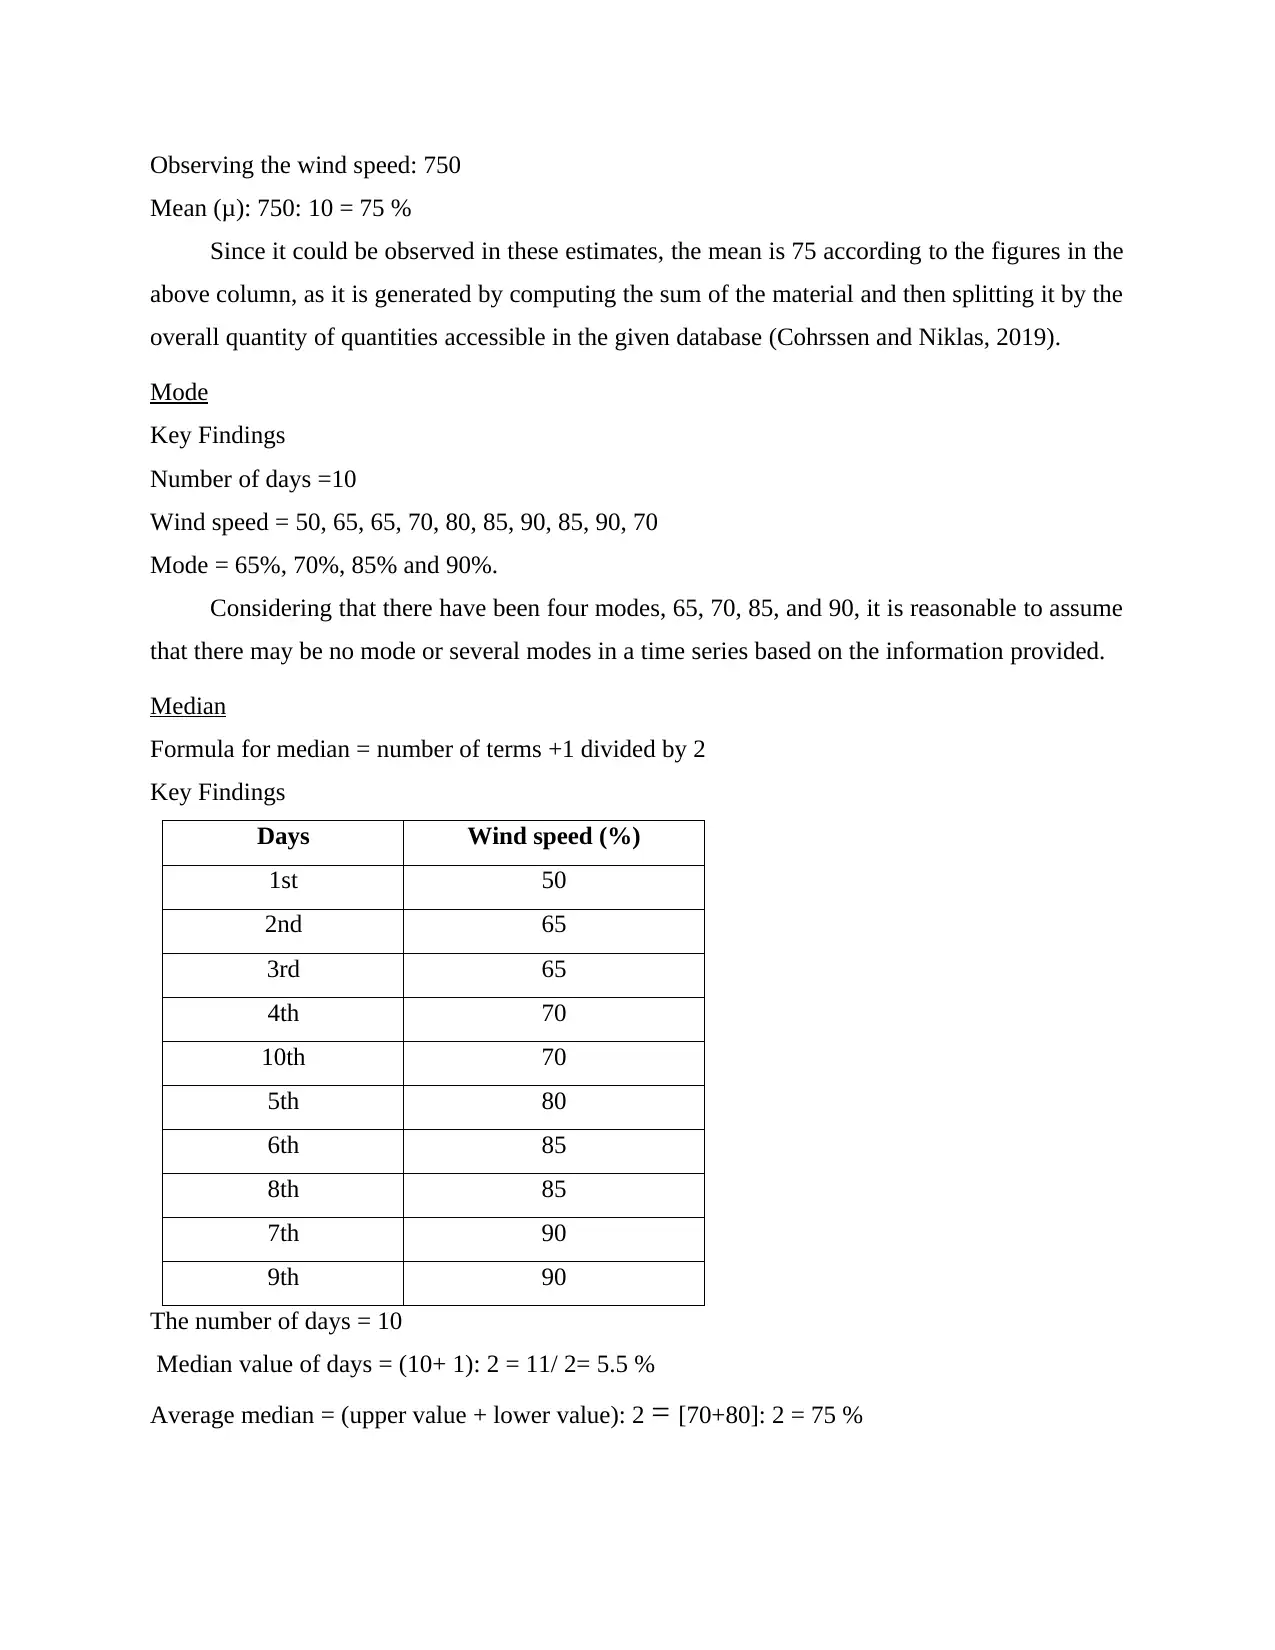
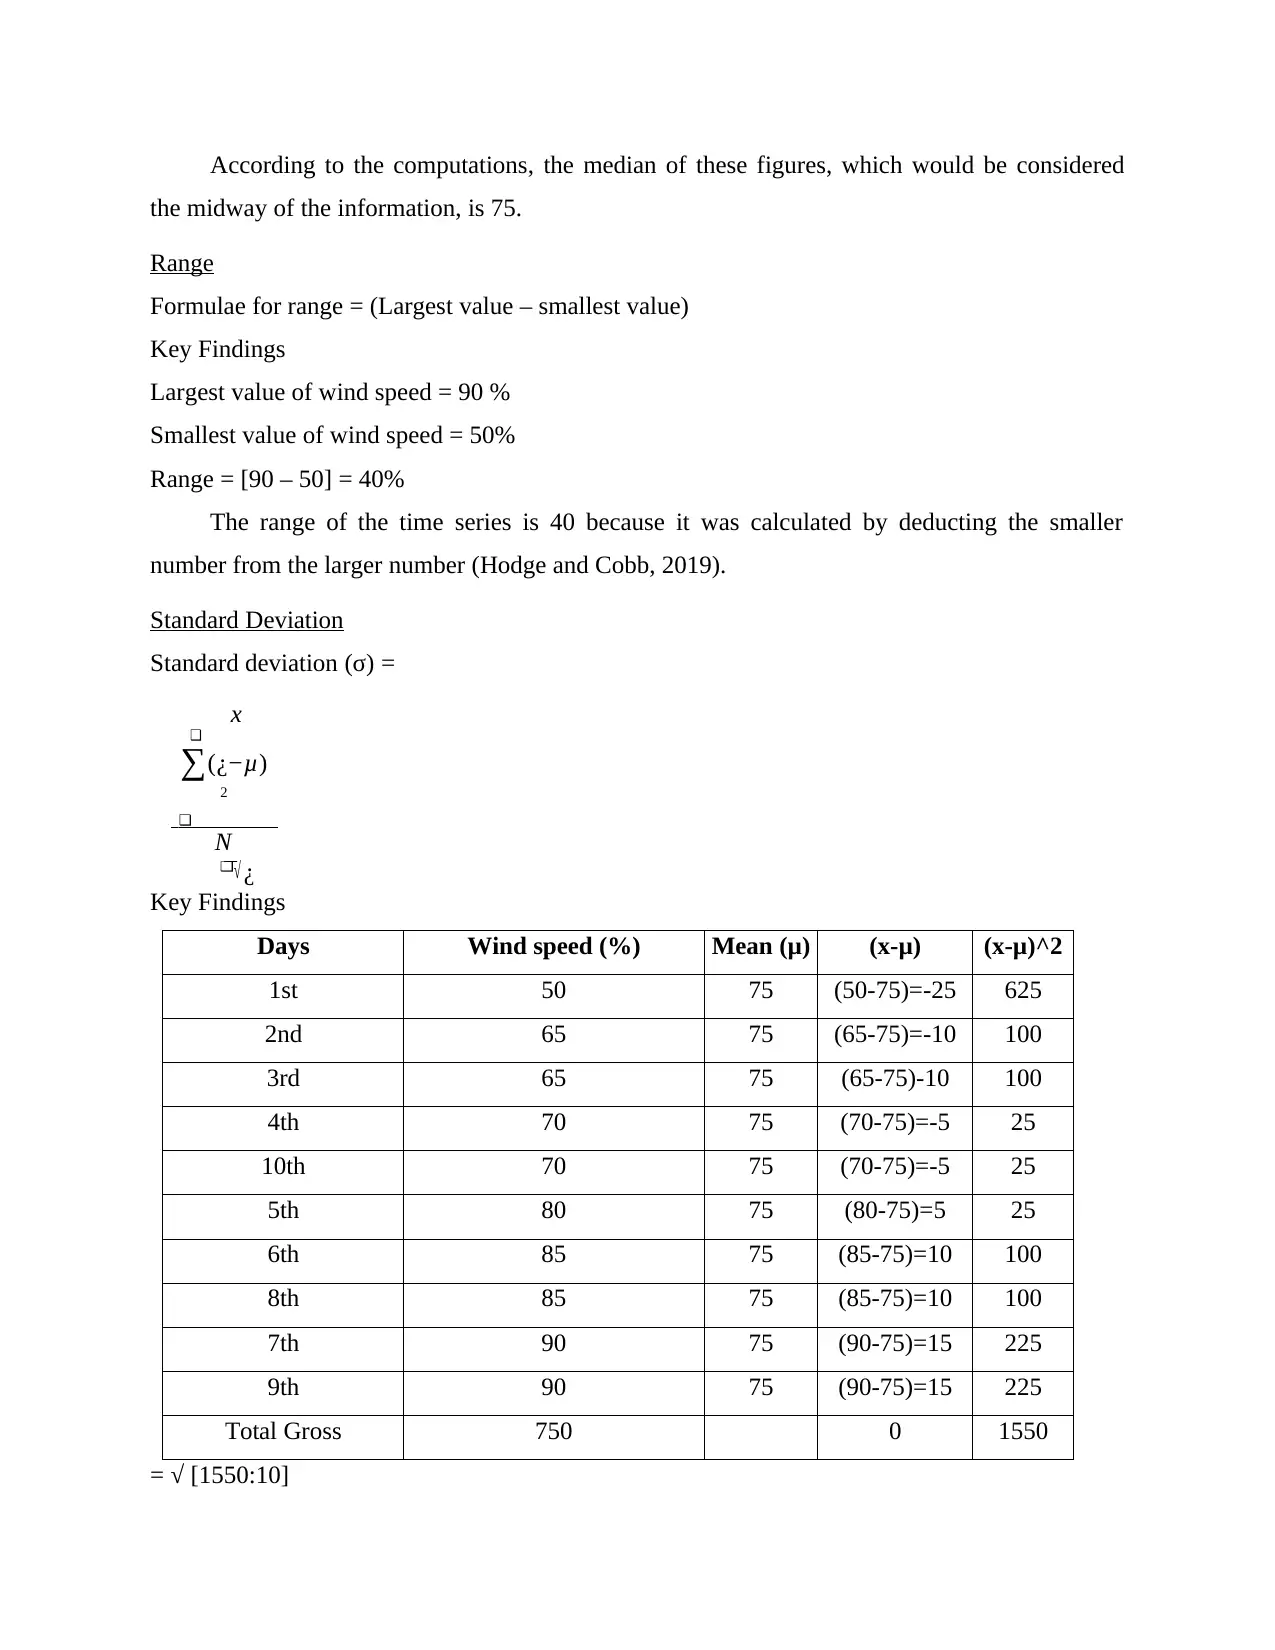
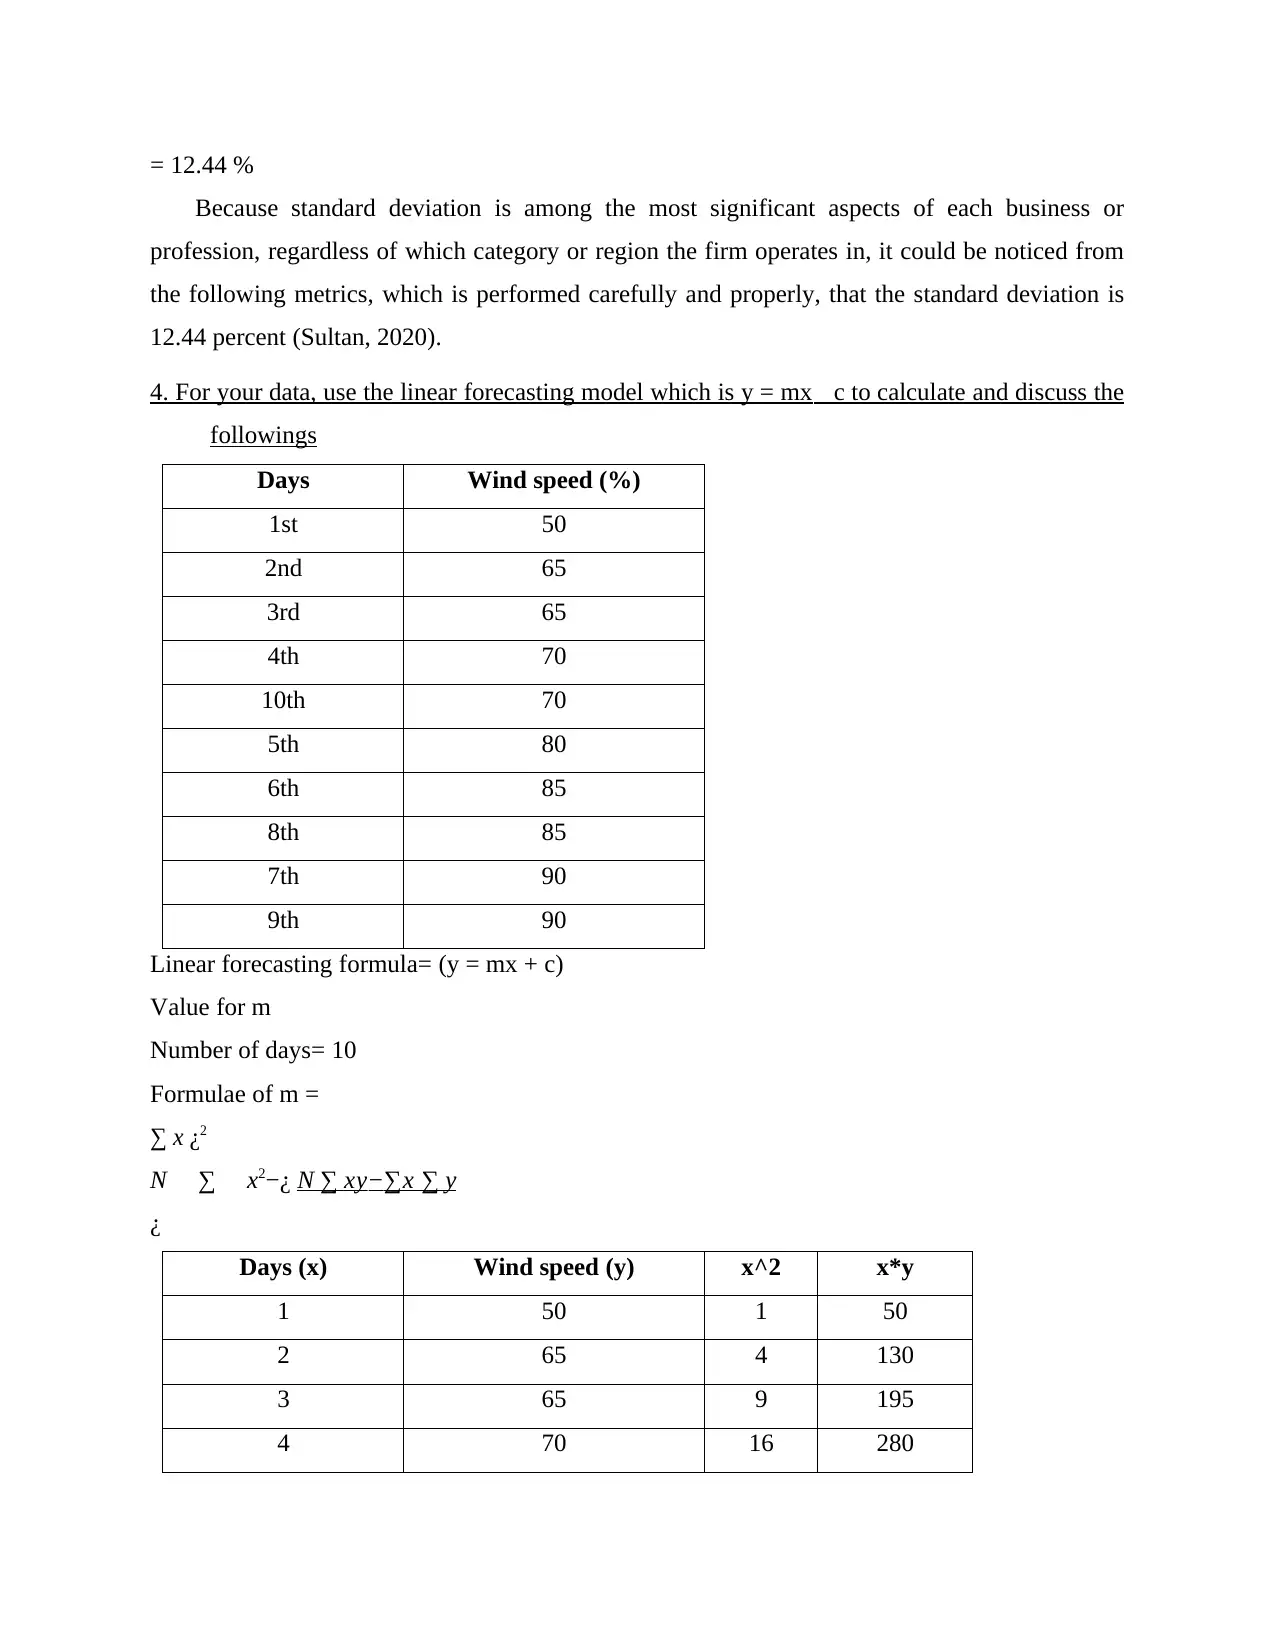
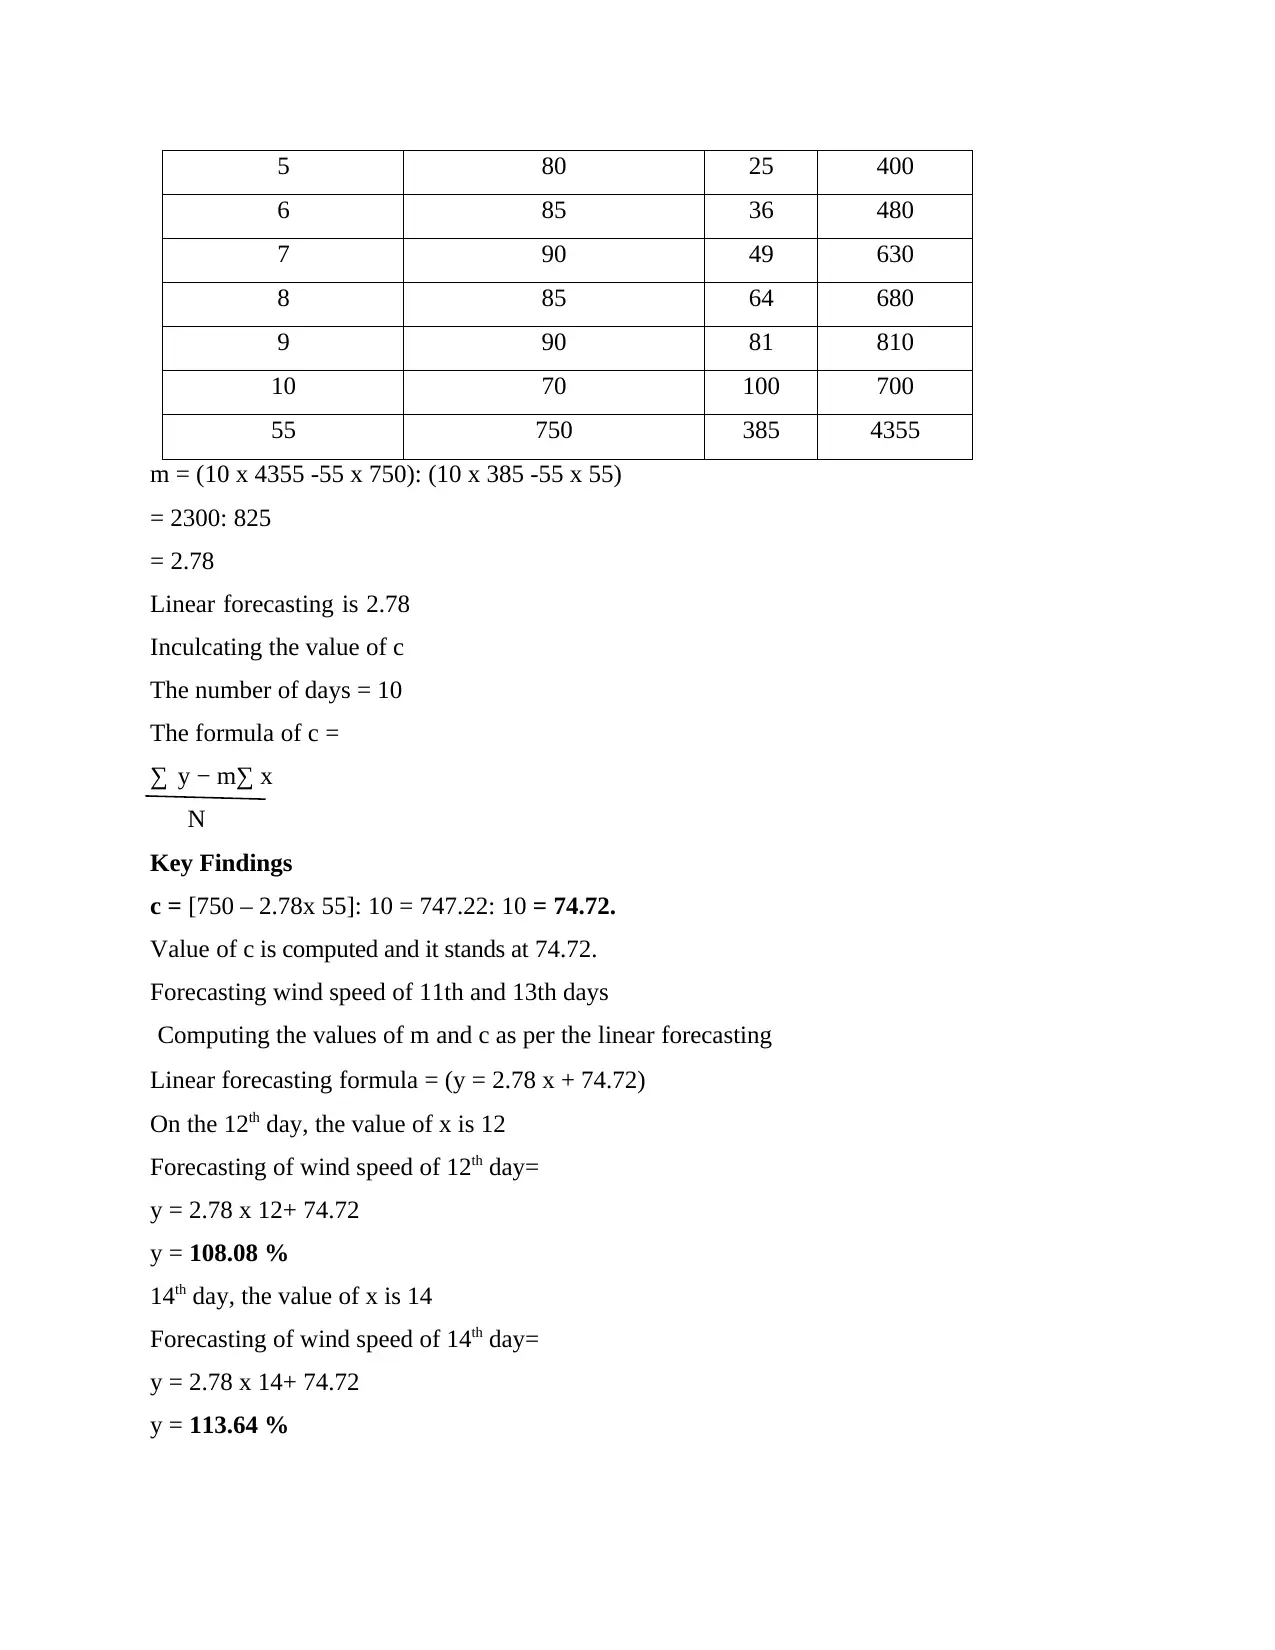
This assignment solution addresses a data analysis and forecasting task, likely for a Numeracy and Data Analysis module at the BABS Foundation Level, in association with the University of Suffolk. The solution begins by organizing wind speed data in a table format and presenting it visually using two chart types. It then proceeds to calculate and discuss key statistical measures, including mean, mode, median, range, and standard deviation, providing step-by-step calculations and highlighting the final values. Furthermore, the solution applies a linear forecasting model (y = mx + c) to the data, calculating the values of 'm' and 'c' and using them to forecast wind speeds for future days. The document concludes with a summary of the findings and relevant references.
tabler-icon-diamond-filled.svg

Contribute Materials

Your contribution can guide someone’s learning journey. Share your documents today.
Document Page
Data analysis and
forecasting
tabler-icon-diamond-filled.svg

Secure Best Marks with AI Grader

Need help grading? Try our AI Grader for instant feedback on your assignments.
Document Page
Contents
Contents...........................................................................................................................................2
INTRODUCTION...........................................................................................................................1
MAIN BODY..................................................................................................................................1
1. Arrange the data in a table format...........................................................................................1
2. Present the data using any two types of appropriate charts of your choice.............................1
3. Calculate and discuss the followings. Please provide the steps for the calculation and
highlight the final value...............................................................................................................2
Mean............................................................................................................................................2
Mode............................................................................................................................................3
Median.........................................................................................................................................3
Range...........................................................................................................................................4
Standard Deviation......................................................................................................................4
4. For your data, use the linear forecasting model which is y = mx c to calculate and discuss
the followings..............................................................................................................................5
CONCLUSION................................................................................................................................7
REFERENCES................................................................................................................................8
Document Page
Document Page
INTRODUCTION
Number sense is the knowledge of statistics in our everyday lives and its application to
create the greatest decisions feasible (Chinn, 2020). Research methodology and computation
could be employed to evaluate evidence, graphs, and info graphics, as well as to grasp and
describe conclusions. Statistical represented in diagrams or info graphics reduce complicated
facts by emphasising structures, movements, and summarising and interpreting statistical
findings. The graphs clearly show the highest and lowest costs. For entrepreneurs, information is
often a crucial aspect. Professionals make their decisions on statistics. The corporate group's
database administrator collects information, interprets it, and makes decisions depending on that
information. The structure of the information can be hard to interpret at moments.
MAIN BODY
1. Arrange the data in a table format
Days Wind speed
1st 50
2nd 65
3rd 65
4th 70
5th 80
6th 85
7th 90
8th 85
9th 90
10th 70
Total Gross 750
2. Present the data using any two types of appropriate charts of your choice
3D column chart-
tabler-icon-diamond-filled.svg

Secure Best Marks with AI Grader

Need help grading? Try our AI Grader for instant feedback on your assignments.
Document Page
3D bar chart-
3. Calculate and discuss the followings. Please provide the steps for the calculation and highlight
the final value
Mean
The formula of Mean: (μ) =

x

N
Key Findings
Number of days: 10
Document Page
Observing the wind speed: 750
Mean (μ): 750: 10 = 75 %
Since it could be observed in these estimates, the mean is 75 according to the figures in the
above column, as it is generated by computing the sum of the material and then splitting it by the
overall quantity of quantities accessible in the given database (Cohrssen and Niklas, 2019).
Mode
Key Findings
Number of days =10
Wind speed = 50, 65, 65, 70, 80, 85, 90, 85, 90, 70
Mode = 65%, 70%, 85% and 90%.
Considering that there have been four modes, 65, 70, 85, and 90, it is reasonable to assume
that there may be no mode or several modes in a time series based on the information provided.
Median
Formula for median = number of terms +1 divided by 2
Key Findings
Days Wind speed (%)
1st 50
2nd 65
3rd 65
4th 70
10th 70
5th 80
6th 85
8th 85
7th 90
9th 90
The number of days = 10
Median value of days = (10+ 1): 2 = 11/ 2= 5.5 %
Average median = (upper value + lower value): 2 = [70+80]: 2 = 75 %
Document Page
According to the computations, the median of these figures, which would be considered
the midway of the information, is 75.
Range
Formulae for range = (Largest value smallest value)
Key Findings
Largest value of wind speed = 90 %
Smallest value of wind speed = 50%
Range = [90 50] = 40%
The range of the time series is 40 because it was calculated by deducting the smaller
number from the larger number (Hodge and Cobb, 2019).
Standard Deviation
Standard deviation (σ) =
x

(¿−μ)
2

N

¿
Key Findings
Days Wind speed (%) Mean (μ) (x-μ) (x-μ)^2
1st 50 75 (50-75)=-25 625
2nd 65 75 (65-75)=-10 100
3rd 65 75 (65-75)-10 100
4th 70 75 (70-75)=-5 25
10th 70 75 (70-75)=-5 25
5th 80 75 (80-75)=5 25
6th 85 75 (85-75)=10 100
8th 85 75 (85-75)=10 100
7th 90 75 (90-75)=15 225
9th 90 75 (90-75)=15 225
Total Gross 750 0 1550
= √ [1550:10]
tabler-icon-diamond-filled.svg

Paraphrase This Document

Need a fresh take? Get an instant paraphrase of this document with our AI Paraphraser
Document Page
= 12.44 %
Because standard deviation is among the most significant aspects of each business or
profession, regardless of which category or region the firm operates in, it could be noticed from
the following metrics, which is performed carefully and properly, that the standard deviation is
12.44 percent (Sultan, 2020).
4. For your data, use the linear forecasting model which is y = mx c to calculate and discuss the
followings
Days Wind speed (%)
1st 50
2nd 65
3rd 65
4th 70
10th 70
5th 80
6th 85
8th 85
7th 90
9th 90
Linear forecasting formula= (y = mx + c)
Value for m
Number of days= 10
Formulae of m =
x ¿ 2
N x2−¿ N xy∑x y
¿
Days (x) Wind speed (y) x^2 x*y
1 50 1 50
2 65 4 130
3 65 9 195
4 70 16 280
Document Page
5 80 25 400
6 85 36 480
7 90 49 630
8 85 64 680
9 90 81 810
10 70 100 700
55 750 385 4355
m = (10 x 4355 -55 x 750): (10 x 385 -55 x 55)
= 2300: 825
= 2.78
Linear forecasting is 2.78
Inculcating the value of c
The number of days = 10
The formula of c =
y − m∑ x
N
Key Findings
c = [750 – 2.78x 55]: 10 = 747.22: 10 = 74.72.
Value of c is computed and it stands at 74.72.
Forecasting wind speed of 11th and 13th days
Computing the values of m and c as per the linear forecasting
Linear forecasting formula = (y = 2.78 x + 74.72)
On the 12th day, the value of x is 12
Forecasting of wind speed of 12th day=
y = 2.78 x 12+ 74.72
y = 108.08 %
14th day, the value of x is 14
Forecasting of wind speed of 14th day=
y = 2.78 x 14+ 74.72
y = 113.64 %
Document Page
CONCLUSION
From the above it can be concluded that this study shows market research by
employing various statistical techniques. It also begins with a column which displays
information from the existing ten months' wind speed. Two graphs have been constructed to
examine information from the table. Going ahead, the Mean, Median, Mode, and Range
were determined using the information supplied at the start of this analysis. On either hand,
standard deviation is also computed since it is dependent on this that the level of standard
variation could be determined. In the twelve and fourteen months, this study would conclude
with the worth and significance of projecting.
tabler-icon-diamond-filled.svg

Secure Best Marks with AI Grader

Need help grading? Try our AI Grader for instant feedback on your assignments.
Document Page
REFERENCES
Books and journals
Chinn, S., 2020. The trouble with maths: A practical guide to helping learners with numeracy
difficulties. Routledge.
Cohrssen, C. and Niklas, F., 2019. Using mathematics games in preschool settings to support the
development of children’s numeracy skills. International Journal of Early Years
Education, 27(3), pp.322-339.
Hodge, L. L. and Cobb, P., 2019. Two views of culture and their implications for mathematics
teaching and learning. Urban Education. 54(6). pp.860-884.
Sultan, J.B., 2020. Characteristics of remedial students in learning numeracy and programs that
enhance the achievement.
chevron_up_icon
1 out of 11
circle_padding
hide_on_mobile
zoom_out_icon
logo.png

Your All-in-One AI-Powered Toolkit for Academic Success.

Available 24*7 on WhatsApp / Email

[object Object]