Numeracy & Data Analysis: Data Analysis and Forecasting Report

Verified

Added on  2023/06/10

|10
|1646
|451
Report
AI Summary
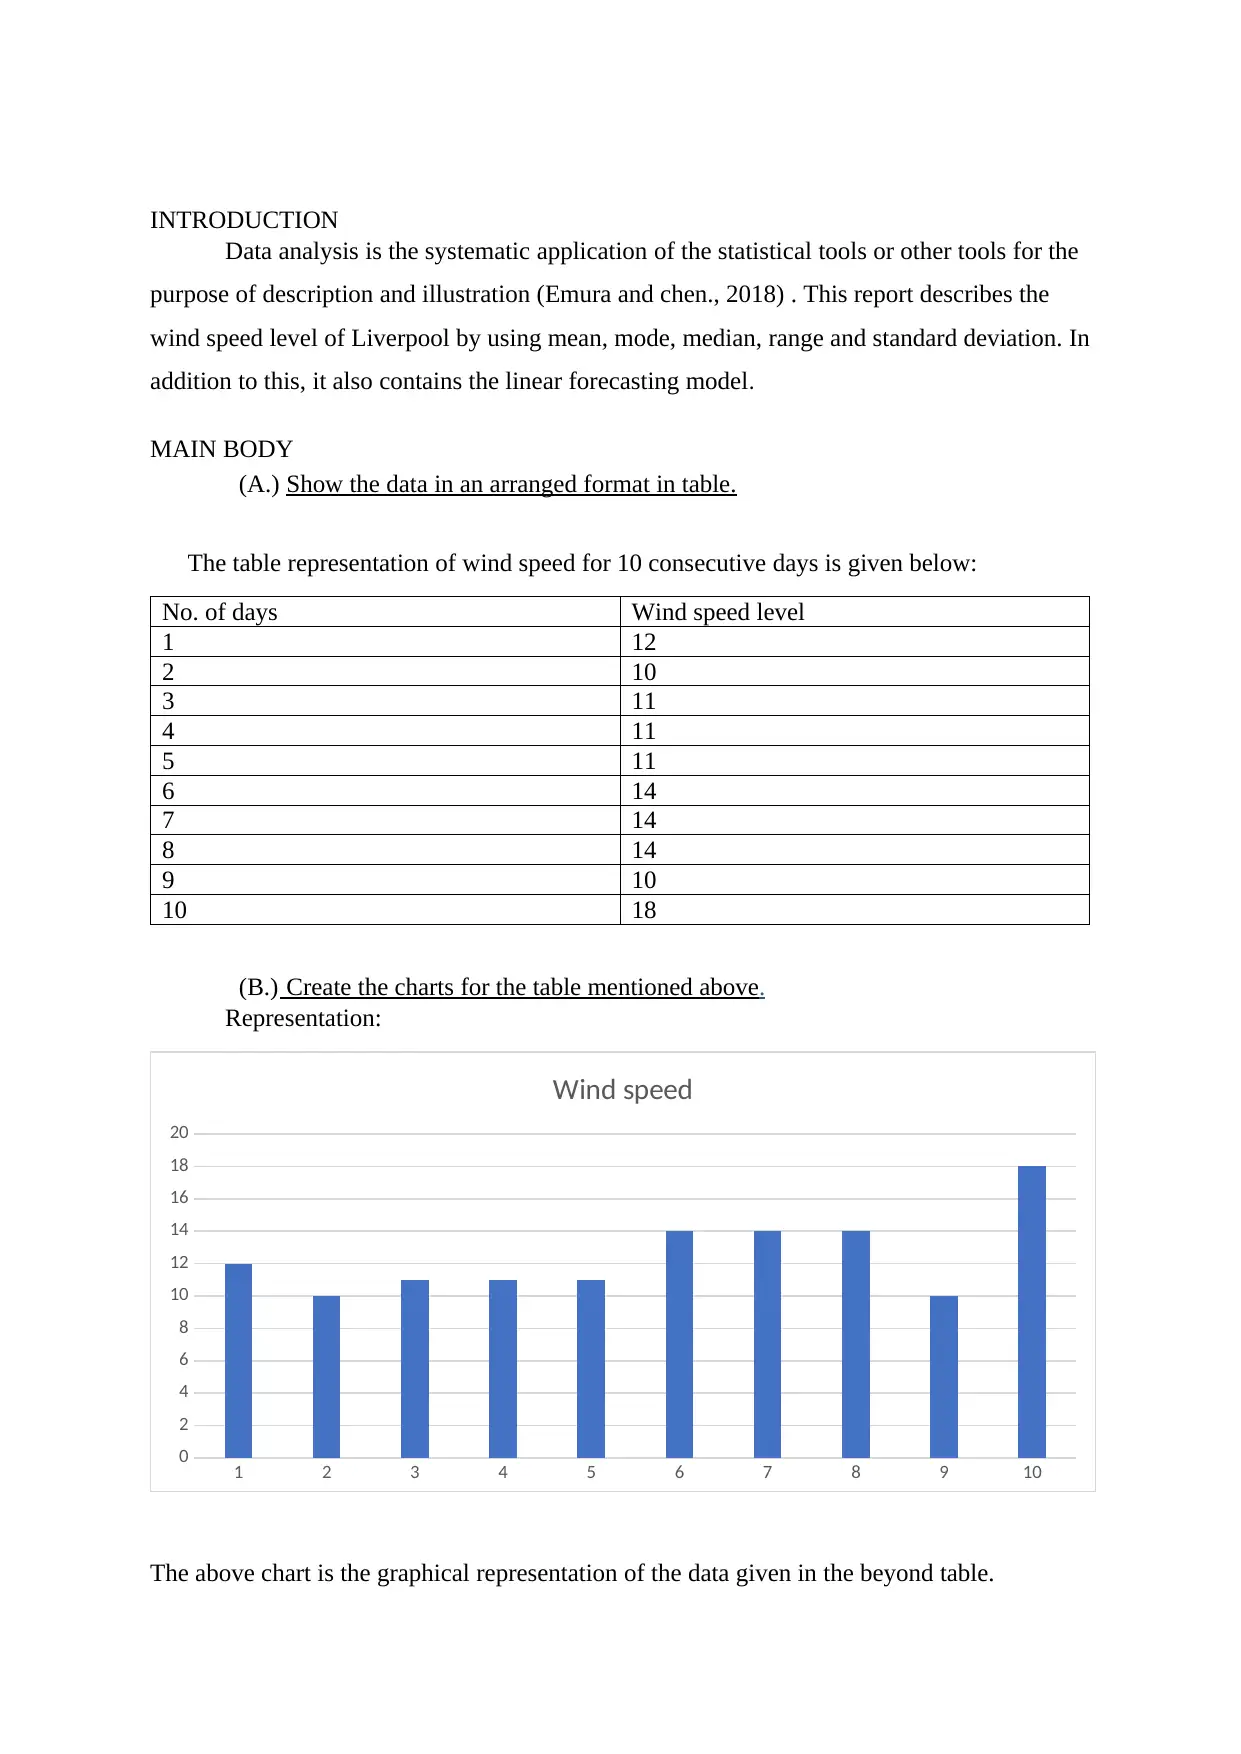
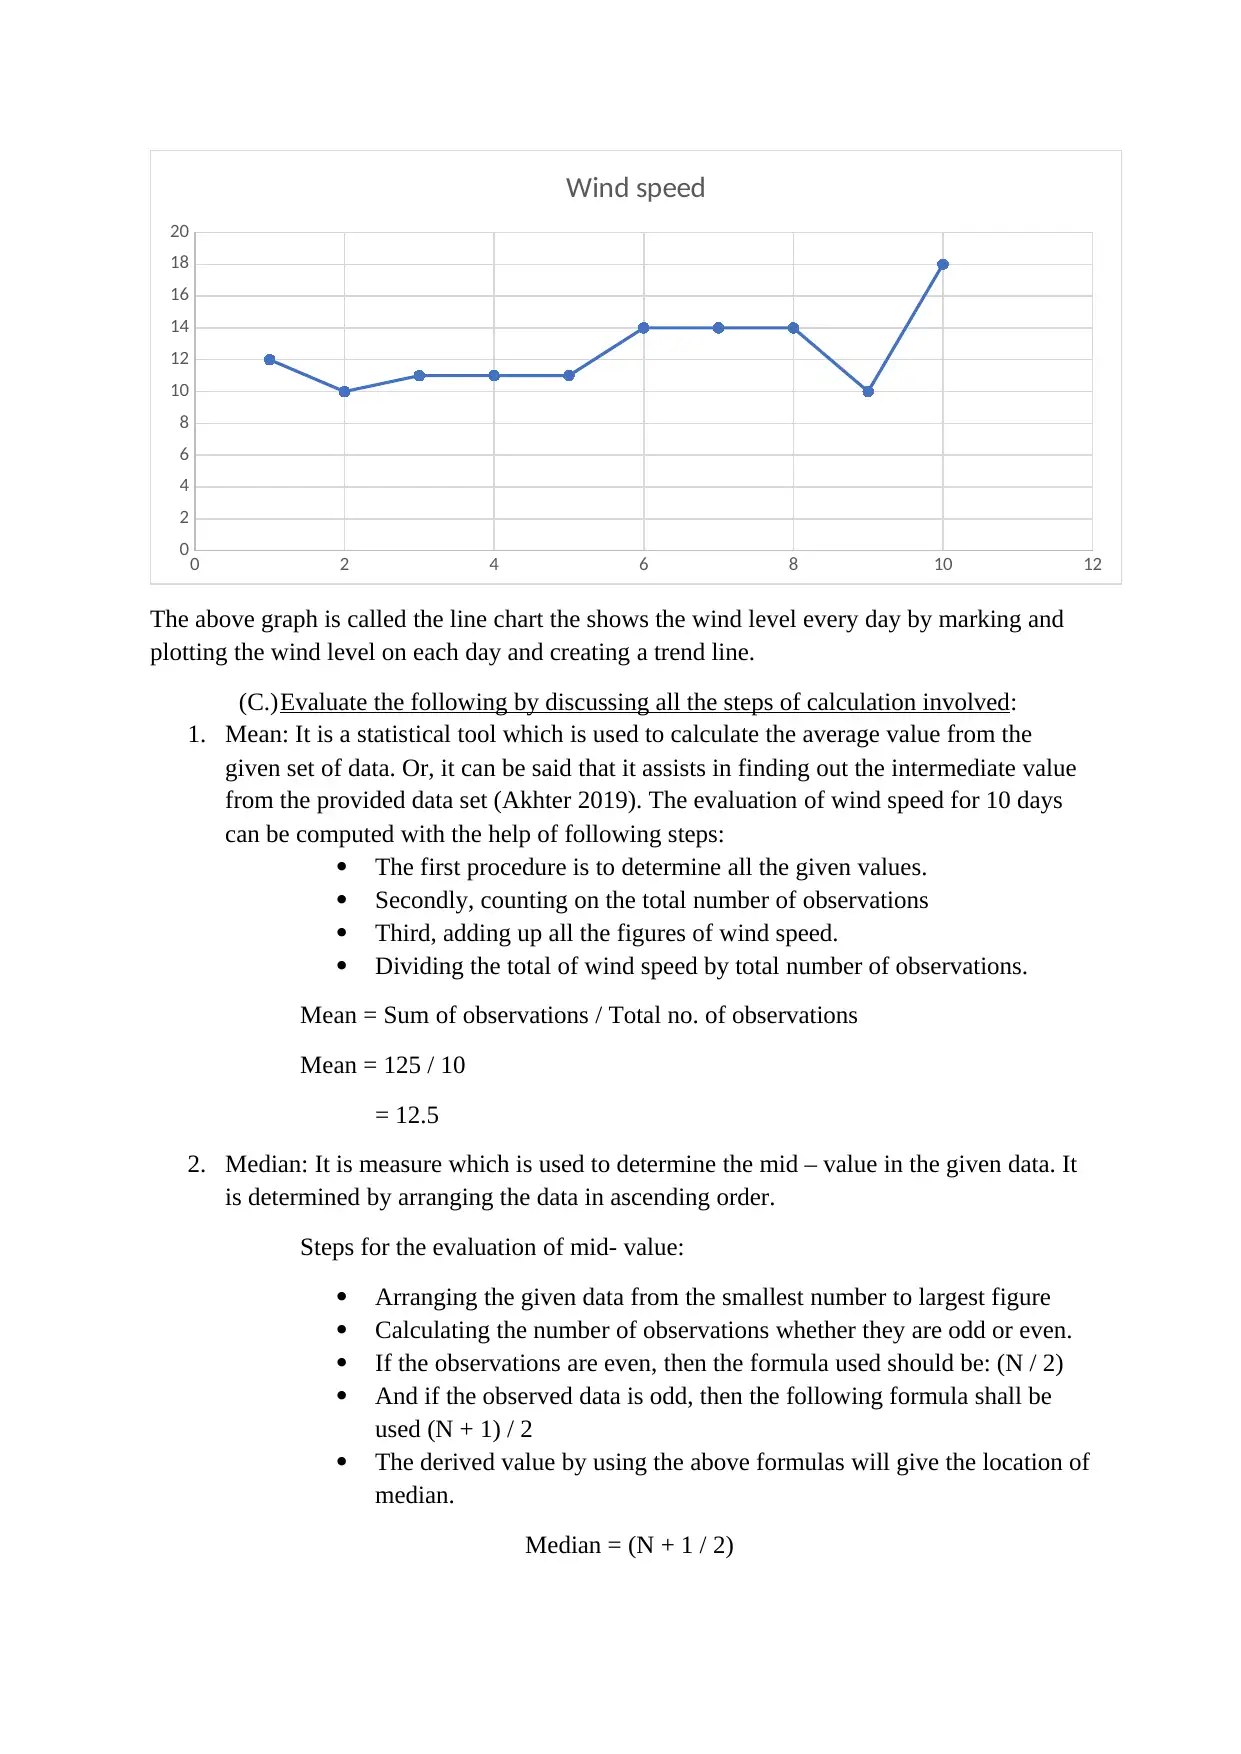
This report provides a detailed analysis of wind speed data for Liverpool, employing various statistical tools such as mean, median, mode, range, and standard deviation. The data is presented in tabular and graphical formats, including line charts, to visualize trends. The report includes step-by-step calculations for each statistical measure and applies a linear forecasting model to predict future wind speed values, deriving a regression equation and calculating the values of 'm' and 'c'. The analysis aims to demonstrate the application of data analysis and forecasting techniques to real-world scenarios, providing insights into the wind speed patterns in Liverpool. Desklib offers a wide range of similar assignments and study resources for students.
tabler-icon-diamond-filled.svg

Contribute Materials

Your contribution can guide someone’s learning journey. Share your documents today.
Document Page
S220662
tabler-icon-diamond-filled.svg

Secure Best Marks with AI Grader

Need help grading? Try our AI Grader for instant feedback on your assignments.
Document Page
Contents
INTRODUCTION.................................................................................................................................3
MAIN BODY........................................................................................................................................3
(A.) Show the data in an arranged format in table.........................................................................3
(B.) Create the charts for the table mentioned above.....................................................................3
(C.) Evaluate the following by discussing all the steps of calculation involved............................4
(D.) With the use of liner forecasting model form the regression equation can computation of the
value of m and c................................................................................................................................6
CONCLUSION.....................................................................................................................................9
References...........................................................................................................................................10
Document Page
INTRODUCTION
Data analysis is the systematic application of the statistical tools or other tools for the
purpose of description and illustration (Emura and chen., 2018) . This report describes the
wind speed level of Liverpool by using mean, mode, median, range and standard deviation. In
addition to this, it also contains the linear forecasting model.
MAIN BODY
(A.) Show the data in an arranged format in table.
The table representation of wind speed for 10 consecutive days is given below:
No. of days Wind speed level
1 12
2 10
3 11
4 11
5 11
6 14
7 14
8 14
9 10
10 18
(B.) Create the charts for the table mentioned above.
Representation:
1 2 3 4 5 6 7 8 9 10
0
2
4
6
8
10
12
14
16
18
20
Wind speed
The above chart is the graphical representation of the data given in the beyond table.
Document Page
0 2 4 6 8 10 12
0
2
4
6
8
10
12
14
16
18
20
Wind speed
The above graph is called the line chart the shows the wind level every day by marking and
plotting the wind level on each day and creating a trend line.
(C.)Evaluate the following by discussing all the steps of calculation involved:
1. Mean: It is a statistical tool which is used to calculate the average value from the
given set of data. Or, it can be said that it assists in finding out the intermediate value
from the provided data set (Akhter 2019). The evaluation of wind speed for 10 days
can be computed with the help of following steps:
The first procedure is to determine all the given values.
Secondly, counting on the total number of observations
Third, adding up all the figures of wind speed.
Dividing the total of wind speed by total number of observations.
Mean = Sum of observations / Total no. of observations
Mean = 125 / 10
= 12.5
2. Median: It is measure which is used to determine the mid – value in the given data. It
is determined by arranging the data in ascending order.
Steps for the evaluation of mid- value:
Arranging the given data from the smallest number to largest figure
Calculating the number of observations whether they are odd or even.
If the observations are even, then the formula used should be: (N / 2)
And if the observed data is odd, then the following formula shall be
used (N + 1) / 2
The derived value by using the above formulas will give the location of
median.
Median = (N + 1 / 2)
tabler-icon-diamond-filled.svg

Secure Best Marks with AI Grader

Need help grading? Try our AI Grader for instant feedback on your assignments.
Document Page
= (10 + 1 / 2)
= (11 / 2)
= 5.5
12, 10, 11, 11, 11, 14, 14, 14, 10, 18
10, 10, 11, 11, 11, 12, 14, 14, 14, 18
Thus, the median for the given series of data is (11 + 12) / 2
Therefore, Median = (23 / 2) = 11.5
3. Mode= It is a metric that helps in evaluation of a most occurring value in the given
data rows.
Steps that are involved for the calculation are:
Firstly, the collection and organization of data shall be performed.
Then analyzing the different values.
Third step is to counting the no. of times that figure has its
occurrence in the data.
Then, lastly, the value that will incur most of the times will be the
mode.
12, 10, 11, 11, 11, 14, 14, 14, 10, 18
In this scenario, it can be observed that 11 and 14 are the figures that have equal number of
occurrences. And the highest value appearance for these both is 3. It is a bimodal distribution
hence there is no mode. The below table gives more clarification on the same.
Data wind speed Frequency
12 1
10 2
11 3
14 3
18 1
4. Range: Range can be defined as the difference between the highest and the lowest
value in the data (Wang 2019).
It includes the below listed steps for the computation.
Arranging all the available data.
Examining the highest and the lowest figure.
Subtracting the smallest figure from the largest figure.
After the beyond steps, the value derived is the range.
Range = Maximum value – minimum value
Document Page
Range = 18 – 10
= 8
5. Standard Deviation: It is the measurement of how dispersed the value is with respect
to mean.
Steps to follow:
At first, the mean from the given row of data shall be found.
Second, Finding out the difference between the value and the mode
of the data for each observation.
Adding all of the value involved in second process.
Dividing it by number of terms.
Then calculating the square of the derived figure of forth step.
Standard deviation
DAY Wind speed xi - μ (xi - μ)2
1 12 -0.5 0.25
2 10 -2.5 6.25
3 11 -1.5 2.25
4 11 -1.5 2.25
5 11 -1.5 2.25
6 14 1.5 2.25
7 14 1.5 2.25
8 14 1.5 2.25
9 10 -2.5 6.25
10 18 5.5 30.25
125 2.84 56.5
Standard deviation = √ (xi – μ)2 / N
Standard deviation = √ 56.5 / 10
= √ 5.65
= 2.41
(D.) With the use of liner forecasting model form the regression equation can computation of
the value of m and c.
Liner Forecasting Model: It is the model that helps in the projection of future values
on the ground of past values in the linear equation.
y = mx + c
In this, Y is a dependent variable
‘mx’ is an independent variable and ‘C’ is the constant.
Document Page
Calculation of value m by mentioning the steps involves.
Multiplying both the variables i.e., x and y which are termed after days and wind
speed.
Performing the sum of the above evaluation.
Individually adding up the X and y variables.
Then multiplication of both the elements
In the end, compute (x) 2 by applying the values.
The achieved number is the value of ‘m’
Linear forecasting model
DAY Wind speed xy x^2
1 12 12 1
2 10 20 4
3 11 33 9
4 11 44 16
5 11 55 25
6 14 84 36
7 14 98 49
8 14 112 64
9 10 90 81
10 18 180 100
55 125 728 385
m= 10* 728 – 728/10 * 385 – 385
= 7280 – 728 / 3850 – 385
= 6552/ 3465
= 1.89
Thus, the m value = 1.89 signifies the line of slope.
Calculate the value of c, by writing the procedure used:
Find the sum of y variable
Calculate the sum of x variable.
Then dividing it with the sum of N
The determined number is the value for c.
C = (125 – 1.89*55) / 10
C = 2.105
(e.) Calculate the value of m and c for the 12 and 14 days:
tabler-icon-diamond-filled.svg

Paraphrase This Document

Need a fresh take? Get an instant paraphrase of this document with our AI Paraphraser
Document Page
Wind speed on day 12:
y = mx + c
y = (1.89 * 12) + 2.10
y = 22.68 + 10
y = 32.68
Wind speed on day 14:
y = mx + c
y = (1.89 * 14) + 2.10
y = 28.56
Document Page
CONCLUSION
From the above data and representations, it is clear that data of wind level of
Liverpool was computed with the help of the measures of central tendency. Moreover, by
using the linear forecasting the regression equation was made.
Document Page
References
Books and journals.
Emura, T. and Chen, Y.H., 2018. Analysis of survival data with dependent censoring:
Copula-Based Approaches. Singapore: Springer.
Wang, J. and et.al.,2019. Evaluating the energy-environment efficiency and its determinants
in Guangdong using a slack-based measure with environmental undesirable outputs
and panel data model. Science of the Total Environment. 663. pp.878-888.
Akhter, S., Pauyo, T. and Khan, M., 2019. What is the difference between a systematic
review and a meta-analysis? Basic Methods Handbook for Clinical Orthopaedic
Research. pp.331-342.
Lawrence, K.D., 2019. Robust regression: analysis and applications. Routledge.
chevron_up_icon
1 out of 10
circle_padding
hide_on_mobile
zoom_out_icon
logo.png

Your All-in-One AI-Powered Toolkit for Academic Success.

Available 24*7 on WhatsApp / Email

[object Object]