Data Analysis Project: Healthcare Resource Allocation and Analysis
VerifiedAdded on  2020/07/22
|21
|2934
|250
Project
AI Summary
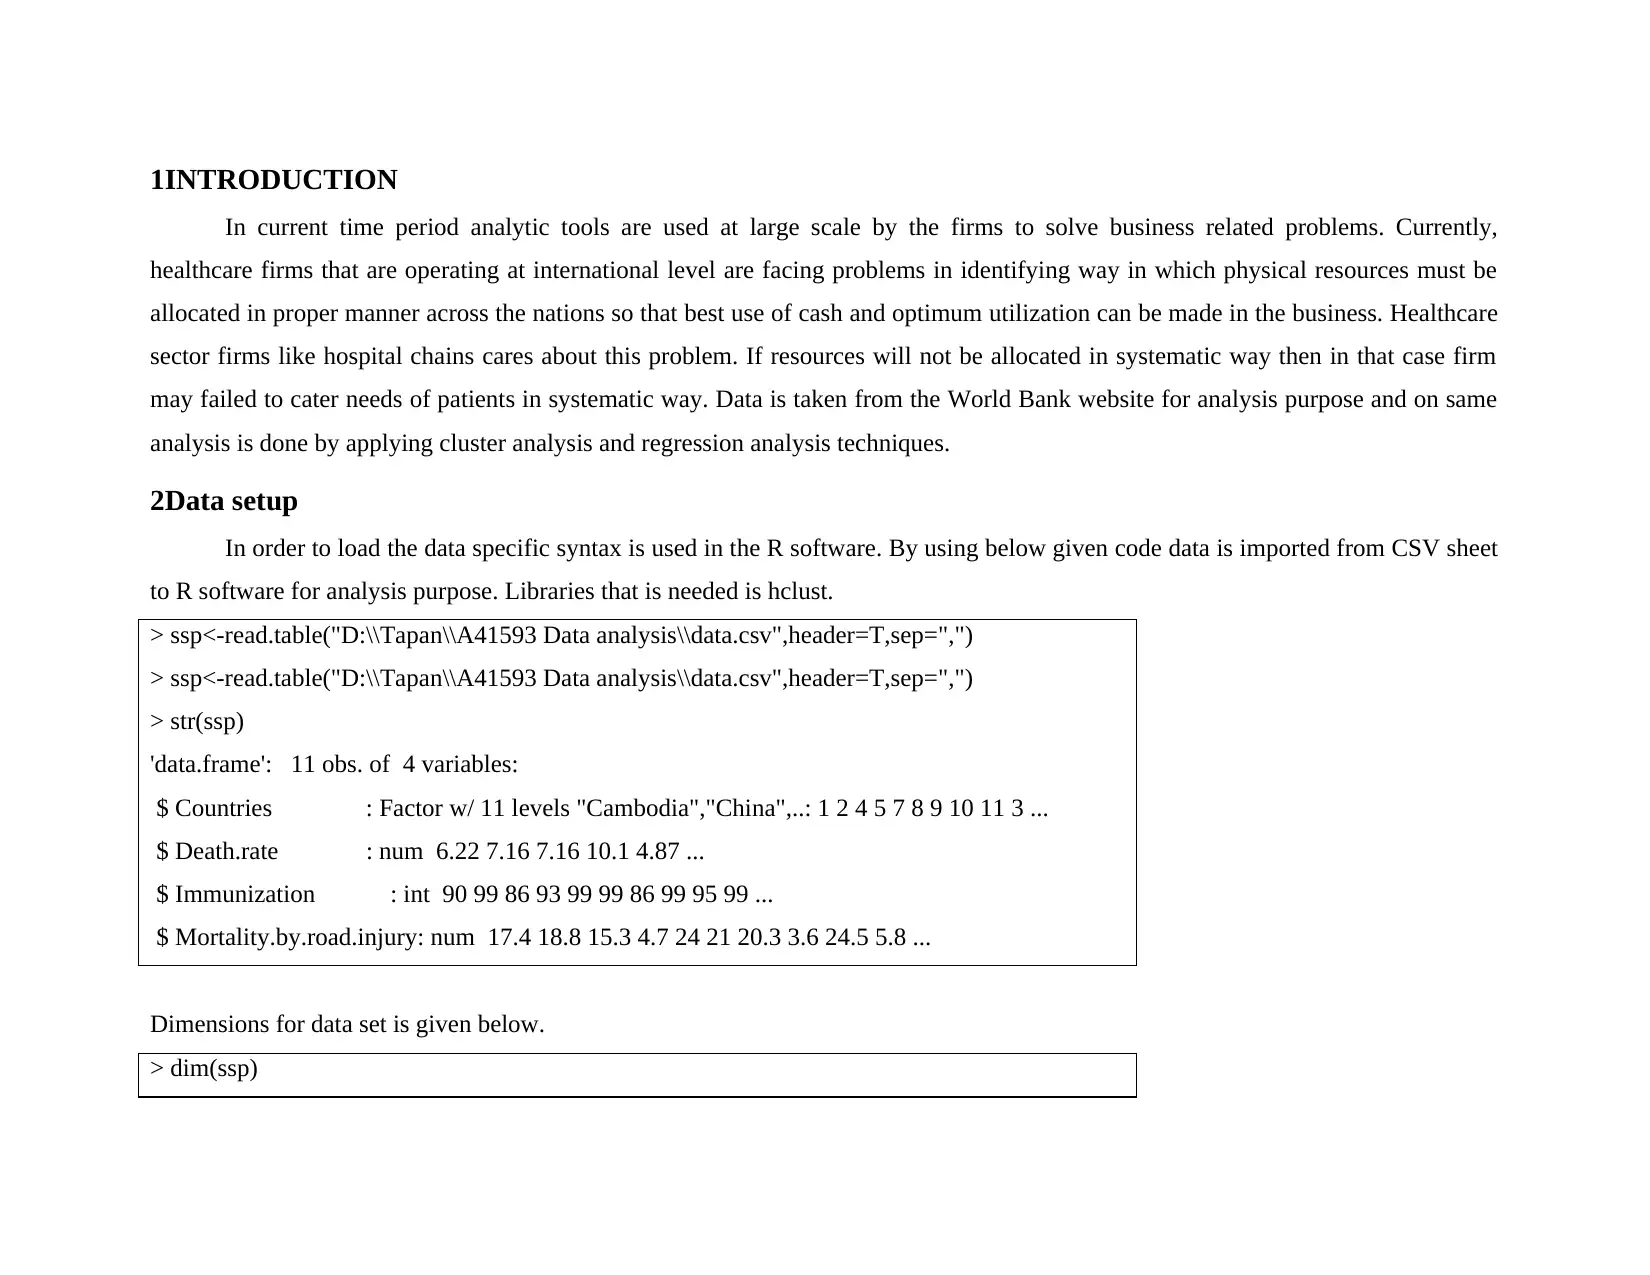
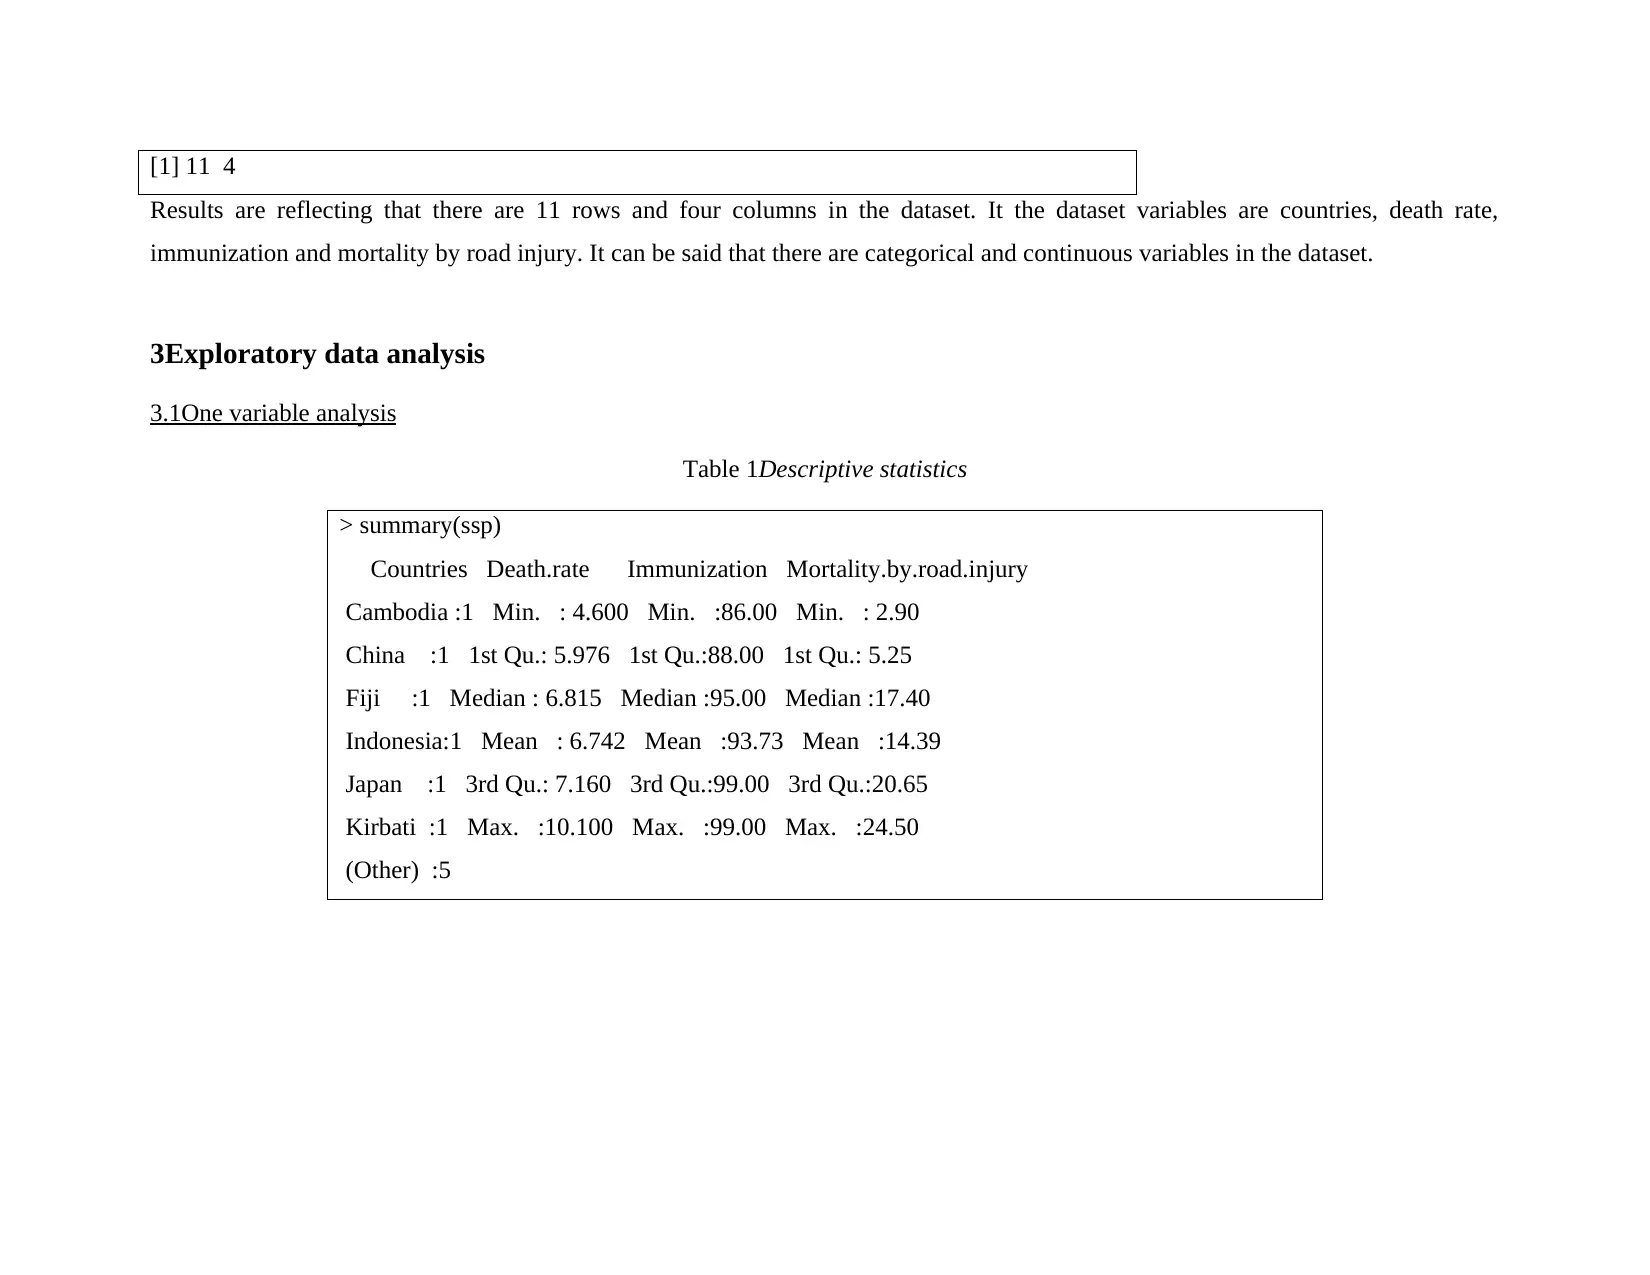
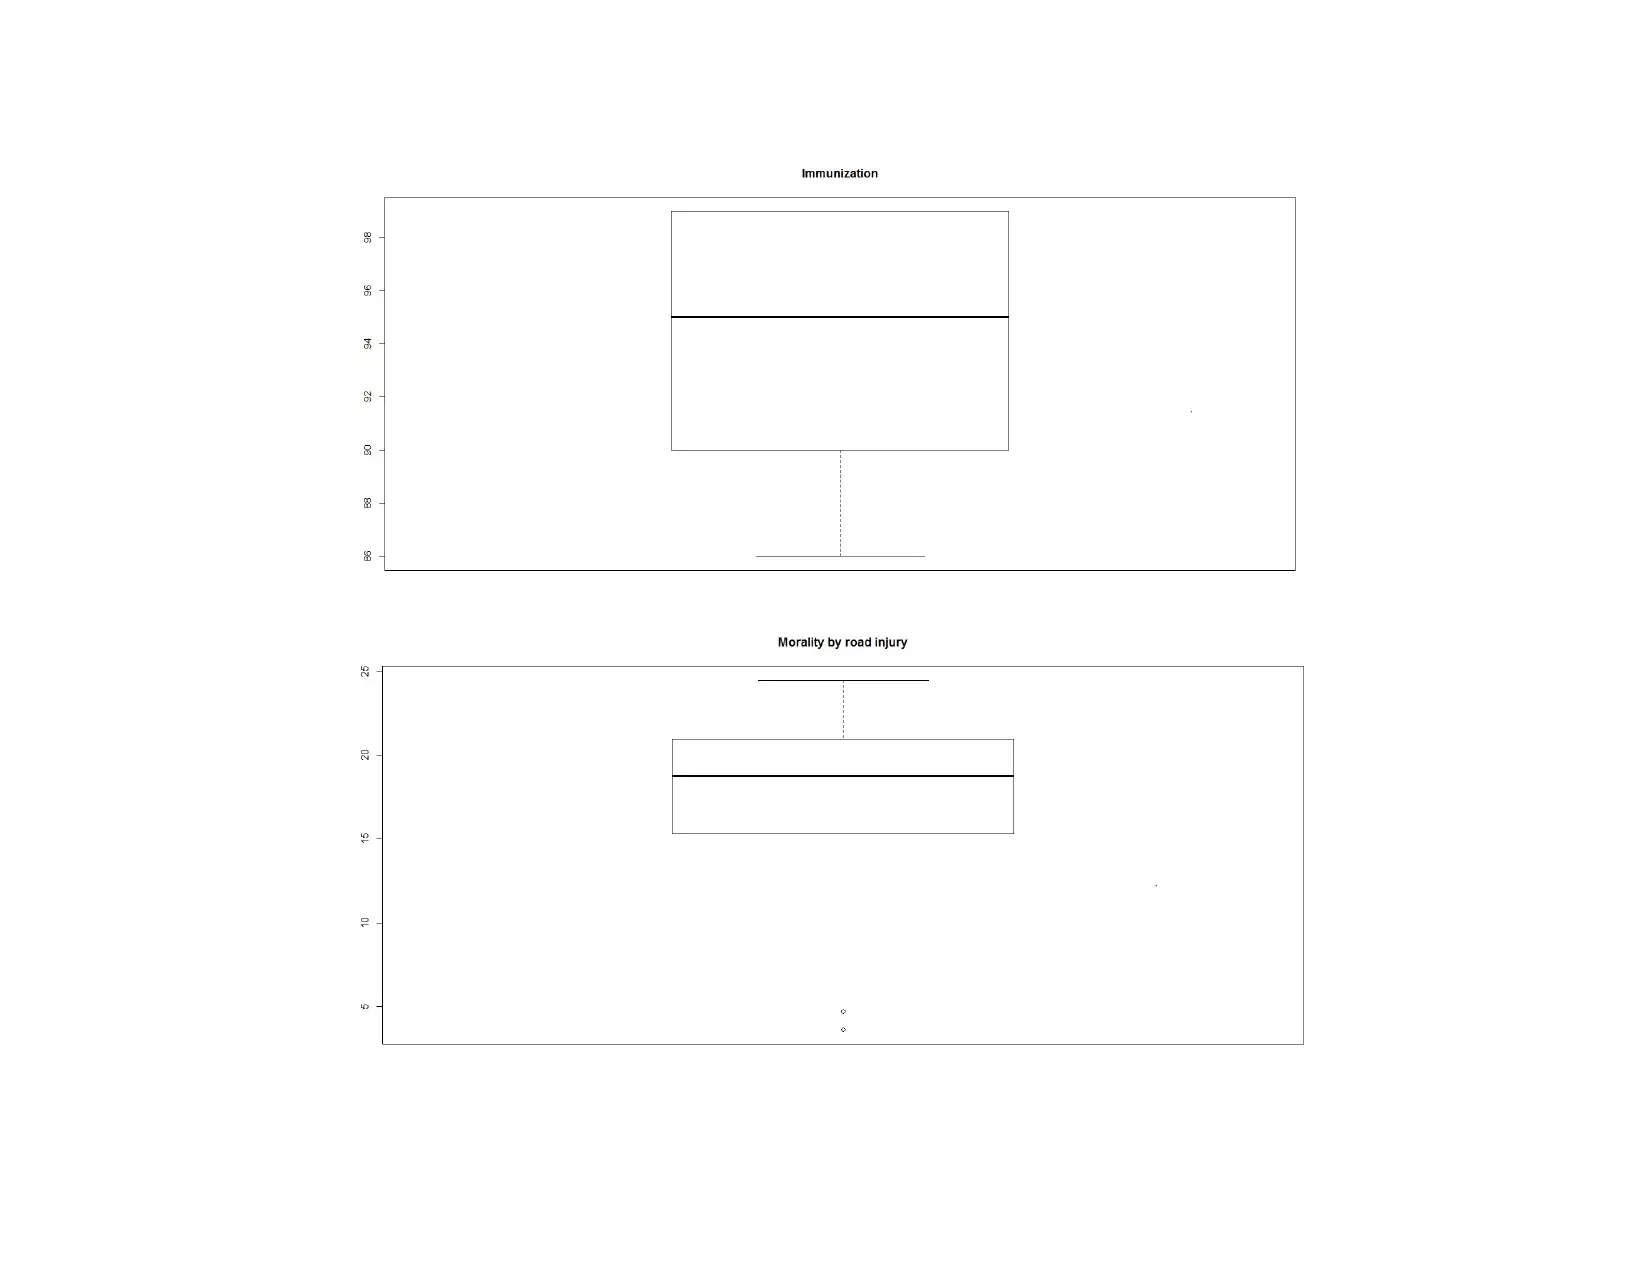
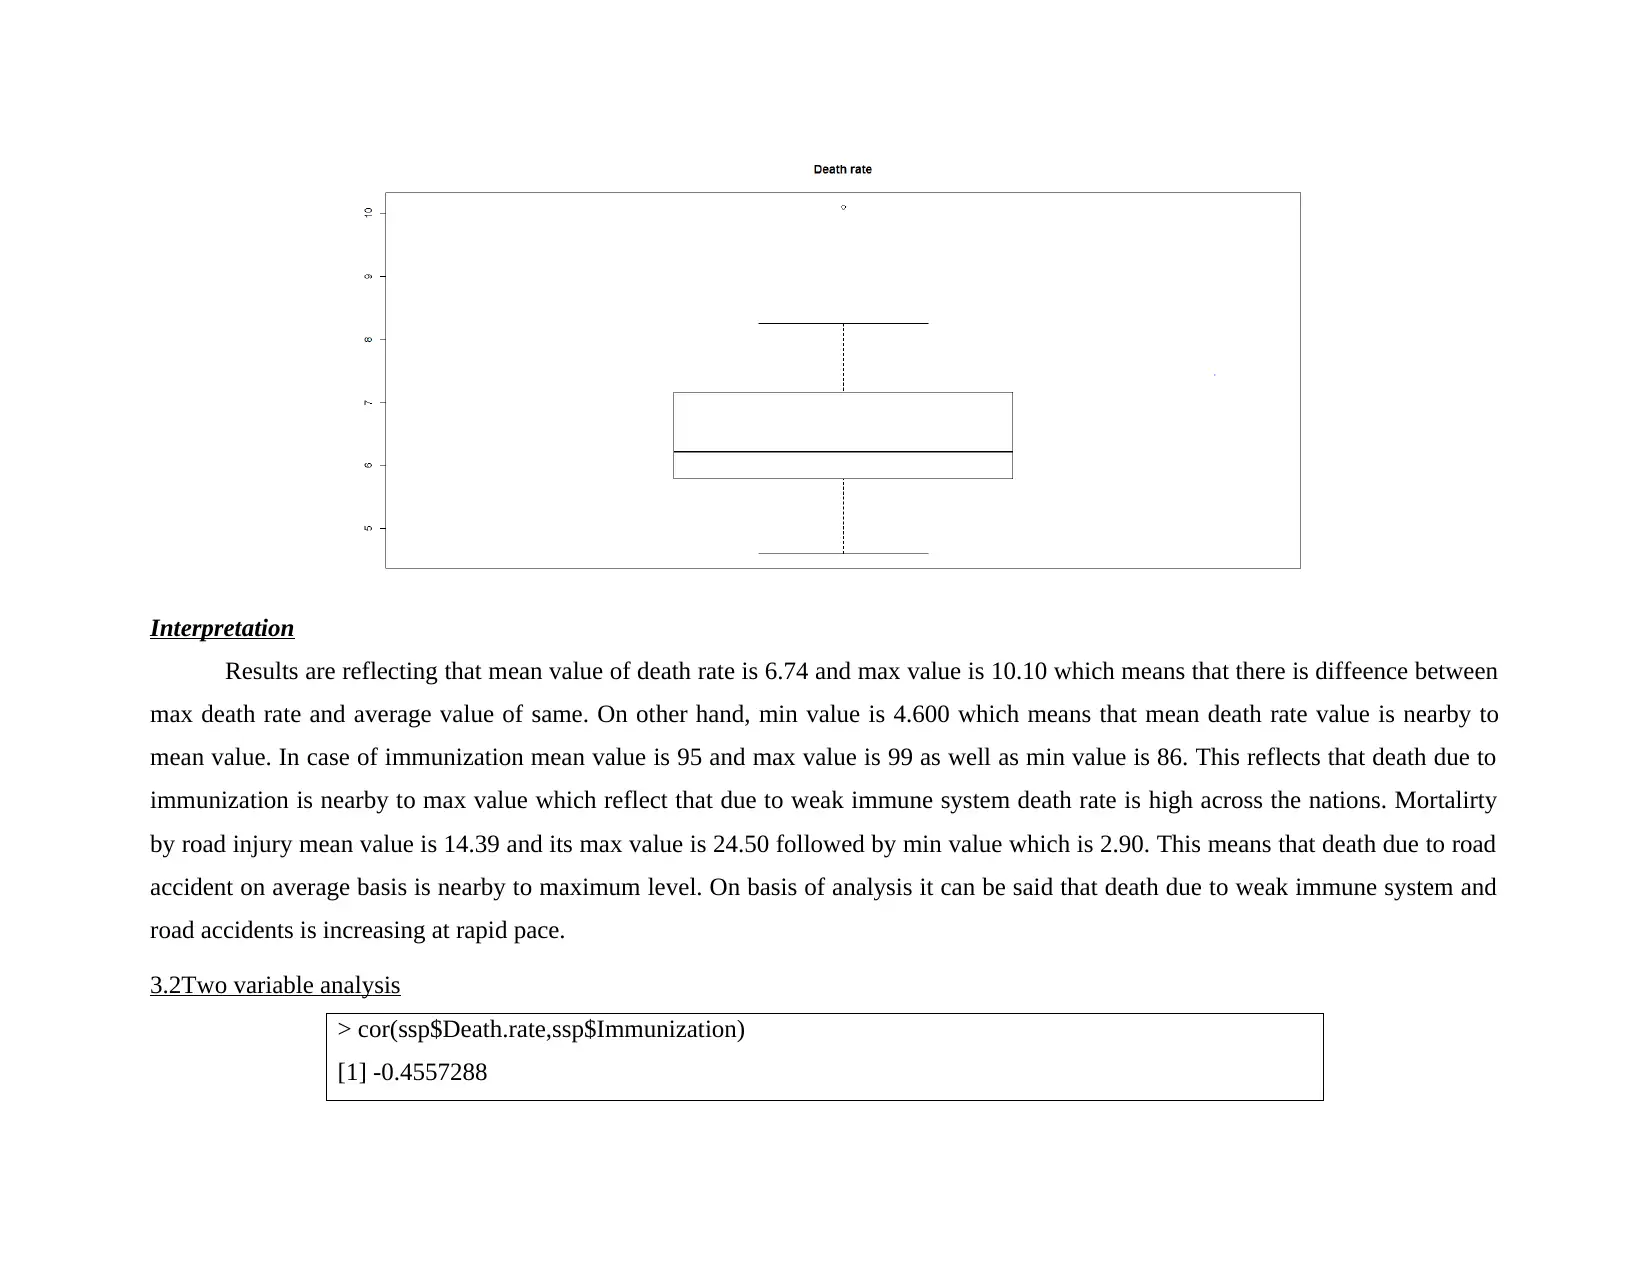
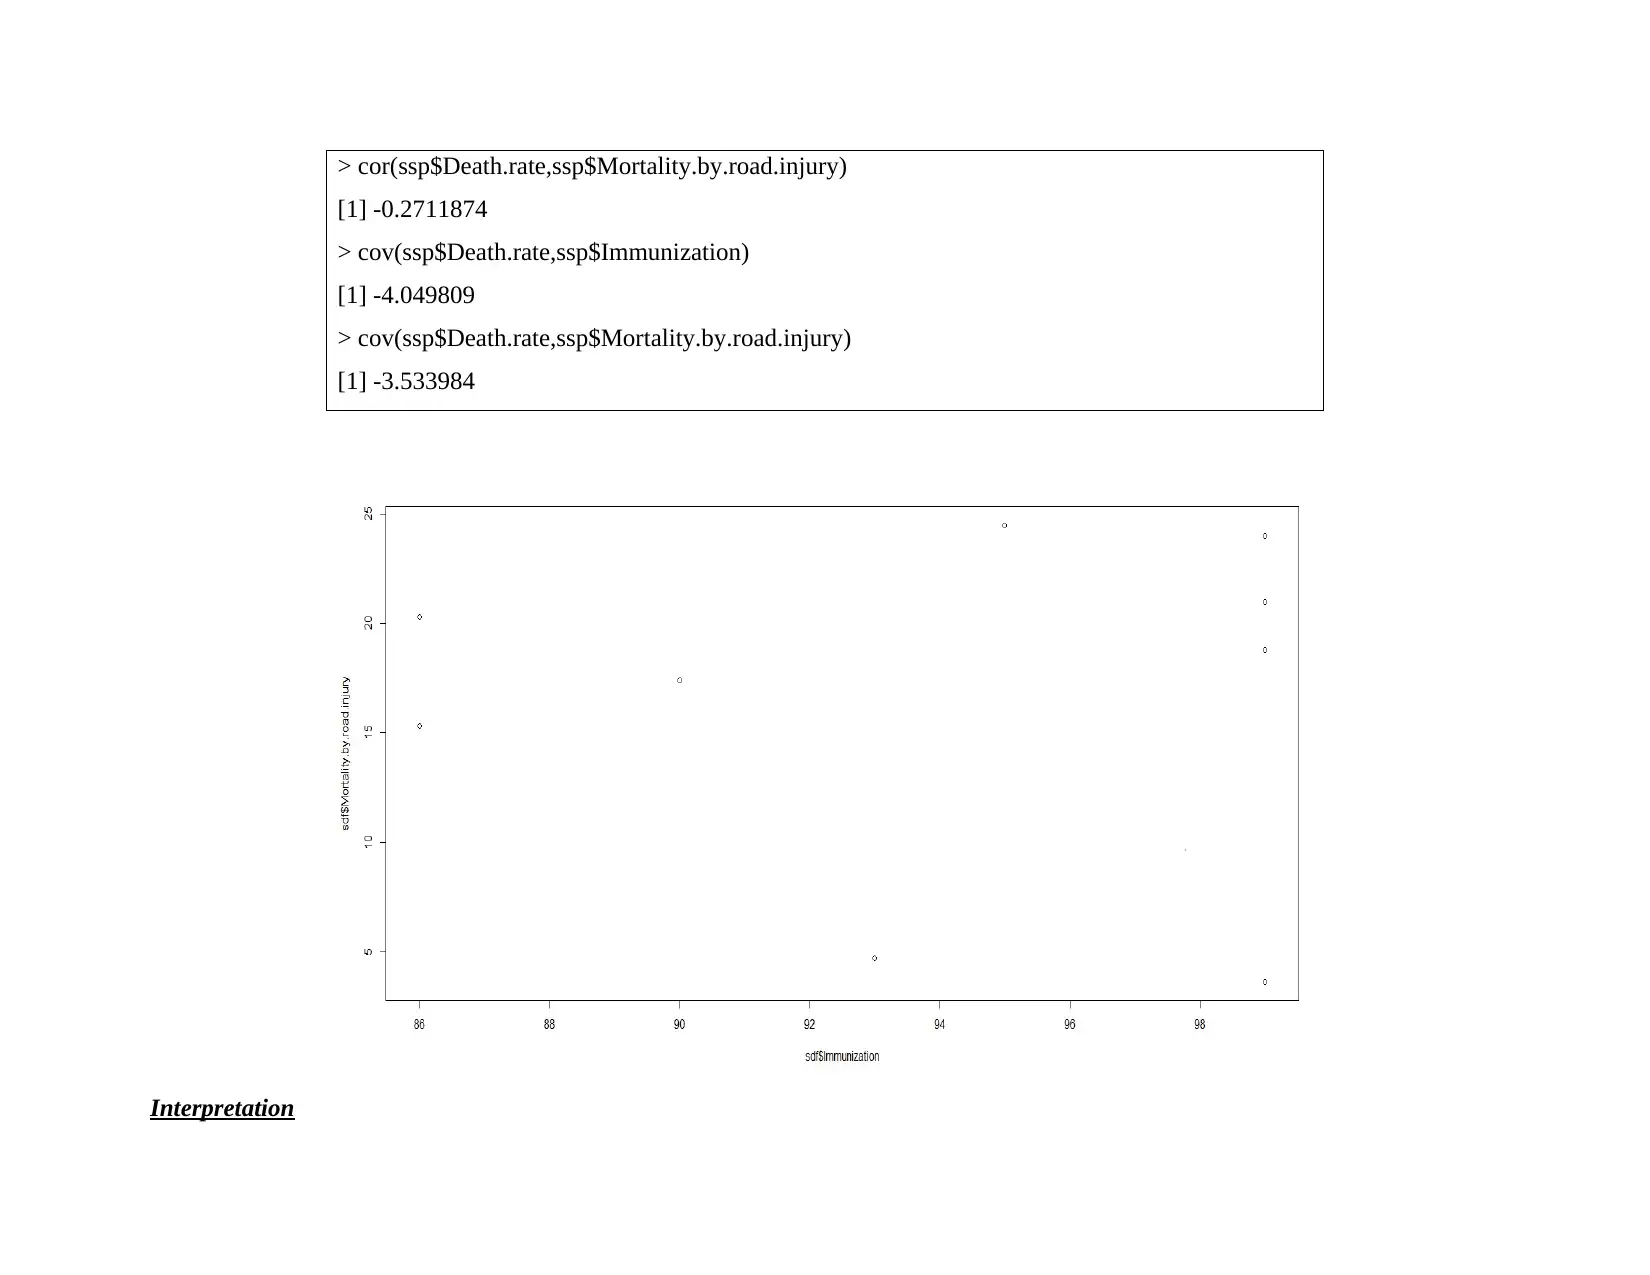
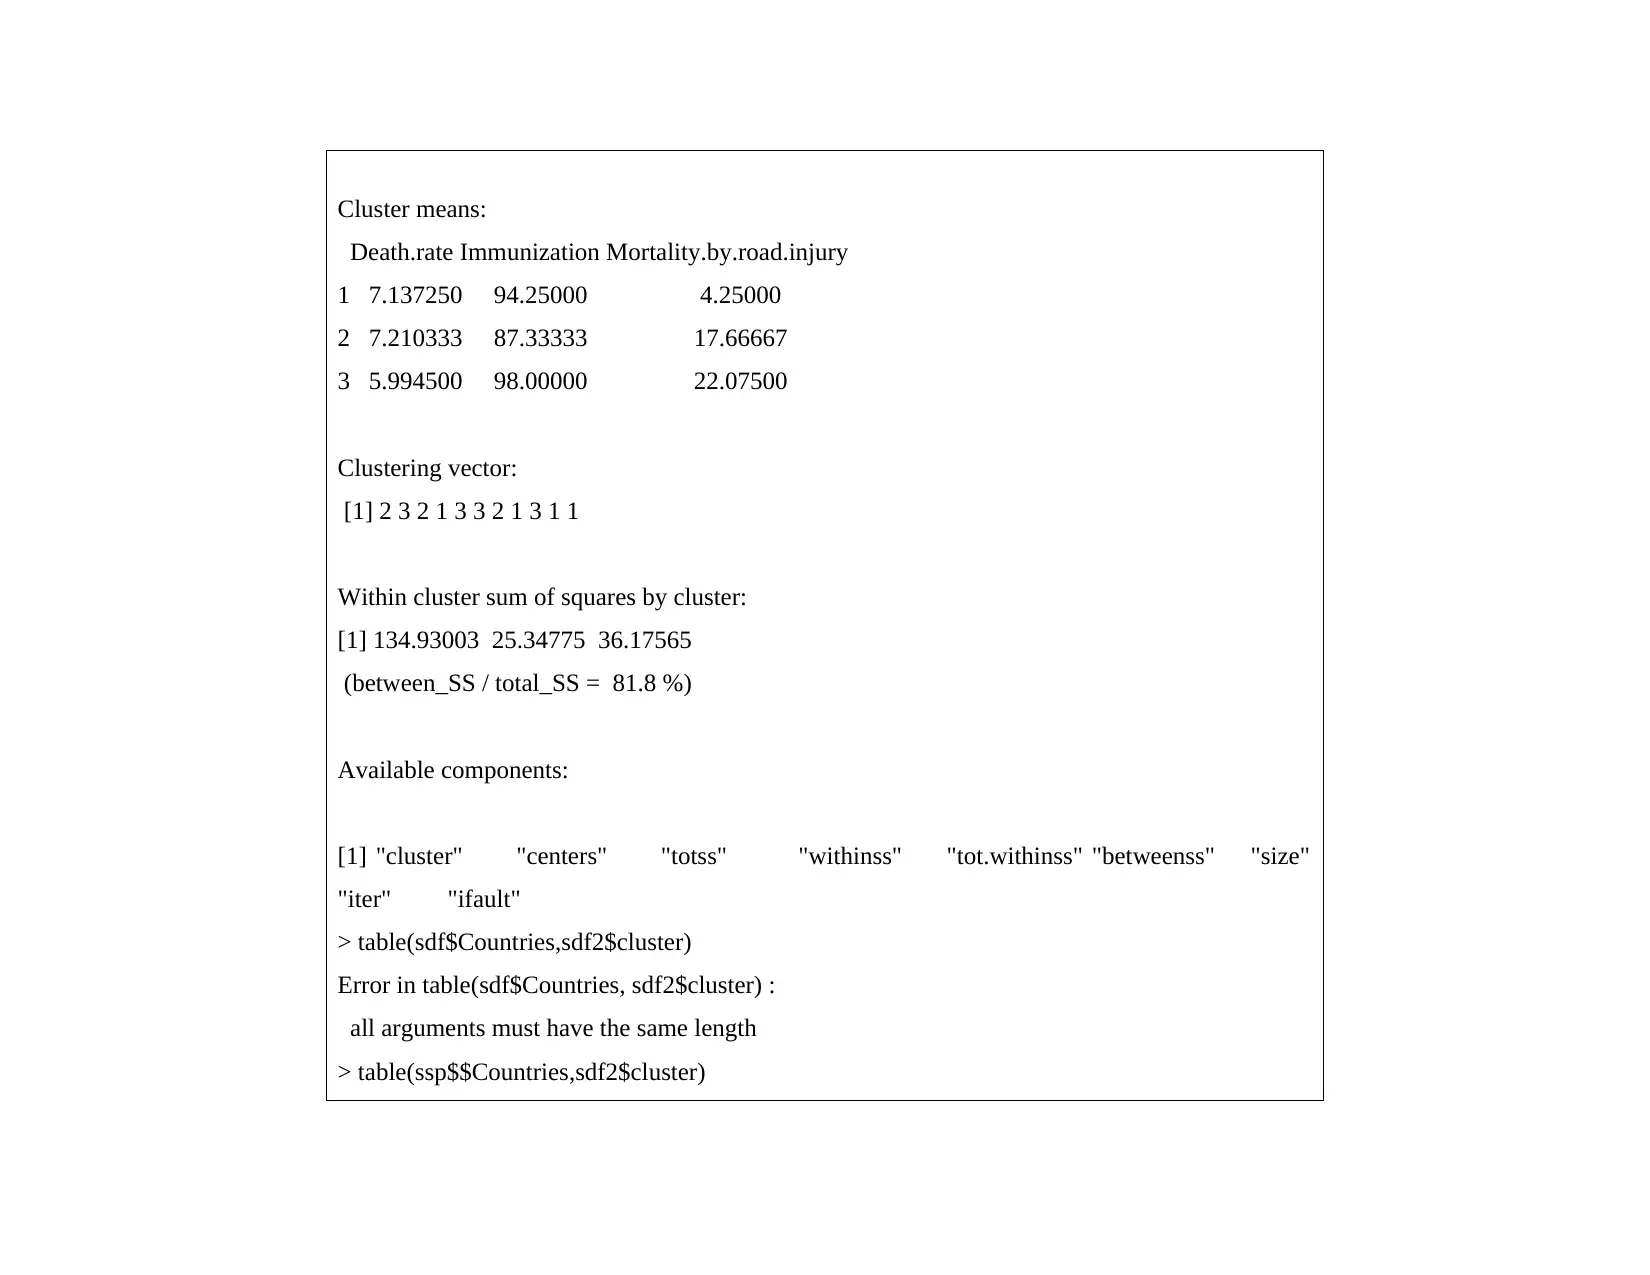
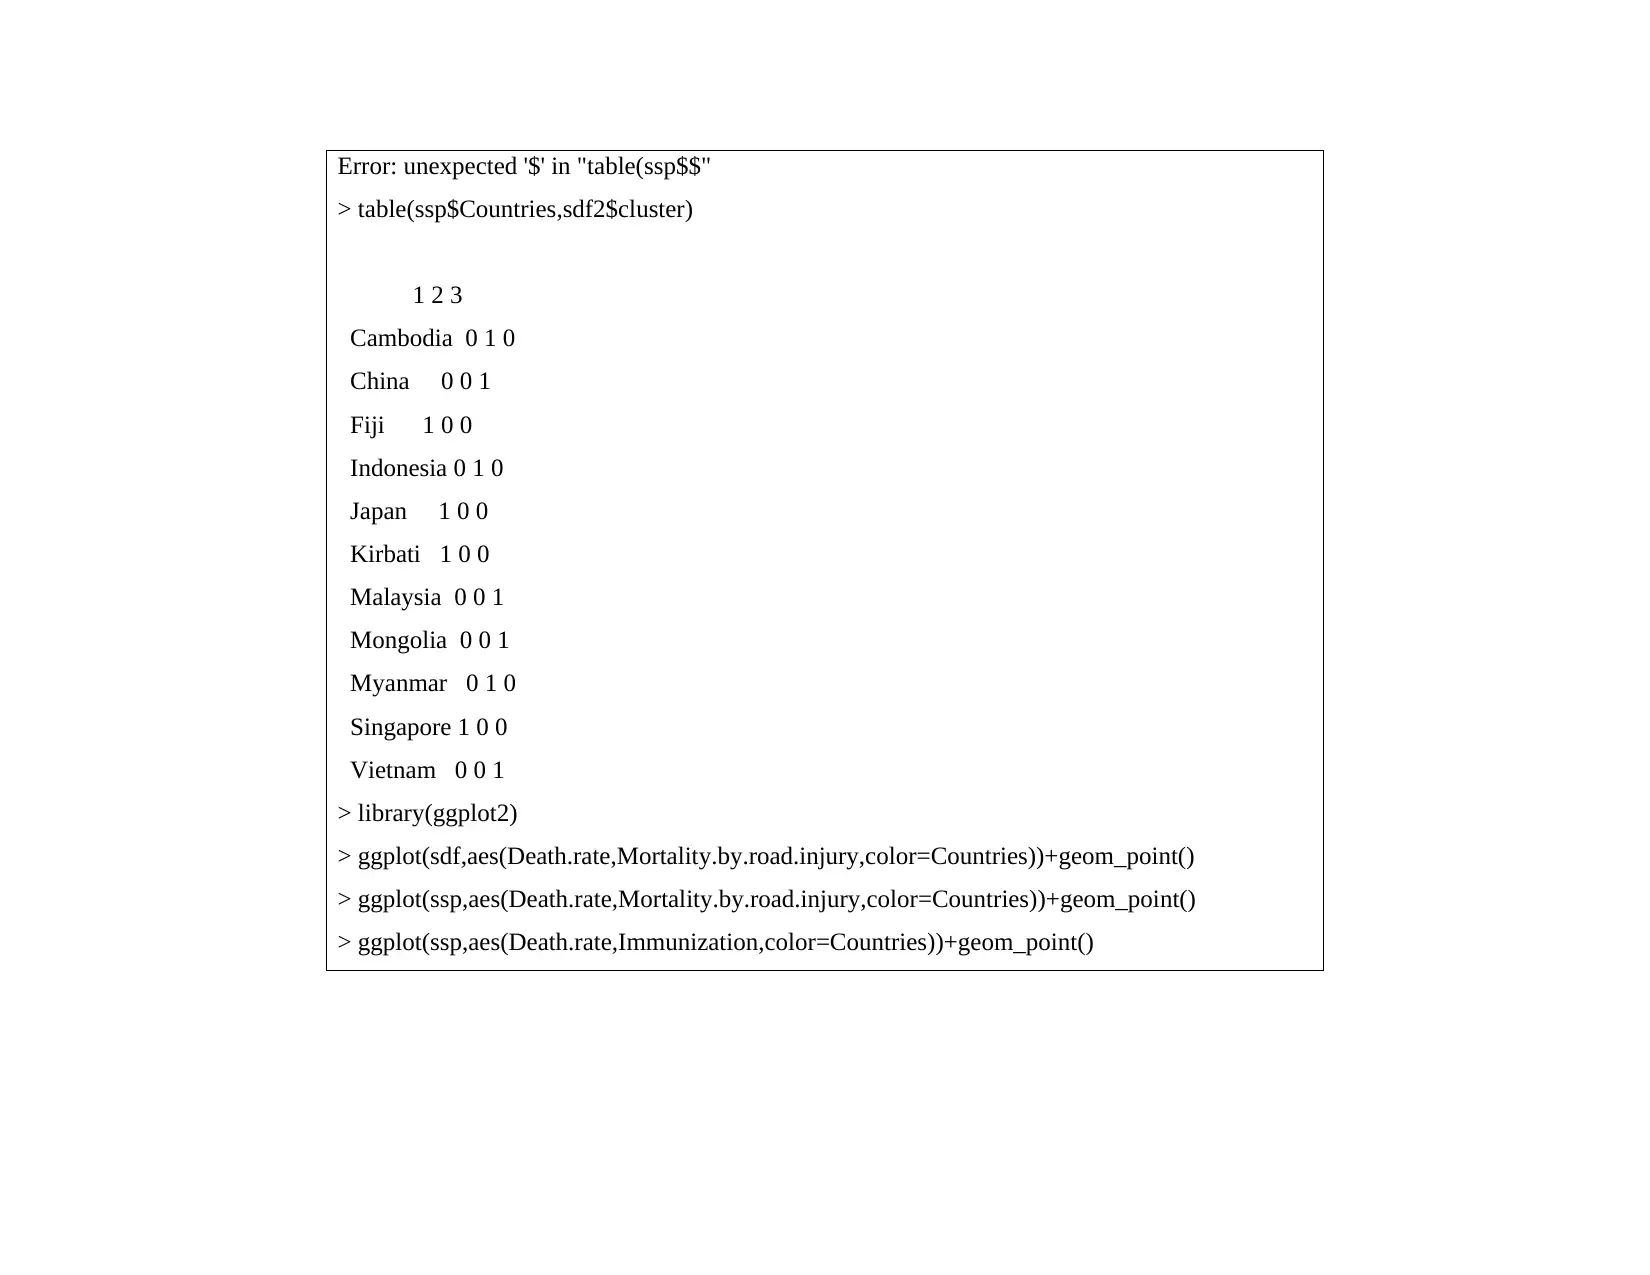
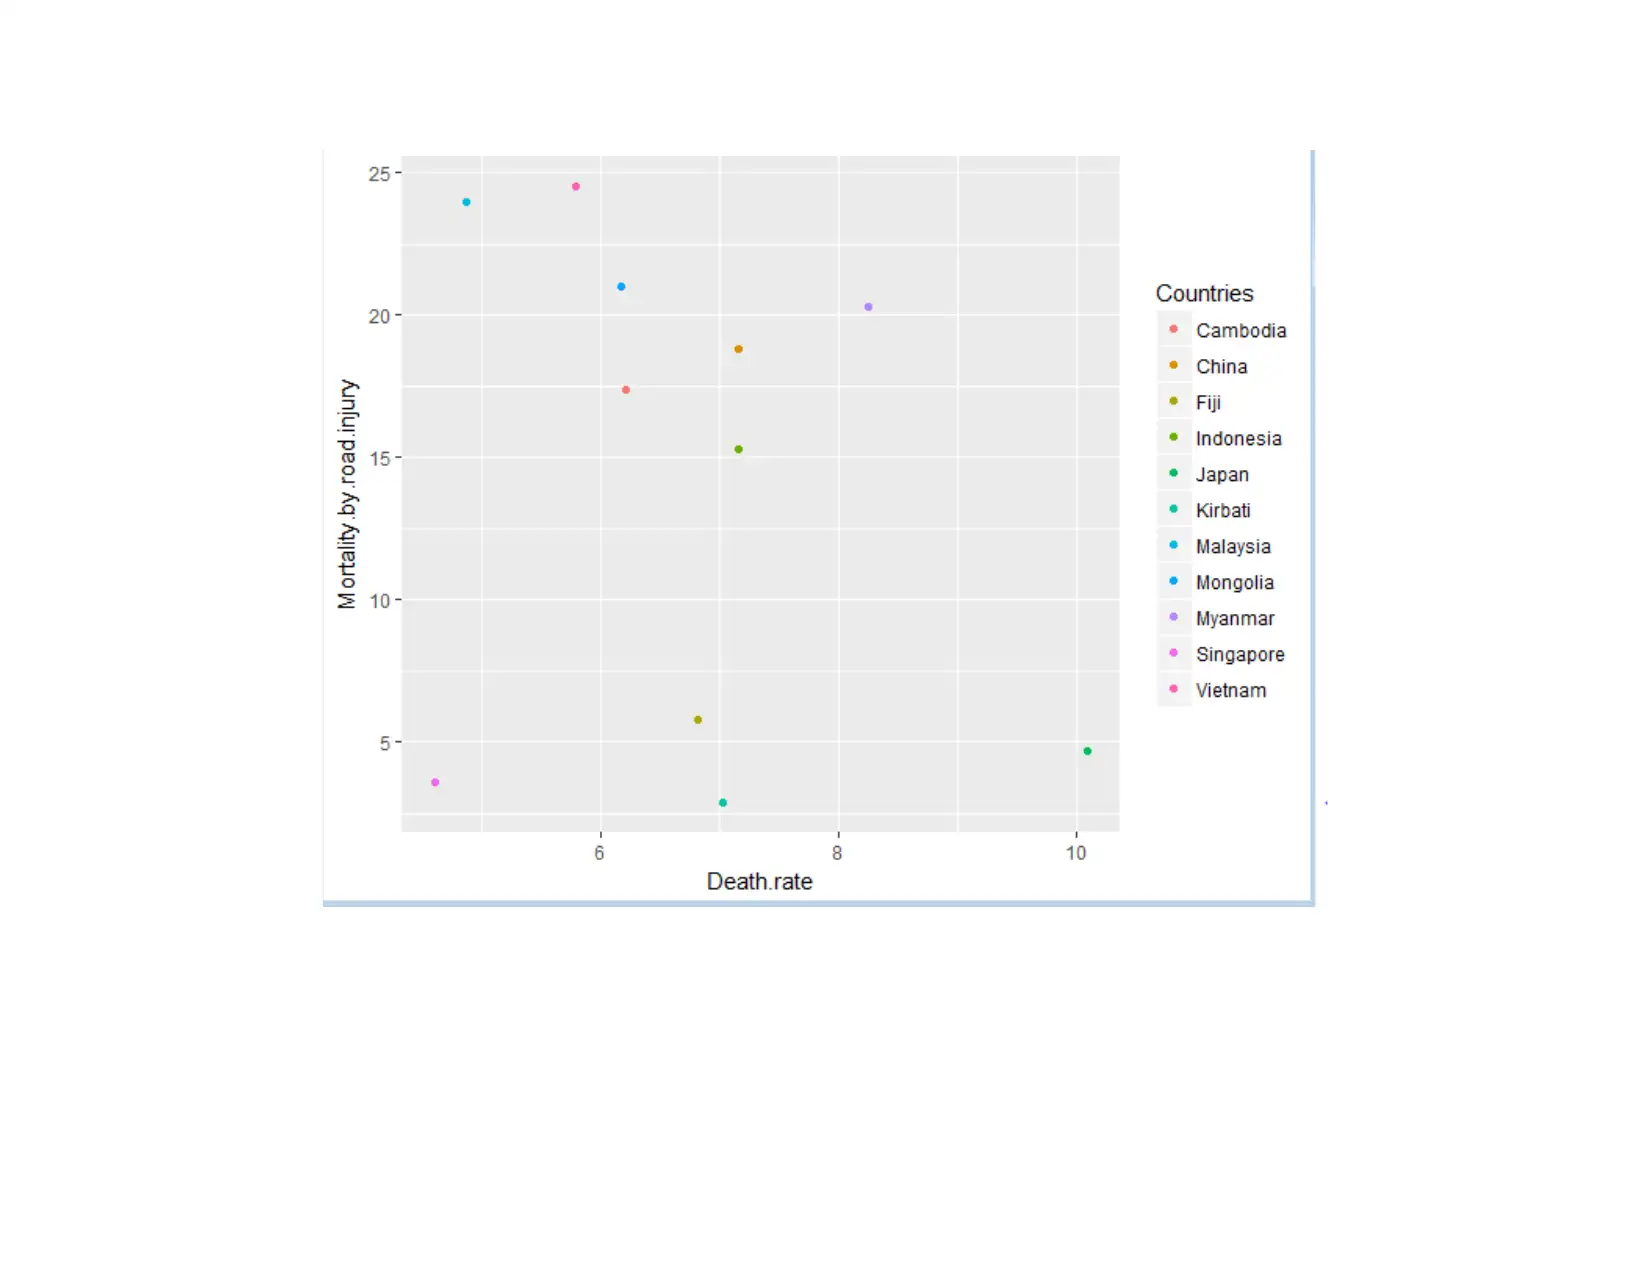
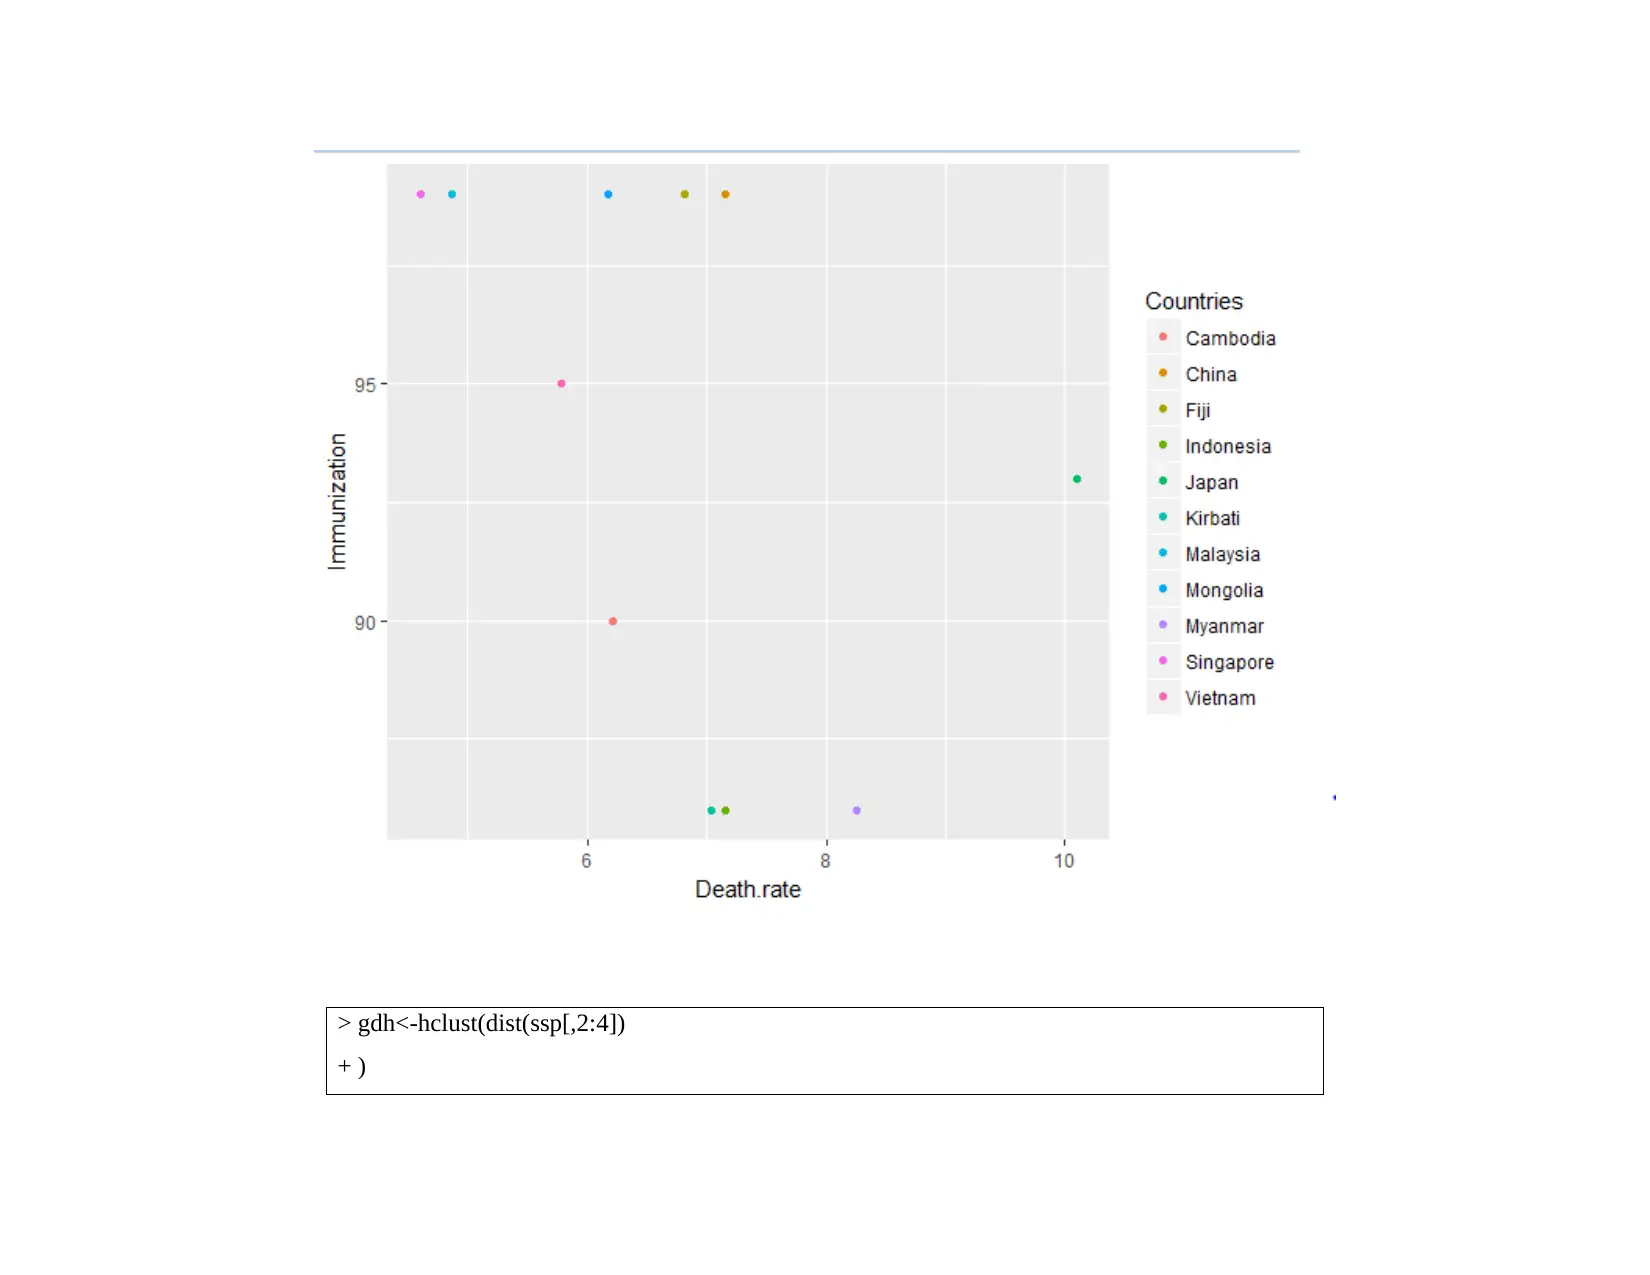
This data analysis project investigates healthcare resource allocation challenges faced by international firms. The project utilizes data from the World Bank website and employs cluster analysis (K-means and hierarchical clustering) and linear regression techniques to analyze relationships between variables such as death rate, immunization, and mortality by road injury. The analysis involves data setup in R, exploratory data analysis (one and two variable analysis), and advanced analysis including the application of K-means clustering to group countries based on similarities in health-related indicators. Linear regression is used to determine the significance of relationships between variables, testing hypotheses about the impact of immunization and road injuries on death rates. The findings suggest that resource allocation policies can be tailored to specific clusters of countries with similar health profiles. The conclusion highlights the key insights derived from the analysis, emphasizing the factors influencing death rates and the implications for healthcare resource management.

DATA ANALYSIS
Paraphrase This Document
Need a fresh take? Get an instant paraphrase of this document with our AI Paraphraser

TABLE OF CONTENTS
1INTRODUCTION.....................................................................................................................................................................................3
2Data setup..................................................................................................................................................................................................3
3Exploratory data analysis...........................................................................................................................................................................4
3.1One variable analysis..........................................................................................................................................................................4
3.2Two variable analysis.........................................................................................................................................................................6
4Advanced analysis.....................................................................................................................................................................................8
4.1 Cluster analysis..................................................................................................................................................................................8
4.2Linear regression..............................................................................................................................................................................15
5Conclusion...............................................................................................................................................................................................20
6Reflection.................................................................................................................................................................................................20
REFERENCES..........................................................................................................................................................................................21

1INTRODUCTION
In current time period analytic tools are used at large scale by the firms to solve business related problems. Currently,
healthcare firms that are operating at international level are facing problems in identifying way in which physical resources must be
allocated in proper manner across the nations so that best use of cash and optimum utilization can be made in the business. Healthcare
sector firms like hospital chains cares about this problem. If resources will not be allocated in systematic way then in that case firm
may failed to cater needs of patients in systematic way. Data is taken from the World Bank website for analysis purpose and on same
analysis is done by applying cluster analysis and regression analysis techniques.
2Data setup
In order to load the data specific syntax is used in the R software. By using below given code data is imported from CSV sheet
to R software for analysis purpose. Libraries that is needed is hclust.
> ssp<-read.table("D:\\Tapan\\A41593 Data analysis\\data.csv",header=T,sep=",")
> str(ssp)
'data.frame': 11 obs. of 4 variables:
$ Countries : Factor w/ 11 levels "Cambodia","China",..: 1 2 4 5 7 8 9 10 11 3 ...
$ Death.rate : num 6.22 7.16 7.16 10.1 4.87 ...
$ Immunization : int 90 99 86 93 99 99 86 99 95 99 ...
$ Mortality.by.road.injury: num 17.4 18.8 15.3 4.7 24 21 20.3 3.6 24.5 5.8 ...
Dimensions for data set is given below.
> dim(ssp)
⊘ This is a preview!⊘
Do you want full access?
Subscribe today to unlock all pages.

Trusted by 1+ million students worldwide

[1] 11 4
Results are reflecting that there are 11 rows and four columns in the dataset. It the dataset variables are countries, death rate,
immunization and mortality by road injury. It can be said that there are categorical and continuous variables in the dataset.
3Exploratory data analysis
3.1One variable analysis
Table 1Descriptive statistics
> summary(ssp)
Countries Death.rate Immunization Mortality.by.road.injury
Cambodia :1 Min. : 4.600 Min. :86.00 Min. : 2.90
China :1 1st Qu.: 5.976 1st Qu.:88.00 1st Qu.: 5.25
Fiji :1 Median : 6.815 Median :95.00 Median :17.40
Indonesia:1 Mean : 6.742 Mean :93.73 Mean :14.39
Japan :1 3rd Qu.: 7.160 3rd Qu.:99.00 3rd Qu.:20.65
Kirbati :1 Max. :10.100 Max. :99.00 Max. :24.50
(Other) :5
Paraphrase This Document
Need a fresh take? Get an instant paraphrase of this document with our AI Paraphraser


Interpretation
Results are reflecting that mean value of death rate is 6.74 and max value is 10.10 which means that there is diffeence between
max death rate and average value of same. On other hand, min value is 4.600 which means that mean death rate value is nearby to
mean value. In case of immunization mean value is 95 and max value is 99 as well as min value is 86. This reflects that death due to
immunization is nearby to max value which reflect that due to weak immune system death rate is high across the nations. Mortalirty
by road injury mean value is 14.39 and its max value is 24.50 followed by min value which is 2.90. This means that death due to road
accident on average basis is nearby to maximum level. On basis of analysis it can be said that death due to weak immune system and
road accidents is increasing at rapid pace.
3.2Two variable analysis
> cor(ssp$Death.rate,ssp$Immunization)
[1] -0.4557288
⊘ This is a preview!⊘
Do you want full access?
Subscribe today to unlock all pages.

Trusted by 1+ million students worldwide

> cor(ssp$Death.rate,ssp$Mortality.by.road.injury)
[1] -0.2711874
> cov(ssp$Death.rate,ssp$Immunization)
[1] -4.049809
> cov(ssp$Death.rate,ssp$Mortality.by.road.injury)
[1] -3.533984
Interpretation
[1] -0.2711874
> cov(ssp$Death.rate,ssp$Immunization)
[1] -4.049809
> cov(ssp$Death.rate,ssp$Mortality.by.road.injury)
[1] -3.533984
Interpretation
Paraphrase This Document
Need a fresh take? Get an instant paraphrase of this document with our AI Paraphraser

Correlation and covariance value is negative for the variable immunization -0.45 and for variable mortality by road
injury its value is -0.27 which means that with increase in death rate death cause by immunization and road accidents declined. This
fact is verified from the covariance value which is mortality by road injury -3.53 and same for immunization is -4.04. This means that
there are number of factors due to which death rate increased but death due to immunization and road accidents decline to some
extent.
4Advanced analysis
4.1 Cluster analysis
Clustering is the concept under which different variables are grouped together with each other due to similarity in their nature.
Pattern matrix is usually used in the cluster analysis and under this similarity in patterns is identified and on that basis proximity
matrix is developed. On the basis of proximity clusters are formed (Tan, Steinbach and Kumar, 2013). K means clustering is the one
of the method that is used commonly by data scientists. Under this method from the data set R randomly takes any data points to form
the cluster. Thereafter, those data points that have similarity with the randomly selected points are used to form the cluster. After
completion of this stage mean value is computed to form the centroid. Those data points that are nearby to the newly computed mean
value are used to form the clusters. After doing so again mean value of newly formed cluster is computed and relevant data points are
included in the cluster. In this way common data points are step by step taken in to account to form the clusters ( Niknam and Amiri,
2010). It can be said that consistently new mean value of cluster or centroid is computed and data points similar to same is taken in to
account. It can be said that through algorithm of K means in systematic way data is analyzed by the data scientists.
> set.seed(1234)
> sdf2<-kmeans(ssp[,2:4],3)
> sdf2
K-means clustering with 3 clusters of sizes 4, 3, 4

Cluster means:
Death.rate Immunization Mortality.by.road.injury
1 7.137250 94.25000 4.25000
2 7.210333 87.33333 17.66667
3 5.994500 98.00000 22.07500
Clustering vector:
[1] 2 3 2 1 3 3 2 1 3 1 1
Within cluster sum of squares by cluster:
[1] 134.93003 25.34775 36.17565
(between_SS / total_SS = 81.8 %)
Available components:
[1] "cluster" "centers" "totss" "withinss" "tot.withinss" "betweenss" "size"
"iter" "ifault"
> table(sdf$Countries,sdf2$cluster)
Error in table(sdf$Countries, sdf2$cluster) :
all arguments must have the same length
> table(ssp$$Countries,sdf2$cluster)
⊘ This is a preview!⊘
Do you want full access?
Subscribe today to unlock all pages.

Trusted by 1+ million students worldwide

Error: unexpected '$' in "table(ssp$$"
> table(ssp$Countries,sdf2$cluster)
1 2 3
Cambodia 0 1 0
China 0 0 1
Fiji 1 0 0
Indonesia 0 1 0
Japan 1 0 0
Kirbati 1 0 0
Malaysia 0 0 1
Mongolia 0 0 1
Myanmar 0 1 0
Singapore 1 0 0
Vietnam 0 0 1
> library(ggplot2)
> ggplot(sdf,aes(Death.rate,Mortality.by.road.injury,color=Countries))+geom_point()
> ggplot(ssp,aes(Death.rate,Mortality.by.road.injury,color=Countries))+geom_point()
> ggplot(ssp,aes(Death.rate,Immunization,color=Countries))+geom_point()
Paraphrase This Document
Need a fresh take? Get an instant paraphrase of this document with our AI Paraphraser


> gdh<-hclust(dist(ssp[,2:4])
+ )
+ )
⊘ This is a preview!⊘
Do you want full access?
Subscribe today to unlock all pages.

Trusted by 1+ million students worldwide
1 out of 21
Your All-in-One AI-Powered Toolkit for Academic Success.
 +13062052269
info@desklib.com
Available 24*7 on WhatsApp / Email
Unlock your academic potential
Copyright © 2020–2025 A2Z Services. All Rights Reserved. Developed and managed by ZUCOL.

