Data Analysis and Business Intelligence Homework, University Analysis

Verified

Added on  2020/05/28

|5
|589
|49
Homework Assignment
AI Summary
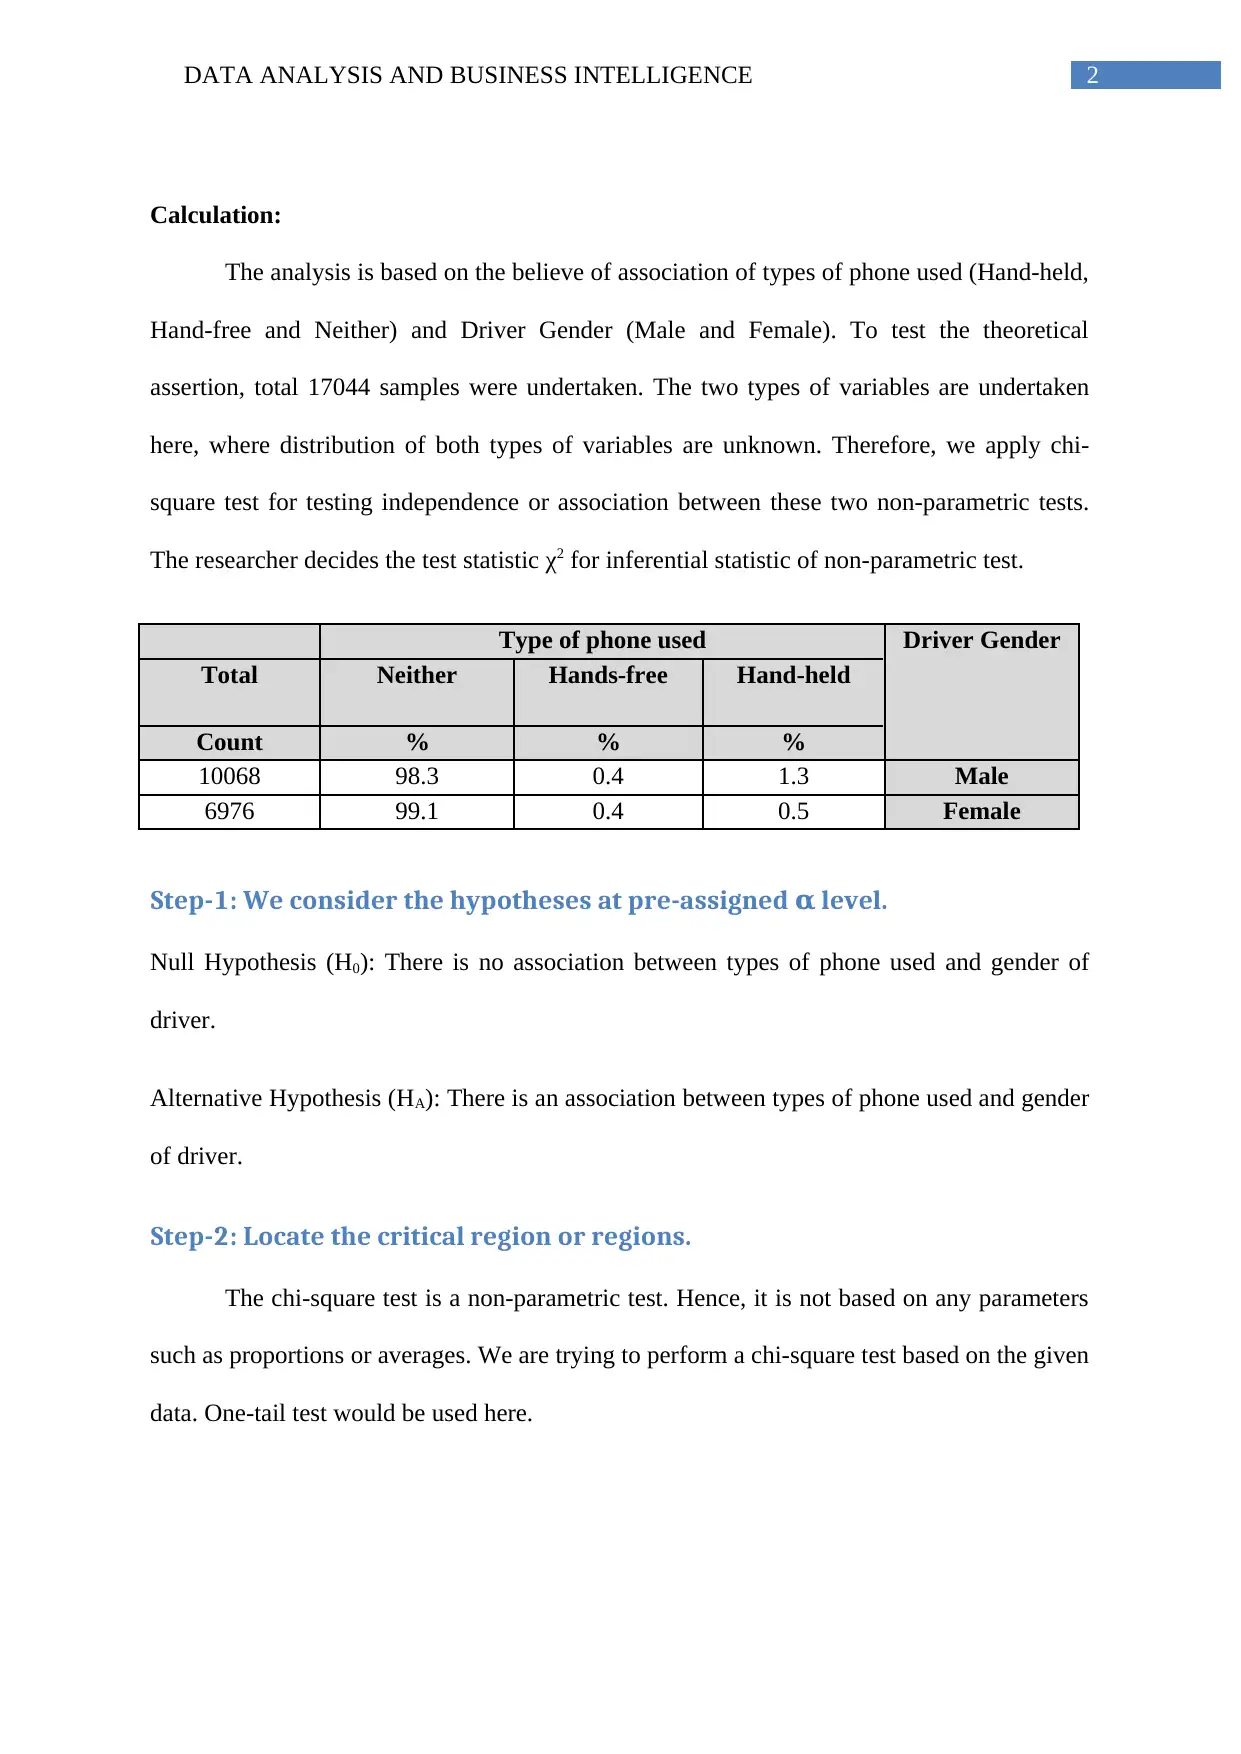
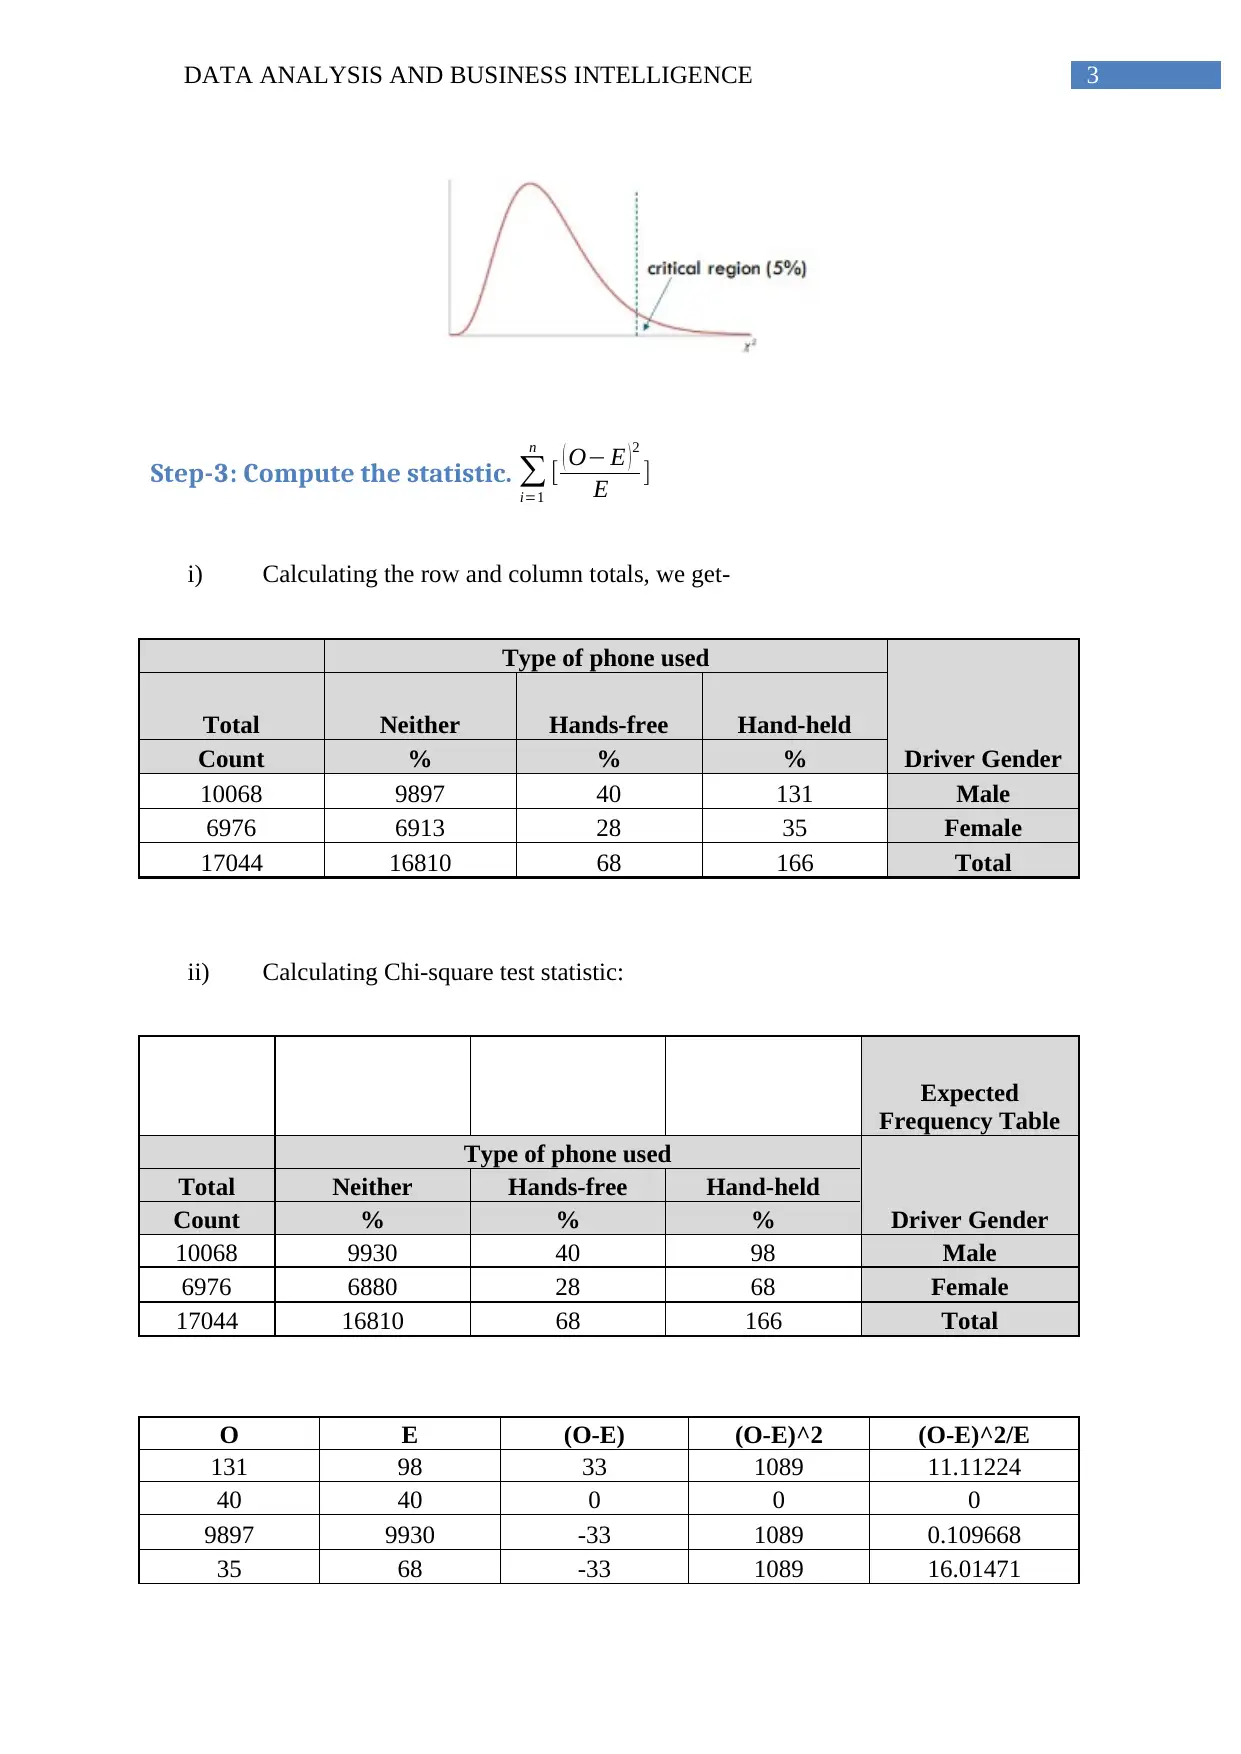
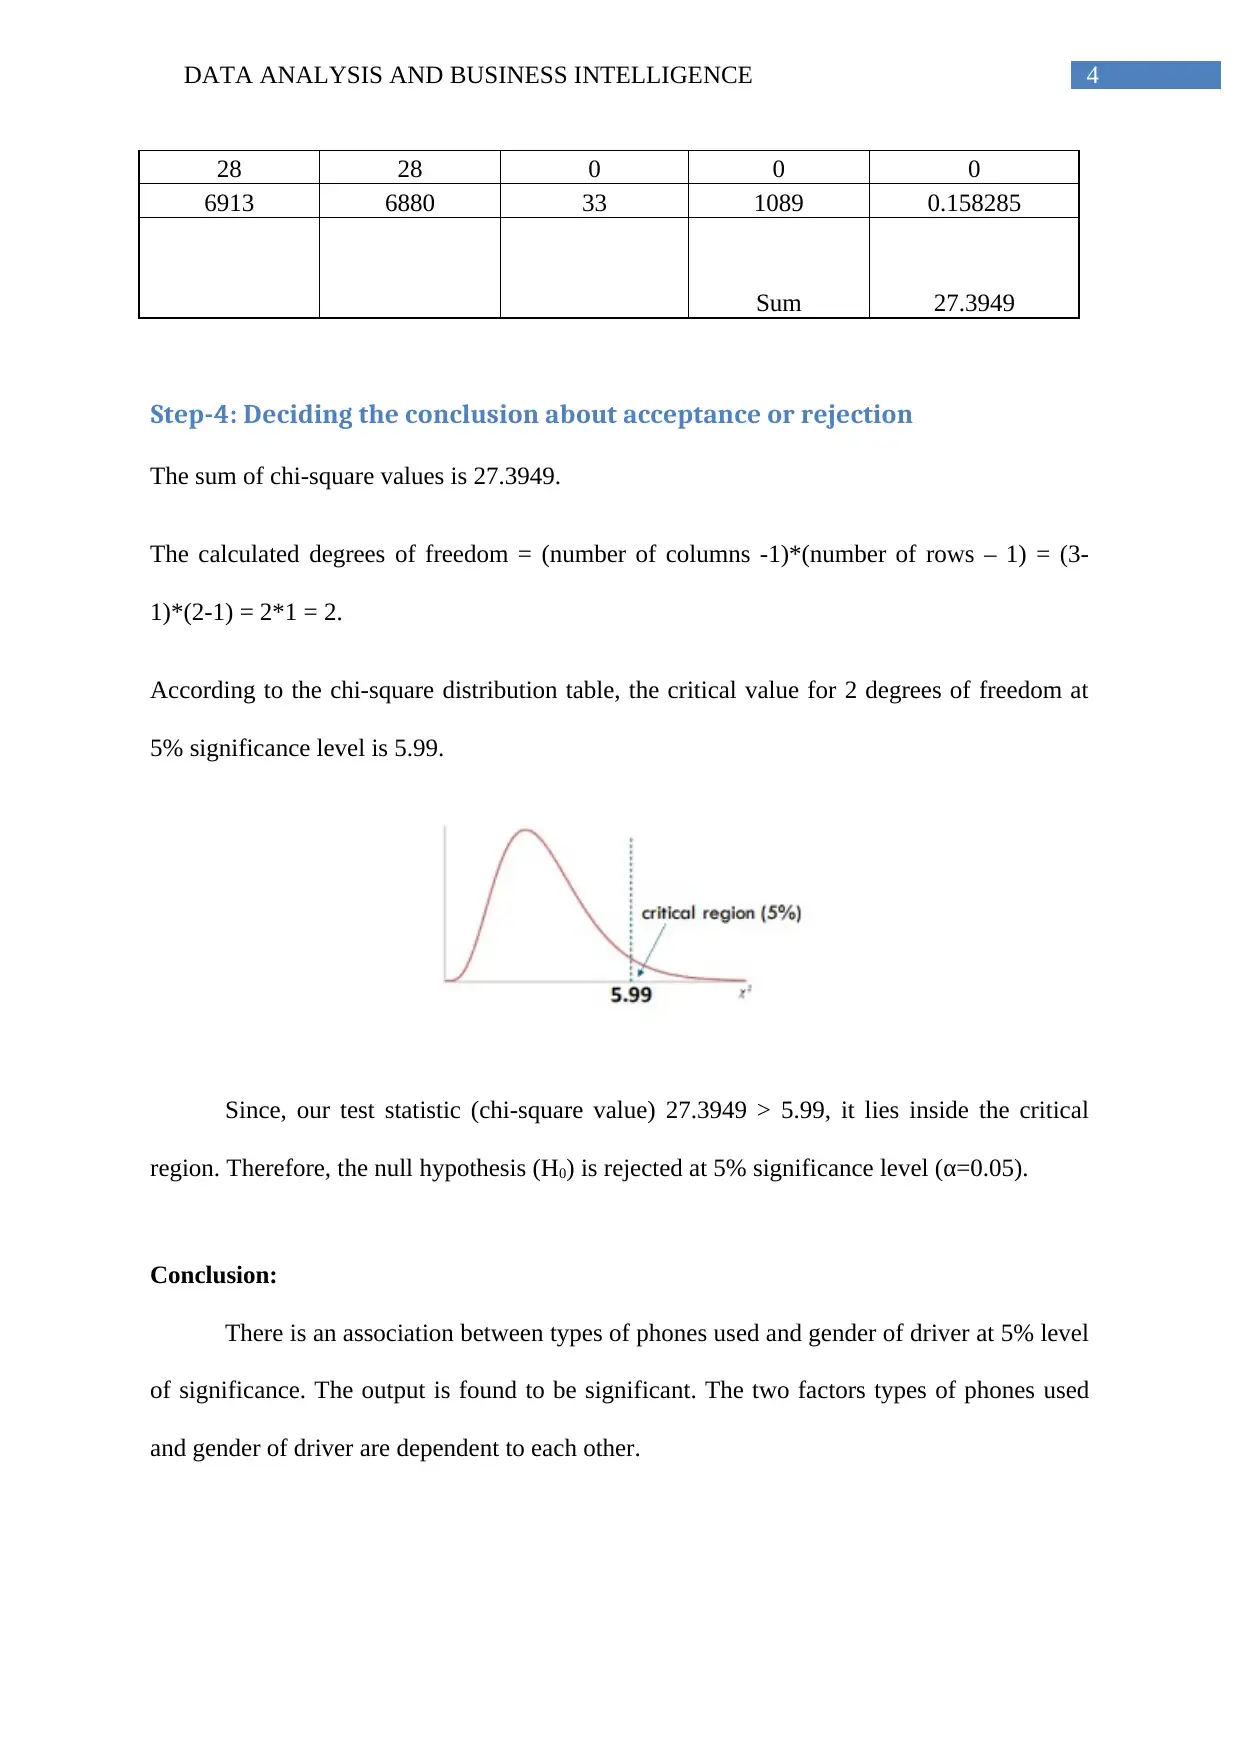
This assignment focuses on data analysis and business intelligence, specifically utilizing a Chi-Square test to analyze the relationship between the types of phones used by drivers (hand-held, hands-free, or neither) and their gender (male or female). The analysis involves a sample of 17,044 observations. The assignment outlines the steps of hypothesis testing, including setting up null and alternative hypotheses, determining the critical region, calculating the test statistic, and drawing conclusions. The Chi-Square test is used to determine if there is an association between the two variables. The calculated Chi-square value is compared to the critical value to determine whether to accept or reject the null hypothesis. The analysis concludes that there is a significant association between the types of phones used and the gender of the driver at a 5% significance level, indicating that these two factors are dependent on each other. The assignment provides a detailed breakdown of the calculations and the reasoning behind the statistical analysis.
Document Page
Running head: DATA ANALYSIS AND BUSINESS INTELLIGENCE
Data Analysis and Business Intelligence
Name of the Student:
Name of the University:
Author’s note:
tabler-icon-diamond-filled.svg

Paraphrase This Document

Need a fresh take? Get an instant paraphrase of this document with our AI Paraphraser
Document Page
1DATA ANALYSIS AND BUSINESS INTELLIGENCE
Table of Contents
Calculation:................................................................................................................................3
Step-1: We consider the hypotheses at pre-assigned α level..................................................3
Step-2: Locate the critical region or regions..........................................................................3
Step-3: Compute the statistic.................................................................................................3
Step-4: Deciding the conclusion about acceptance or rejection.............................................4
Conclusion:................................................................................................................................5
Document Page
2DATA ANALYSIS AND BUSINESS INTELLIGENCE
Calculation:
The analysis is based on the believe of association of types of phone used (Hand-held,
Hand-free and Neither) and Driver Gender (Male and Female). To test the theoretical
assertion, total 17044 samples were undertaken. The two types of variables are undertaken
here, where distribution of both types of variables are unknown. Therefore, we apply chi-
square test for testing independence or association between these two non-parametric tests.
The researcher decides the test statistic χ2 for inferential statistic of non-parametric test.
Driver GenderType of phone used
Hand-heldHands-freeNeitherTotal
%%%Count
Male1.30.498.310068
Female0.50.499.16976
Step-1: We consider the hypotheses at pre-assigned level.α
Null Hypothesis (H0): There is no association between types of phone used and gender of
driver.
Alternative Hypothesis (HA): There is an association between types of phone used and gender
of driver.
Step-2: Locate the critical region or regions.
The chi-square test is a non-parametric test. Hence, it is not based on any parameters
such as proportions or averages. We are trying to perform a chi-square test based on the given
data. One-tail test would be used here.
Document Page
3DATA ANALYSIS AND BUSINESS INTELLIGENCE
Step-3: Compute the statistic.
i=1
n
[ ( O E ) 2
E ]
i) Calculating the row and column totals, we get-
Driver Gender
Type of phone used
Hand-heldHands-freeNeitherTotal
%%%Count
Male13140989710068
Female352869136976
Total166681681017044
ii) Calculating Chi-square test statistic:
Expected
Frequency Table
Driver Gender
Type of phone used
Hand-heldHands-freeNeitherTotal
%%%Count
Male9840993010068
Female682868806976
Total166681681017044
O E (O-E) (O-E)^2 (O-E)^2/E
131 98 33 1089 11.11224
40 40 0 0 0
9897 9930 -33 1089 0.109668
35 68 -33 1089 16.01471
tabler-icon-diamond-filled.svg

Paraphrase This Document

Need a fresh take? Get an instant paraphrase of this document with our AI Paraphraser
Document Page
4DATA ANALYSIS AND BUSINESS INTELLIGENCE
28 28 0 0 0
6913 6880 33 1089 0.158285
Sum 27.3949
Step-4: Deciding the conclusion about acceptance or rejection
The sum of chi-square values is 27.3949.
The calculated degrees of freedom = (number of columns -1)*(number of rows – 1) = (3-
1)*(2-1) = 2*1 = 2.
According to the chi-square distribution table, the critical value for 2 degrees of freedom at
5% significance level is 5.99.
Since, our test statistic (chi-square value) 27.3949 > 5.99, it lies inside the critical
region. Therefore, the null hypothesis (H0) is rejected at 5% significance level (α=0.05).
Conclusion:
There is an association between types of phones used and gender of driver at 5% level
of significance. The output is found to be significant. The two factors types of phones used
and gender of driver are dependent to each other.
chevron_up_icon
1 out of 5
circle_padding
hide_on_mobile
zoom_out_icon
[object Object]