Data Analysis Homework: Statistical Analysis of Economic Data

Verified

Added on  2022/12/15

|9
|1309
|421
Homework Assignment
AI Summary
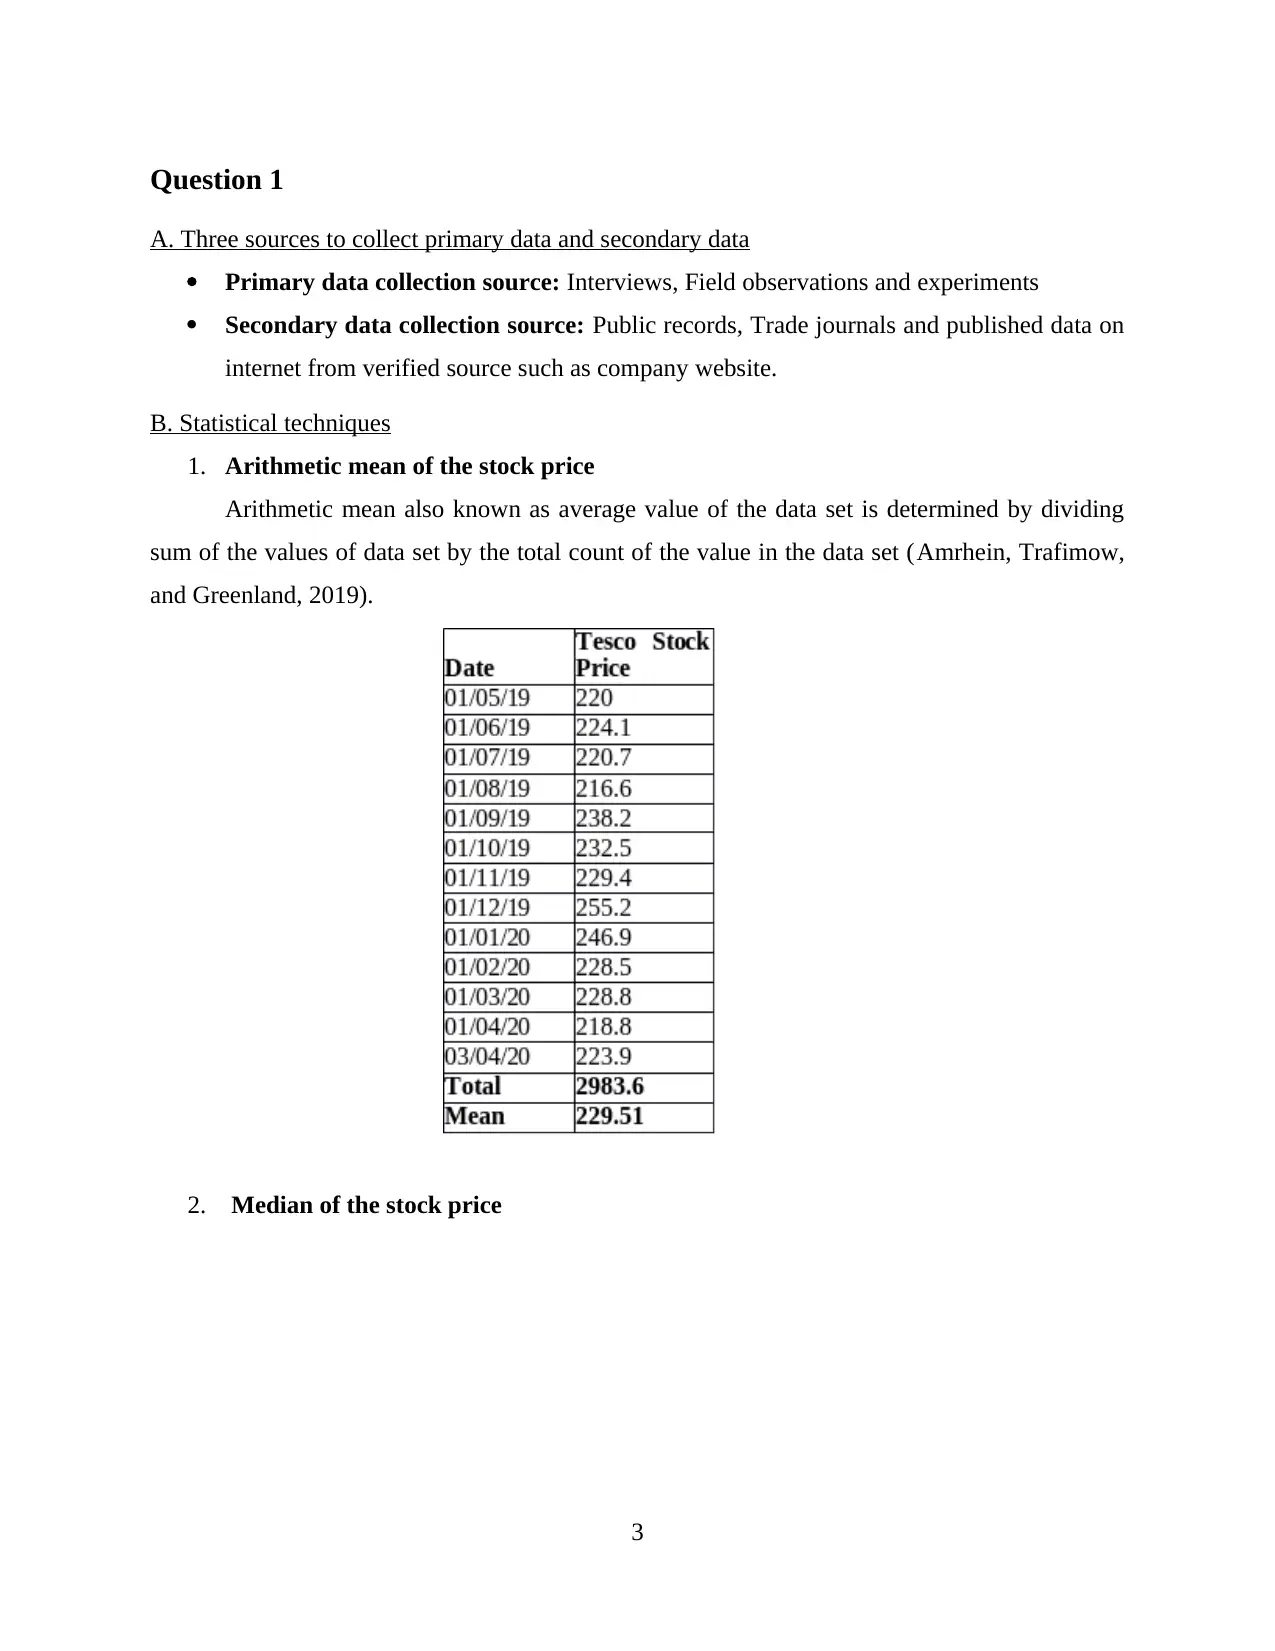
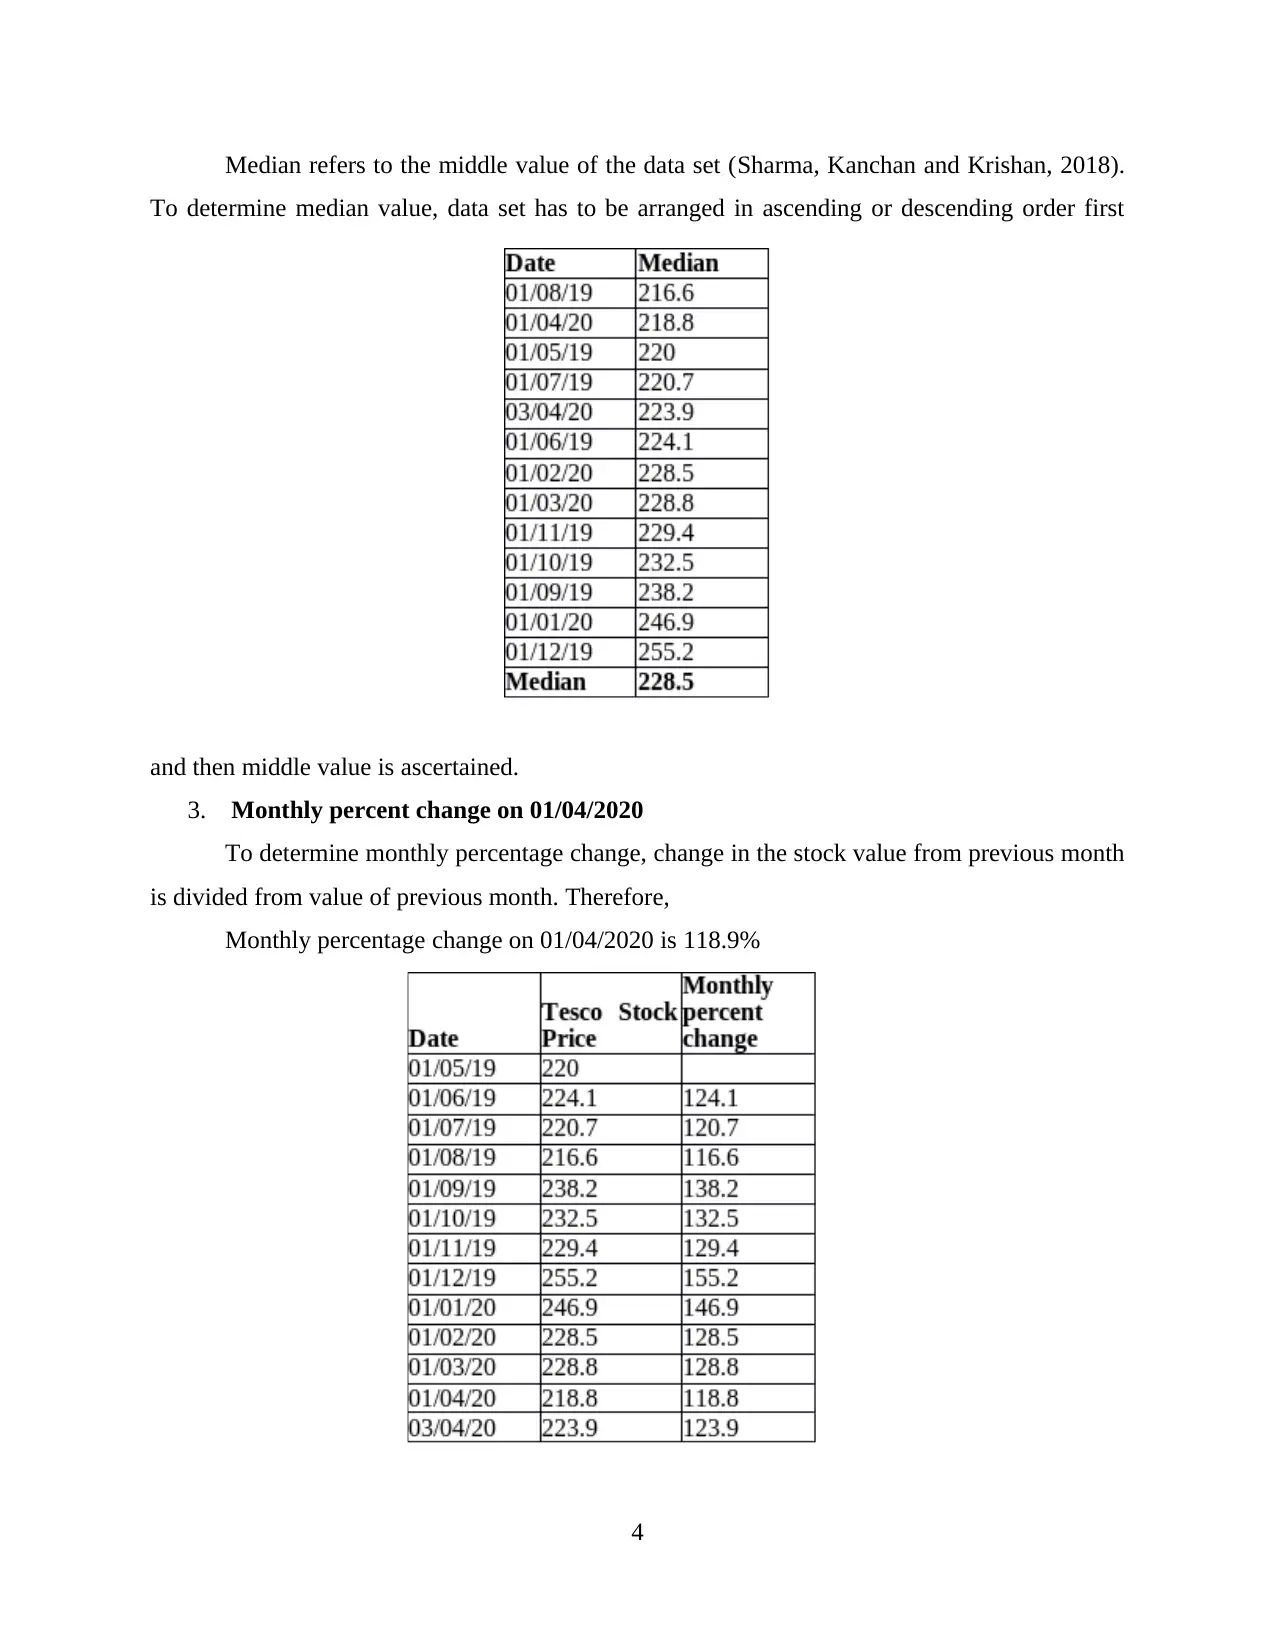
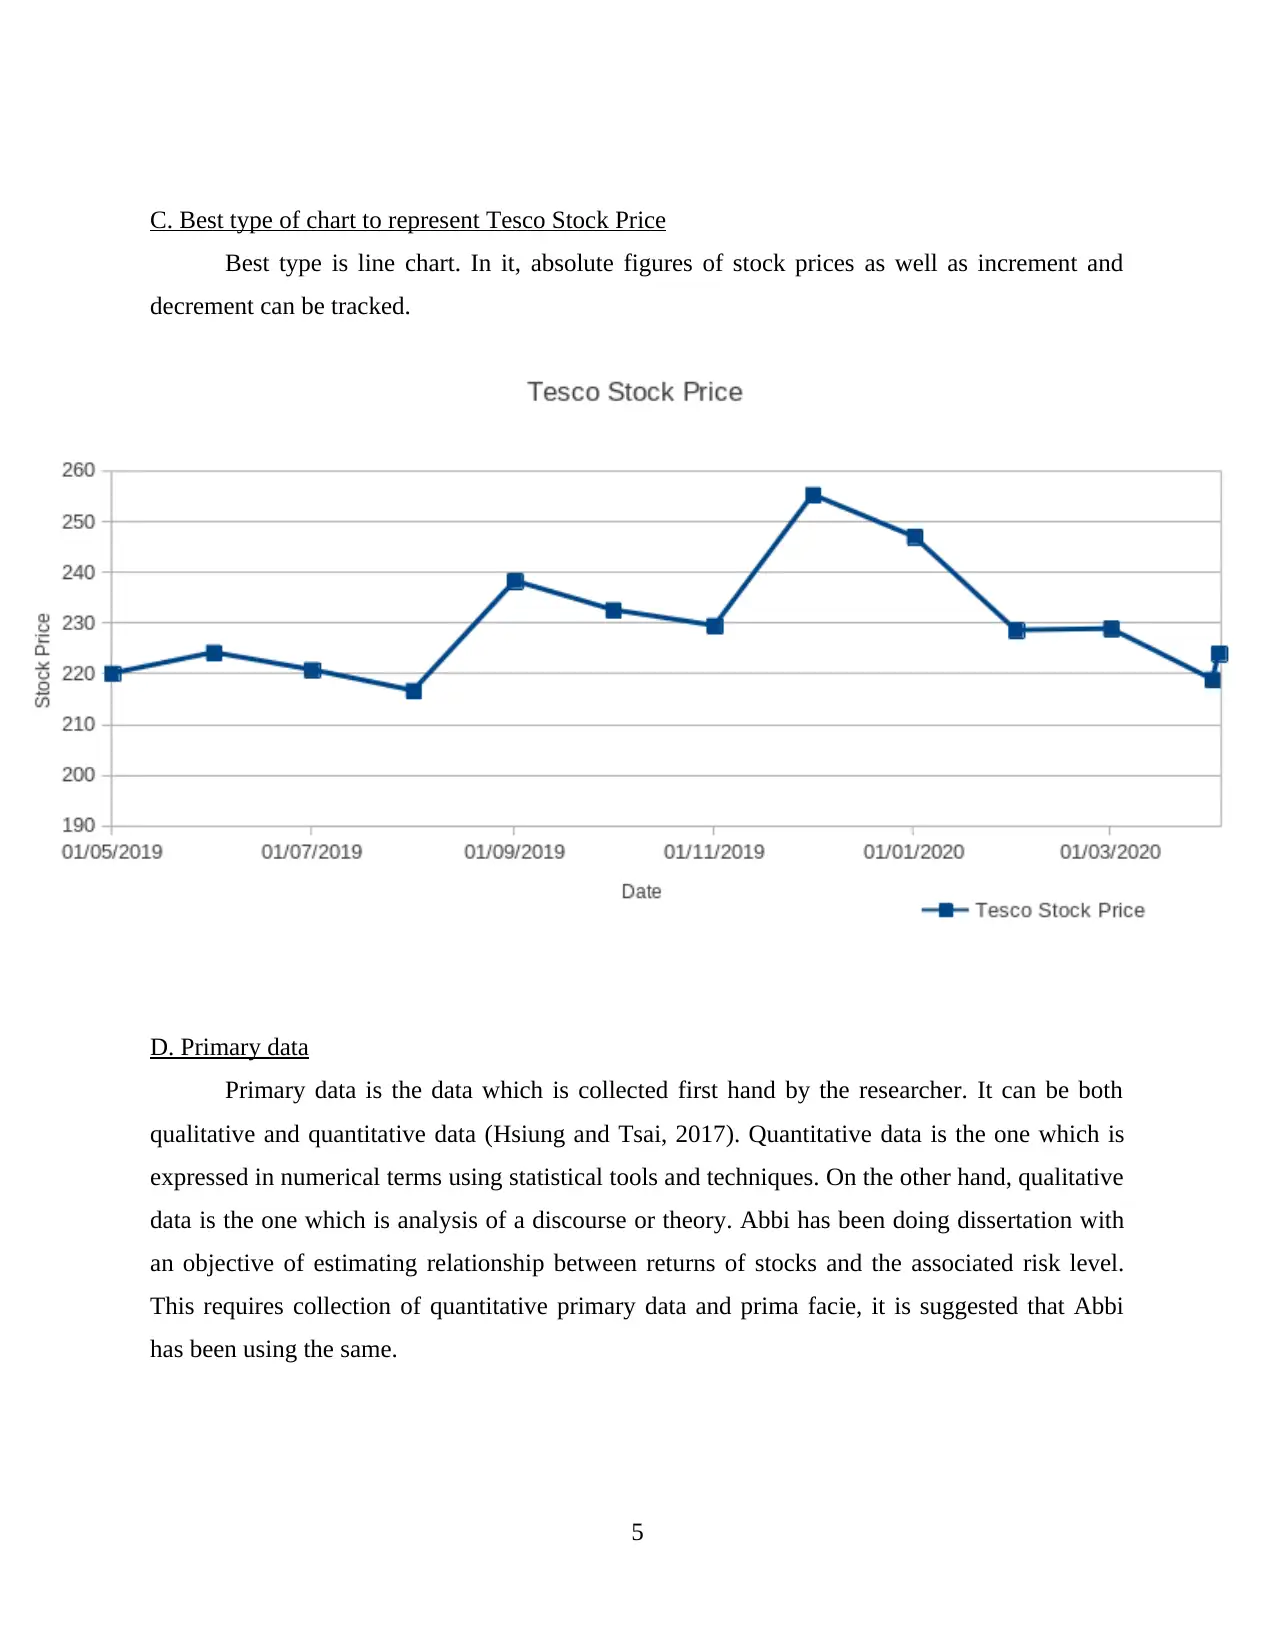
This homework assignment delves into the realm of data analysis, encompassing a range of statistical techniques. It begins by exploring primary and secondary data collection methods, including interviews, field observations, public records, and trade journals. The assignment then delves into specific statistical techniques such as calculating the arithmetic mean, median, and monthly percentage change of stock prices. Furthermore, it addresses data representation, recommending the use of line charts for visualizing stock price trends. The solution also tackles probability calculations, confidence intervals, and the analysis of negative correlations between variables, such as sales and expenses. The assignment provides a comprehensive overview of statistical analysis and its application in interpreting economic data, offering recommendations for businesses based on the analysis.
Document Page
Managing data
1
tabler-icon-diamond-filled.svg

Paraphrase This Document

Need a fresh take? Get an instant paraphrase of this document with our AI Paraphraser
Document Page
Table of Contents
Question 1........................................................................................................................................3
A. Three sources to collect primary data and secondary data.....................................................3
B. Statistical techniques..............................................................................................................3
C. Best type of chart to represent Tesco Stock Price..................................................................5
D. Primary data...........................................................................................................................5
Question 2........................................................................................................................................6
Question 3........................................................................................................................................6
Question 4........................................................................................................................................7
REFERENCES................................................................................................................................9
2
Document Page
Question 1
A. Three sources to collect primary data and secondary data
Primary data collection source: Interviews, Field observations and experiments
Secondary data collection source: Public records, Trade journals and published data on
internet from verified source such as company website.
B. Statistical techniques
1. Arithmetic mean of the stock price
Arithmetic mean also known as average value of the data set is determined by dividing
sum of the values of data set by the total count of the value in the data set (Amrhein, Trafimow,
and Greenland, 2019).
2. Median of the stock price
3
Document Page
Median refers to the middle value of the data set (Sharma, Kanchan and Krishan, 2018).
To determine median value, data set has to be arranged in ascending or descending order first
and then middle value is ascertained.
3. Monthly percent change on 01/04/2020
To determine monthly percentage change, change in the stock value from previous month
is divided from value of previous month. Therefore,
Monthly percentage change on 01/04/2020 is 118.9%
4
tabler-icon-diamond-filled.svg

Paraphrase This Document

Need a fresh take? Get an instant paraphrase of this document with our AI Paraphraser
Document Page
C. Best type of chart to represent Tesco Stock Price
Best type is line chart. In it, absolute figures of stock prices as well as increment and
decrement can be tracked.
D. Primary data
Primary data is the data which is collected first hand by the researcher. It can be both
qualitative and quantitative data (Hsiung and Tsai, 2017). Quantitative data is the one which is
expressed in numerical terms using statistical tools and techniques. On the other hand, qualitative
data is the one which is analysis of a discourse or theory. Abbi has been doing dissertation with
an objective of estimating relationship between returns of stocks and the associated risk level.
This requires collection of quantitative primary data and prima facie, it is suggested that Abbi
has been using the same.
5
Document Page
Question 2
a. Probability of Mike
P (spend over £10) = 19/185 = 0.1027 or 10.27%
b.
49 students are living over 1 mile away from the campus
c.
Modal group is those students who are living between 0.26 and 1 mile from the campus and pend
between 5 to 9.99 pounds.
d.
Savings made by Mike for a year = £200 * 12 = £2,400
Simple interest for 3 years = PRT
100 =2400 ×3 × 3
100
= £216
Mike will get £216 interest amount for his savings for 3 years.
e.
Compound interest = P (1+ R
100 )n
= 2,400 (1.03)3
= £2,622.54
Thus, Mike will receive total amount of £2,622.54 after the end of 3 years.
Question 3
a.
Value of Z = - 0.52
P( x70
10 )=0.52
X – 70 = - 5.2
X = - 5.2 + 70 = 64.8
b.
95% confidence interval
6
Document Page
Question 4
(a) In accordance of above mentioned graph this can be measured that there is negative or
inverse relationship (Wan, Britto and Zhou, 2020). This is so because as volume of expense
increases level of sales decreases as well as if volume of expenses decreases than sales revenue
increases. Basically an inverse relation is also known as negative correlation between two factors
like that the value of one variable is higher than the value of other factor will automatically
lower. Below three characteristics of this type of relation has been discussed that is as follows:
The relation between two elements can be change during the time period or can have time
period of positive relation also.
This can be measured between variable in a set of information to derive at functional
outcome (Rivers and Sanford, 2018).
This relation exists between two distinct form of variables.
(b) Work out the values of parameters of the relationship shown in the Figure:
In the context of above relation, sales and expenses two factors have been considered in
which there is negative relation. Below measurement of relation between these two factors have
been computed in such manner:
Year
Advert.
Expenditure(
X)
Sales
(Y) Sum of
XY
X
Square
Y
square
2008 8 30 240 64 900
2009 12 40 480 144 1600
2010 11 29 319 121 841
2011 5 29 145 25 841
2012 14 43 602 196 1849
2013 3 17 51 9 289
2014 6 20 120 36 400
7
tabler-icon-diamond-filled.svg

Paraphrase This Document

Need a fresh take? Get an instant paraphrase of this document with our AI Paraphraser
Document Page
2015 8 30 240 64 900
2016 4 22 88 16 484
2017 9 40 360 81 1600
Total 80 300 2645 756 9704
r= 10*(2645)-80*300/ Under root [(10*756)-640] * [10*9704-90000]
= 26450-24000/ (7560-640*97040-90000)
= 2450/ Under root -6920*7040
= -0.35
This calculation shows that there is negative relation between above mentioned two factors
which are sales and expenses.
(c) Explain the relationship and make recommendation to Little Liu Ltd based on the information
given.
In accordance of above done calculation this can be measured that there is negative or inverse
relationship whose value is of -0.35. this indicates that it is the volume of relation which exists
between these two factors. Below some recommendation to above company has been formed
which are as follows:
They should focus on minimizing their expenses as much as possible. This is so because if they
will do so than there will be chances to remove such negative relation. As well as by reducing
number of expenses there will be more scope to them to earn higher volume of sales during a
particular time period.
Apart from this the above company needs to emphasis on those elements which are leading to
lower sales.
As well as they need to focus on those aspects which can lead to increase in sales with an
immense growth in sales revenues.
8
Document Page
REFERENCES
Wan, X., Britto, R. and Zhou, Z., 2020. In search of the negative relationship between product
variety and inventory turnover. International Journal of Production Economics, 222,
p.107503.
Rivers, A.S. and Sanford, K., 2018. Negative relationship behavior is more important than
positive: Correlates of outcomes during stressful life events. Journal of Family
Psychology, 32(3), p.375.
Hsiung, H.H. and Tsai, W.C., 2017. The joint moderating effects of activated negative moods
and group voice climate on the relationship between power distance orientation and
employee voice behavior. Applied Psychology, 66(3), pp.487-514.
Sharma, S.K., Kanchan, T. and Krishan, K., 2018. Descriptive statistics. The Encyclopedia of
Archaeological Sciences, pp.1-8.
Amrhein, V., Trafimow, D. and Greenland, S., 2019. Inferential statistics as descriptive statistics:
There is no replication crisis if we don’t expect replication. The American
Statistician, 73(sup1), pp.262-270.
9
chevron_up_icon
1 out of 9
circle_padding
hide_on_mobile
zoom_out_icon
[object Object]