Data Analysis Assignment - Solutions for Data and Statistical Analysis

Verified

Added on  2022/12/15

|6
|368
|57
Homework Assignment
AI Summary
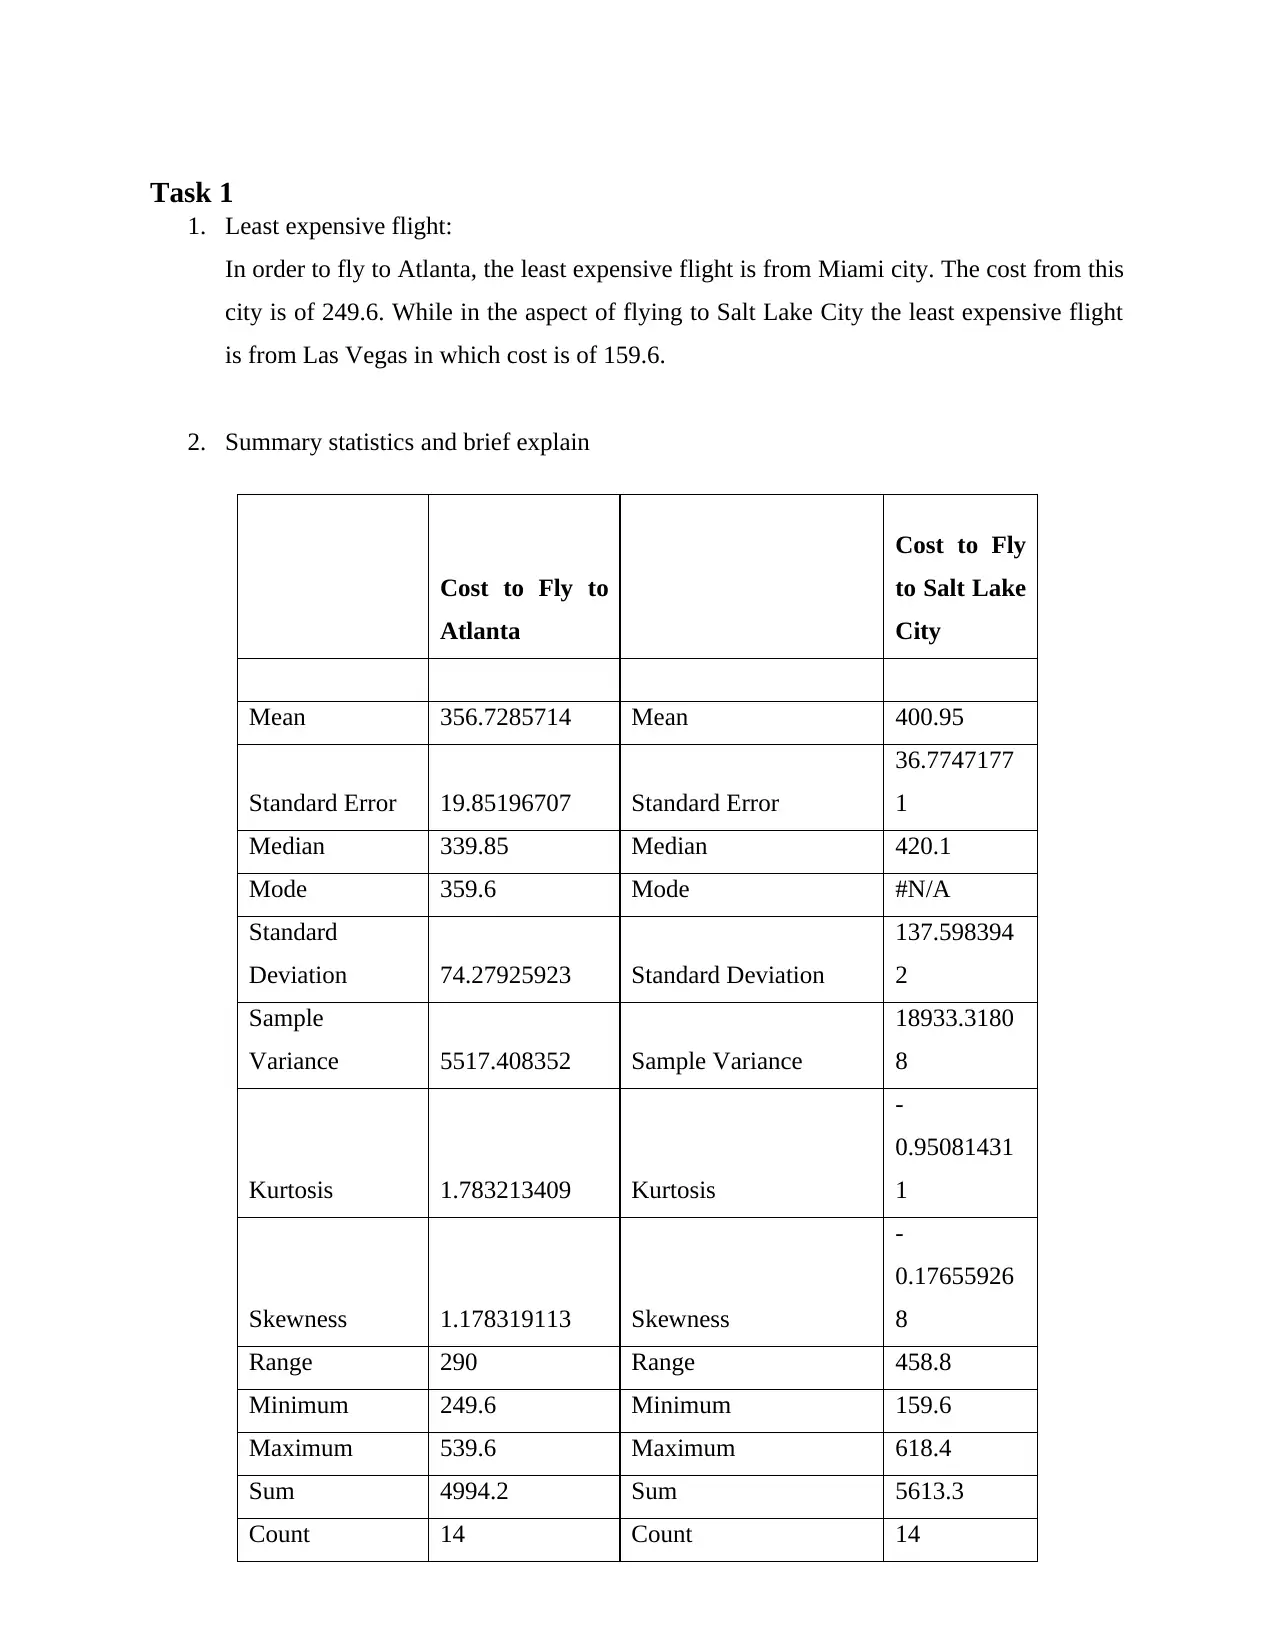
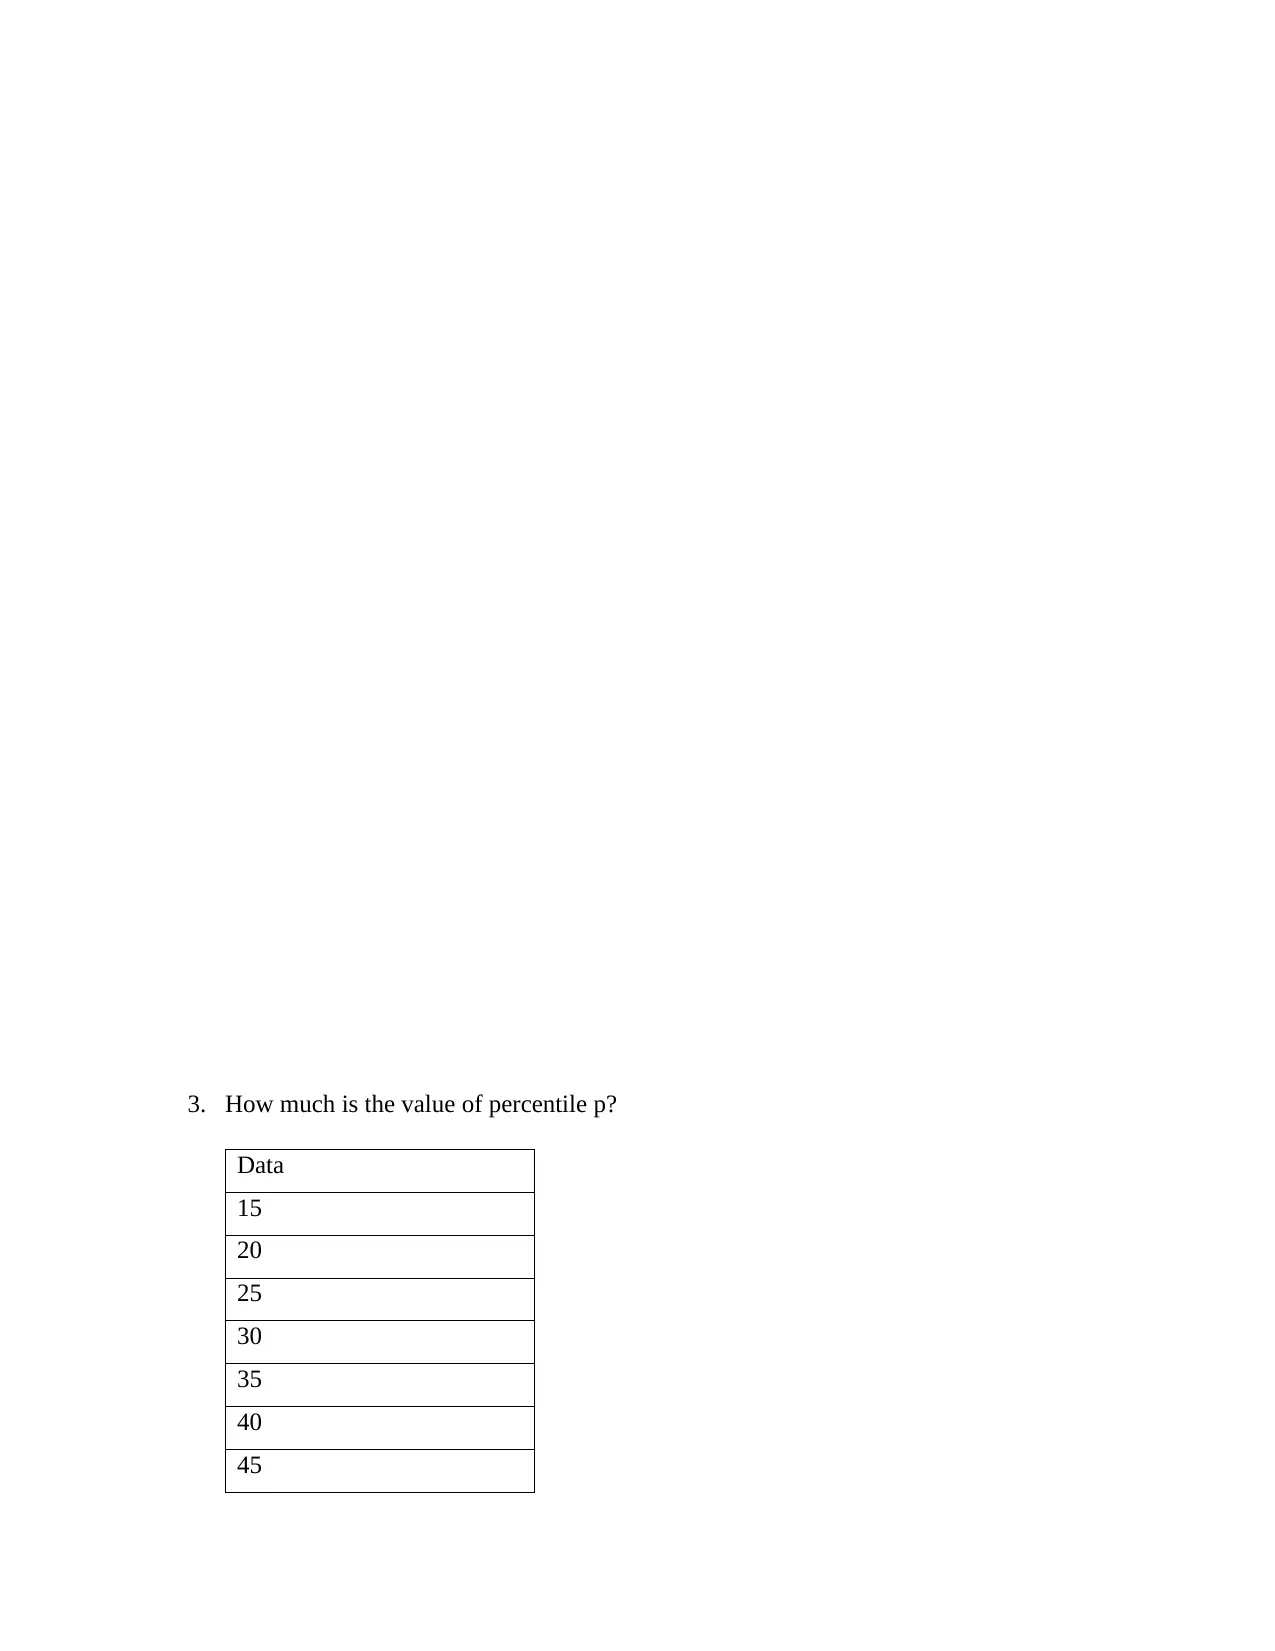
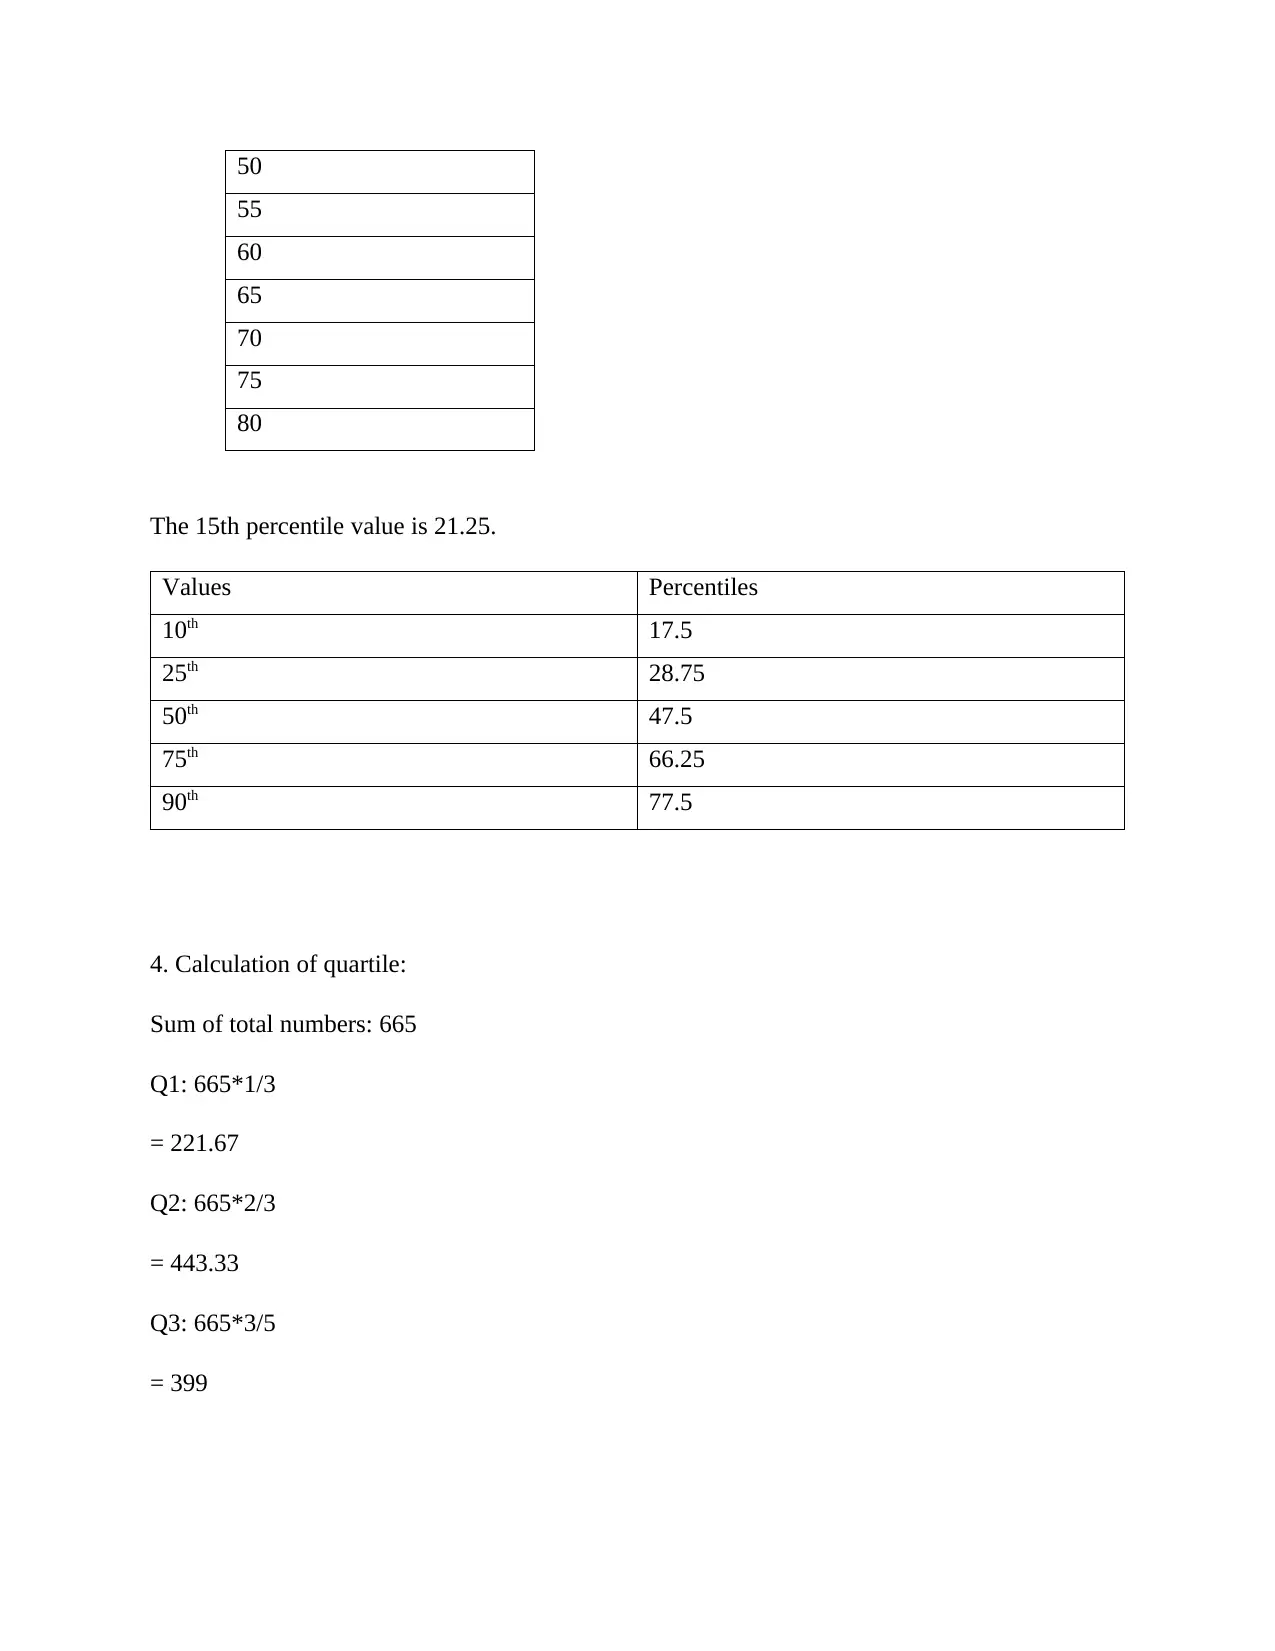
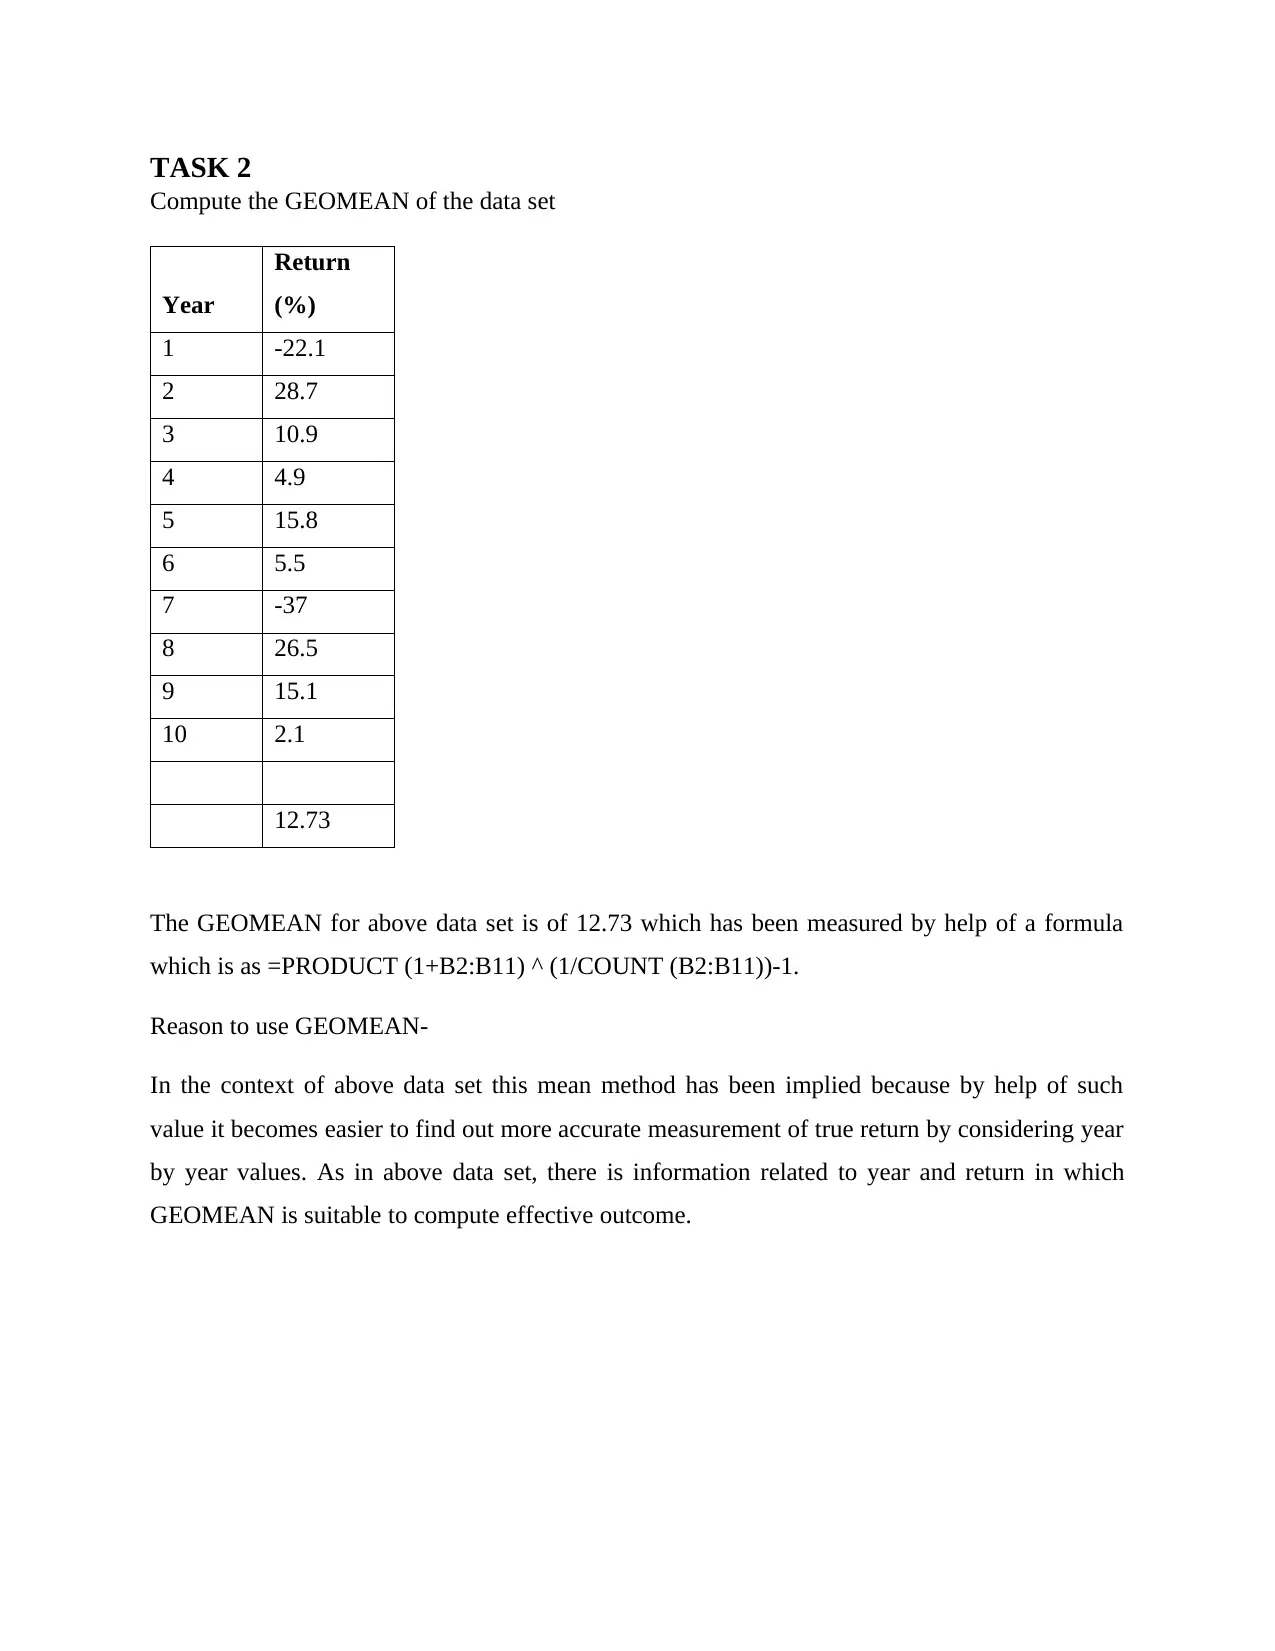
This document presents the solutions to a data analysis assignment. Task 1 focuses on analyzing flight costs, identifying the least expensive flights, and summarizing the data using statistical measures such as mean, median, mode, standard deviation, and percentiles. The calculations include finding the 15th percentile and quartiles. Task 2 involves computing the GEOMEAN for a given dataset of yearly returns and explaining the rationale for using this specific mean method to provide a more accurate measurement of true return by considering year by year values, which is suitable for this type of data. The assignment provides detailed calculations and explanations for each task, offering a comprehensive understanding of data analysis techniques.
Document Page
Managing data
tabler-icon-diamond-filled.svg

Paraphrase This Document

Need a fresh take? Get an instant paraphrase of this document with our AI Paraphraser
Document Page
Contents
Task 1.........................................................................................................................................................3
TASK 2.......................................................................................................................................................5
Document Page
Task 1
1. Least expensive flight:
In order to fly to Atlanta, the least expensive flight is from Miami city. The cost from this
city is of 249.6. While in the aspect of flying to Salt Lake City the least expensive flight
is from Las Vegas in which cost is of 159.6.
2. Summary statistics and brief explain
Cost to Fly to
Atlanta
Cost to Fly
to Salt Lake
City
Mean 356.7285714 Mean 400.95
Standard Error 19.85196707 Standard Error
36.7747177
1
Median 339.85 Median 420.1
Mode 359.6 Mode #N/A
Standard
Deviation 74.27925923 Standard Deviation
137.598394
2
Sample
Variance 5517.408352 Sample Variance
18933.3180
8
Kurtosis 1.783213409 Kurtosis
-
0.95081431
1
Skewness 1.178319113 Skewness
-
0.17655926
8
Range 290 Range 458.8
Minimum 249.6 Minimum 159.6
Maximum 539.6 Maximum 618.4
Sum 4994.2 Sum 5613.3
Count 14 Count 14
Document Page
3. How much is the value of percentile p?
Data
15
20
25
30
35
40
45
tabler-icon-diamond-filled.svg

Paraphrase This Document

Need a fresh take? Get an instant paraphrase of this document with our AI Paraphraser
Document Page
50
55
60
65
70
75
80
The 15th percentile value is 21.25.
Values Percentiles
10th 17.5
25th 28.75
50th 47.5
75th 66.25
90th 77.5
4. Calculation of quartile:
Sum of total numbers: 665
Q1: 665*1/3
= 221.67
Q2: 665*2/3
= 443.33
Q3: 665*3/5
= 399
Document Page
TASK 2
Compute the GEOMEAN of the data set
Year
Return
(%)
1 -22.1
2 28.7
3 10.9
4 4.9
5 15.8
6 5.5
7 -37
8 26.5
9 15.1
10 2.1
12.73
The GEOMEAN for above data set is of 12.73 which has been measured by help of a formula
which is as =PRODUCT (1+B2:B11) ^ (1/COUNT (B2:B11))-1.
Reason to use GEOMEAN-
In the context of above data set this mean method has been implied because by help of such
value it becomes easier to find out more accurate measurement of true return by considering year
by year values. As in above data set, there is information related to year and return in which
GEOMEAN is suitable to compute effective outcome.
chevron_up_icon
1 out of 6
circle_padding
hide_on_mobile
zoom_out_icon
[object Object]