Data Visualization Project: Analyzing Hospital Data and Hypotheses

Verified

Added on  2021/04/19

|7
|785
|100
Project
AI Summary
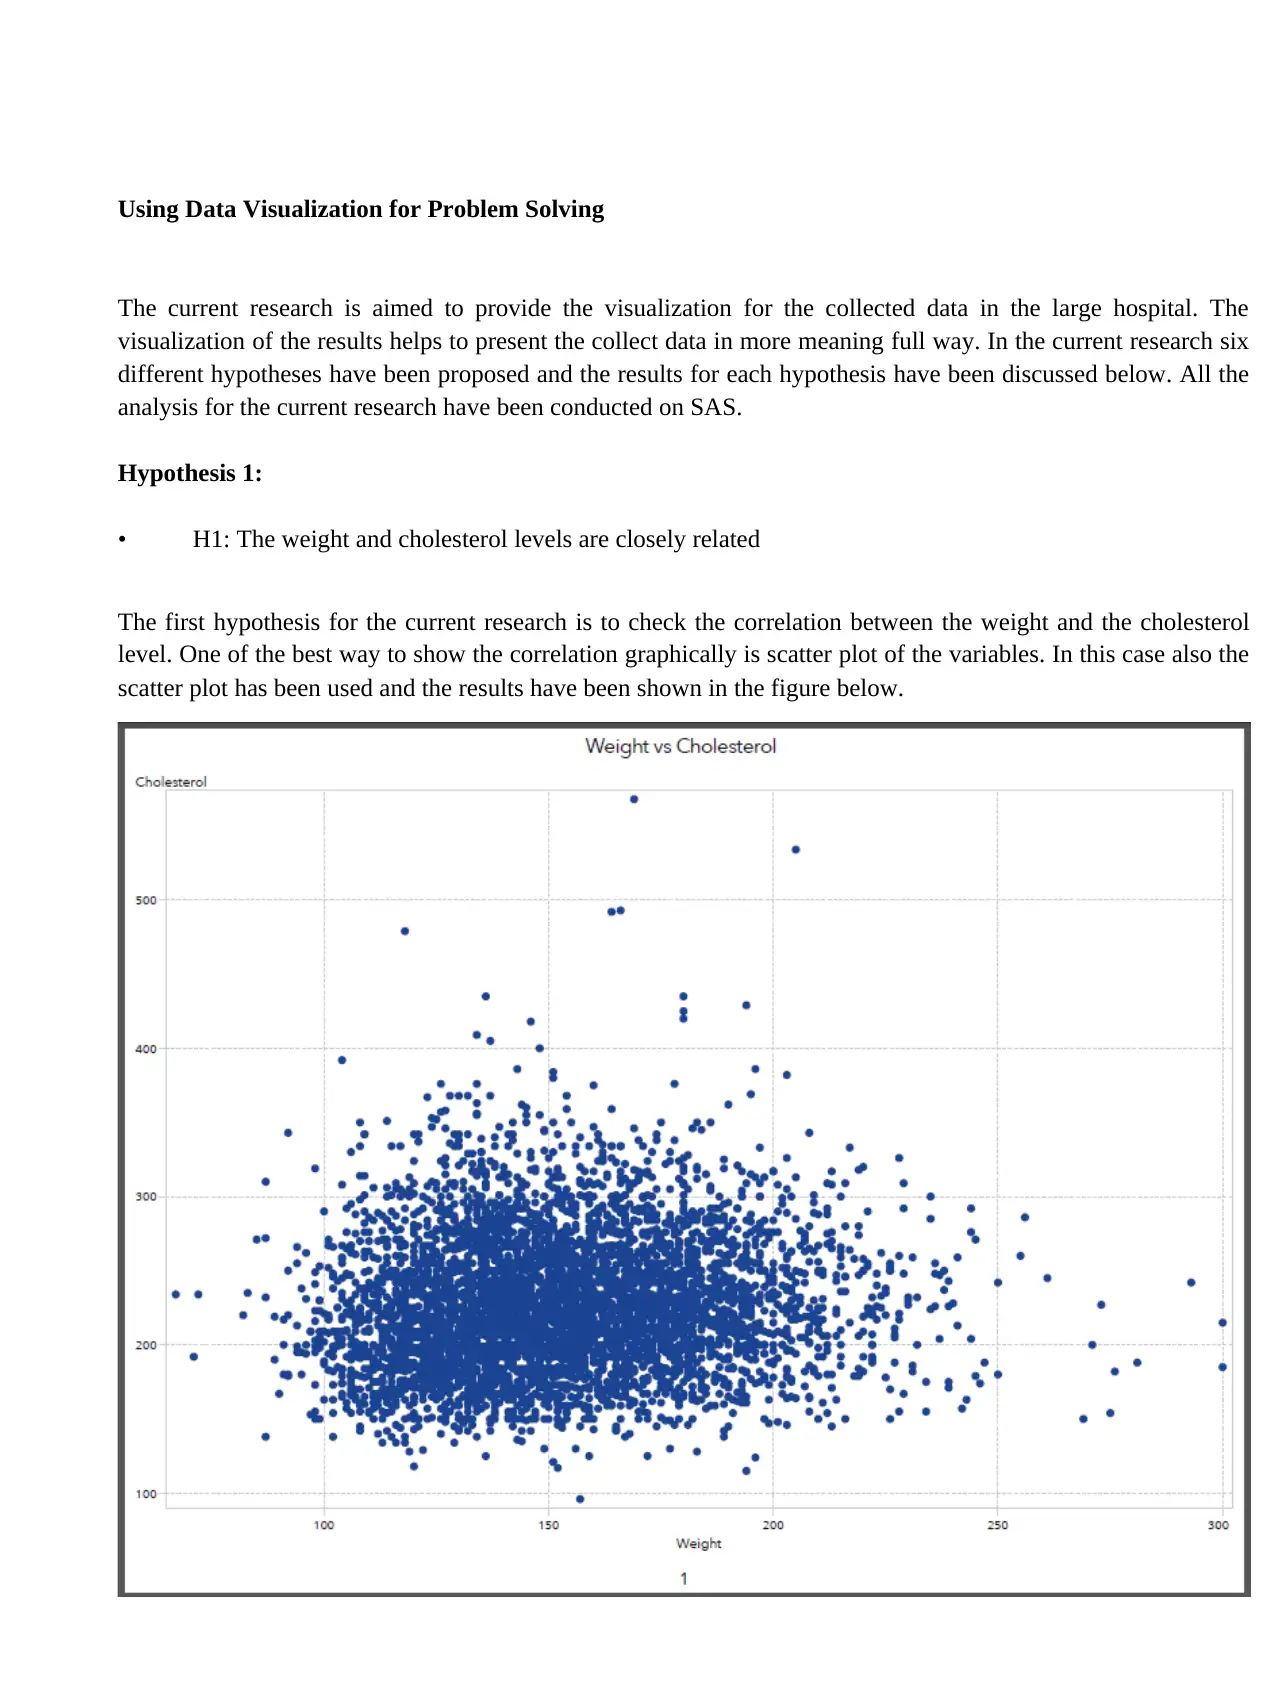
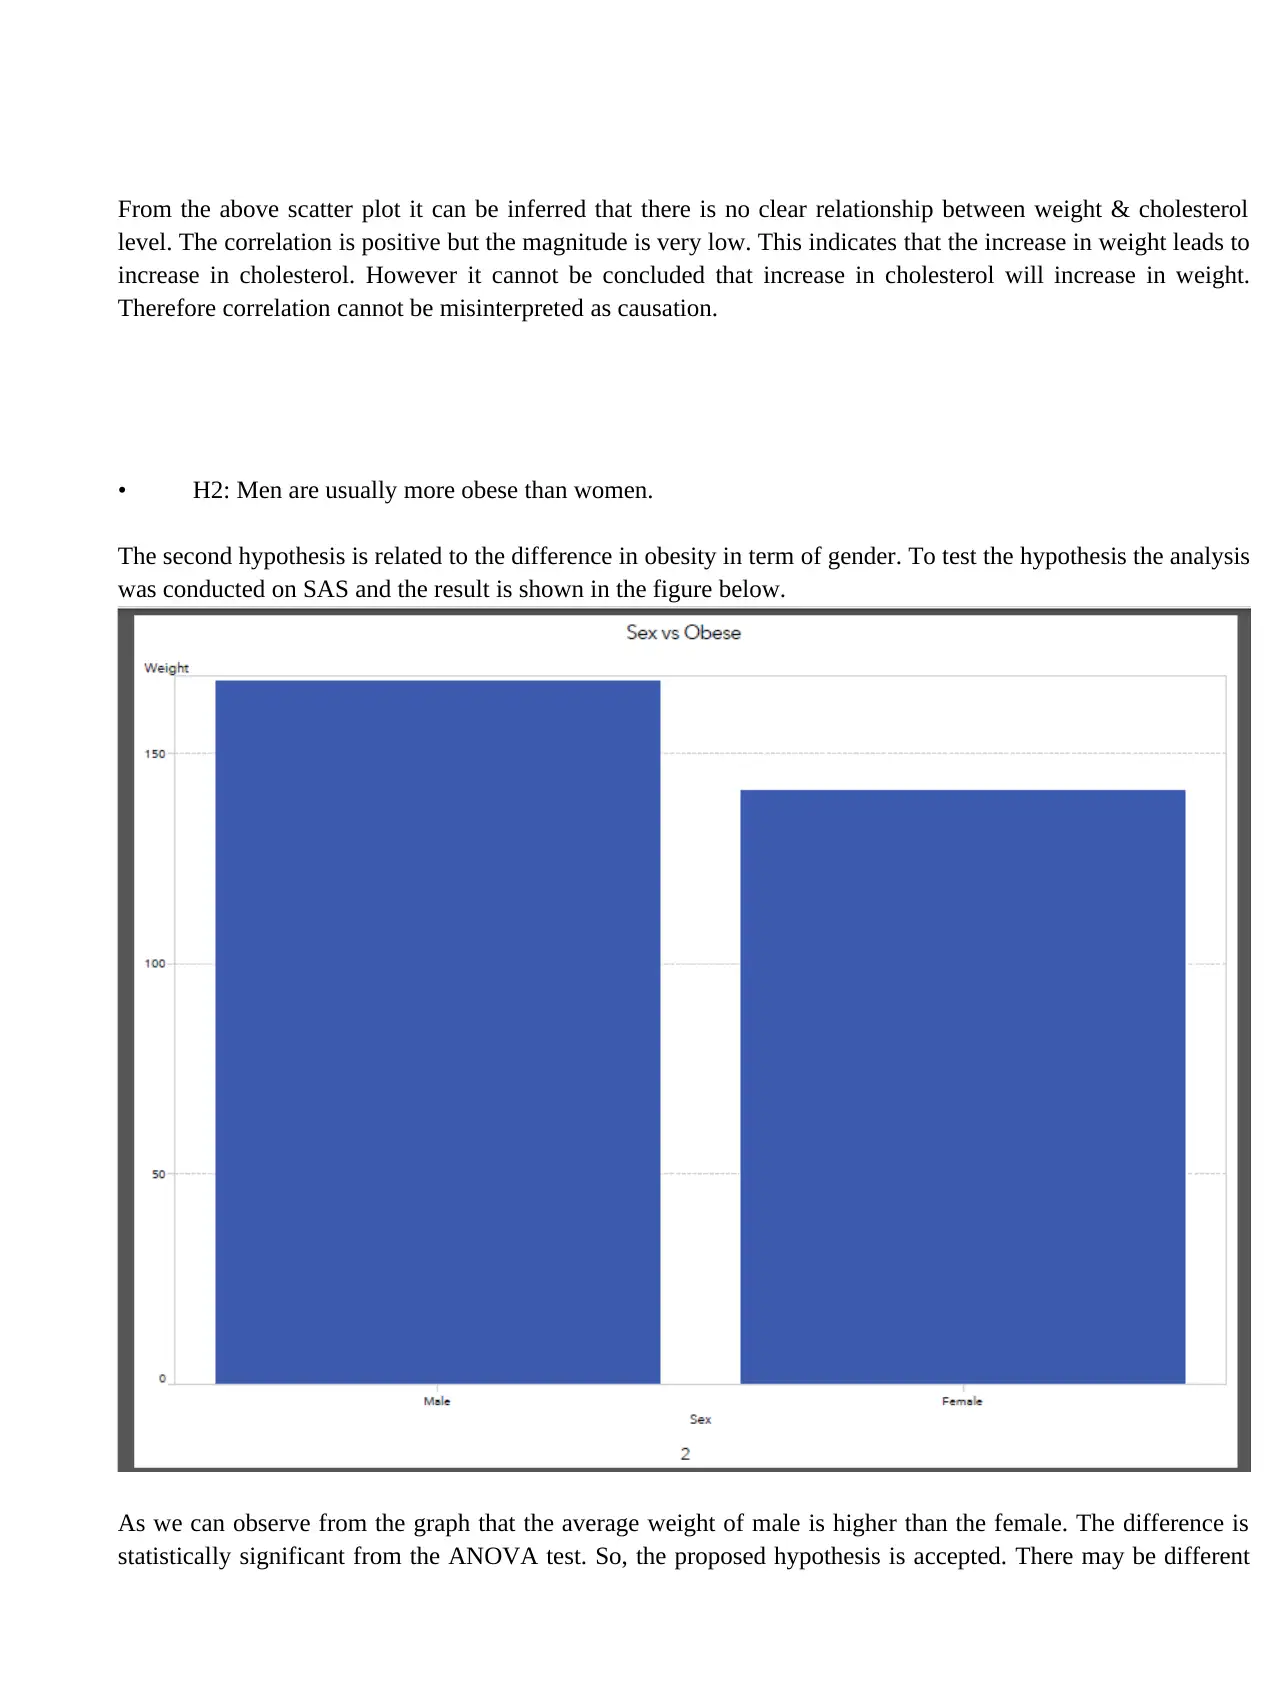
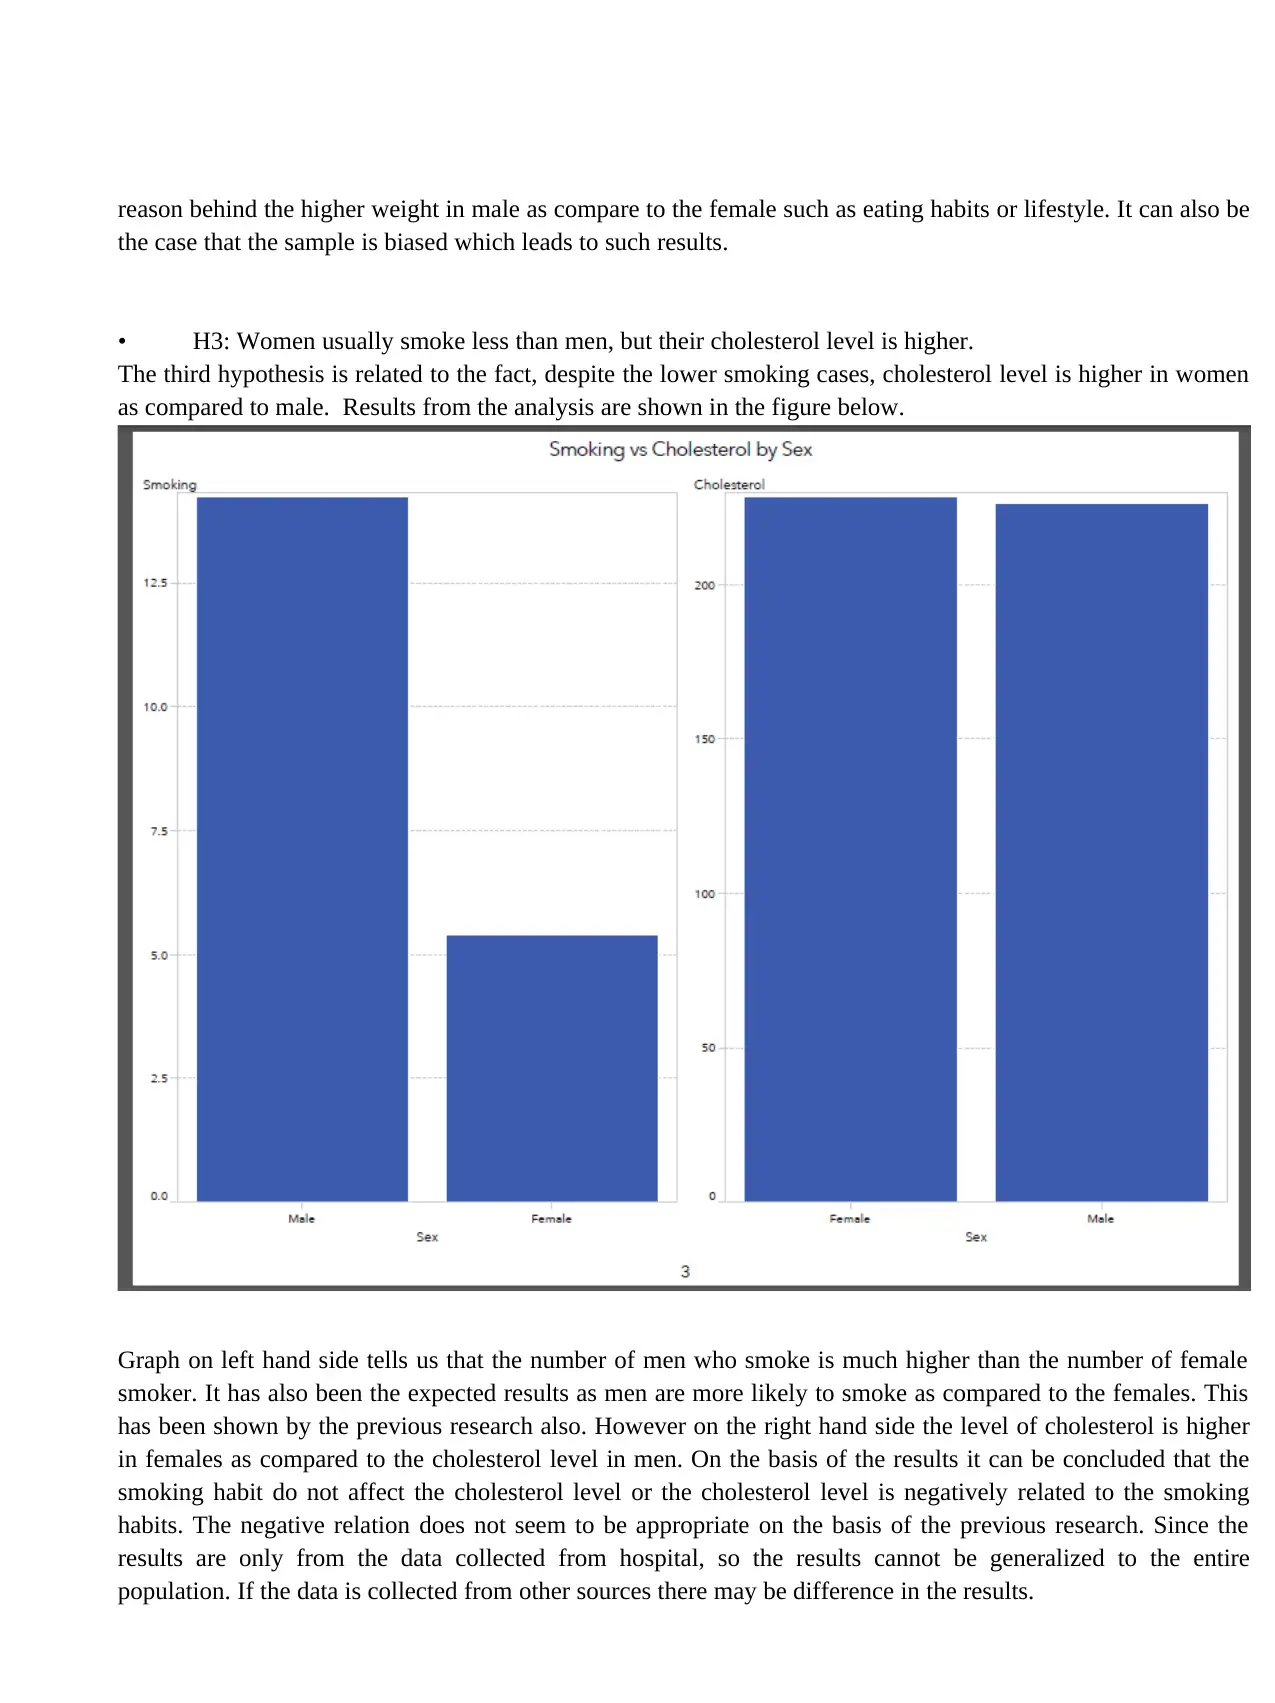
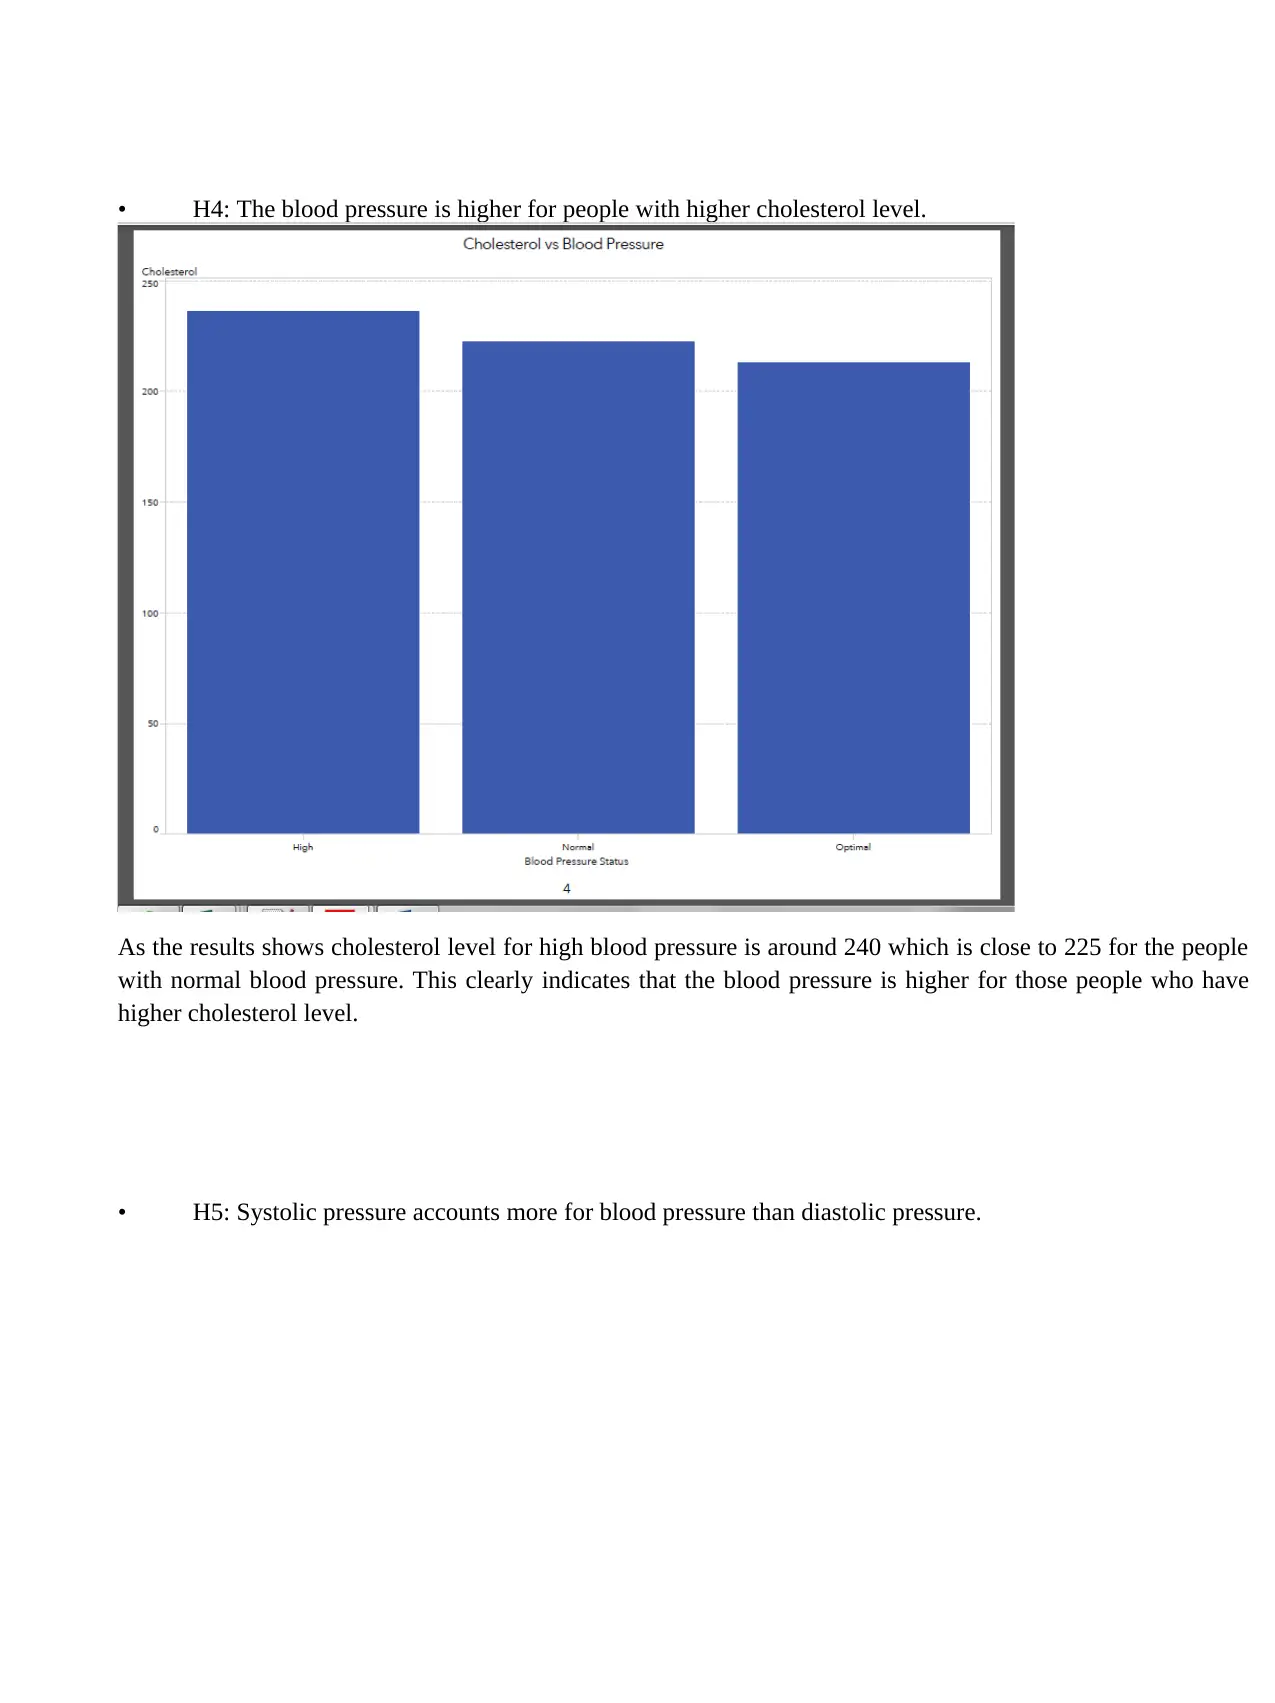
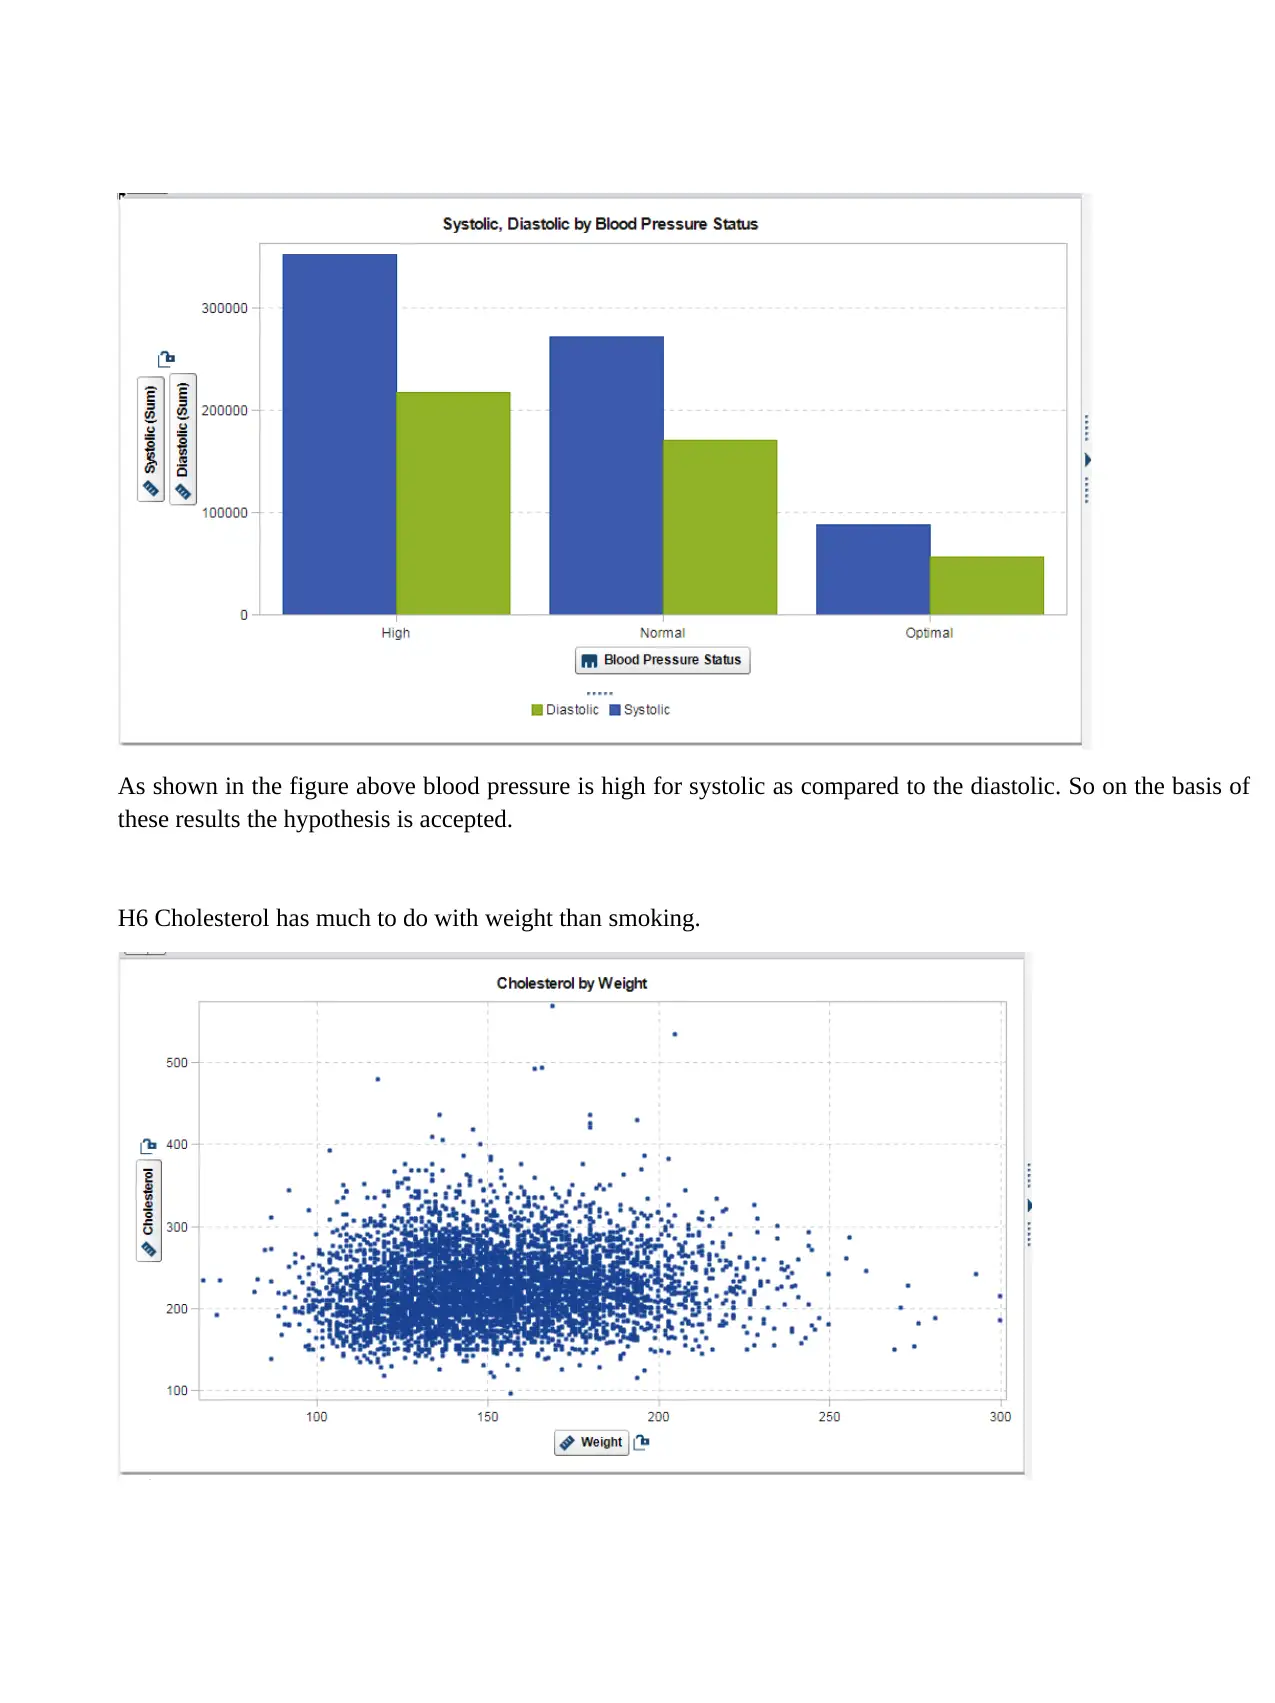
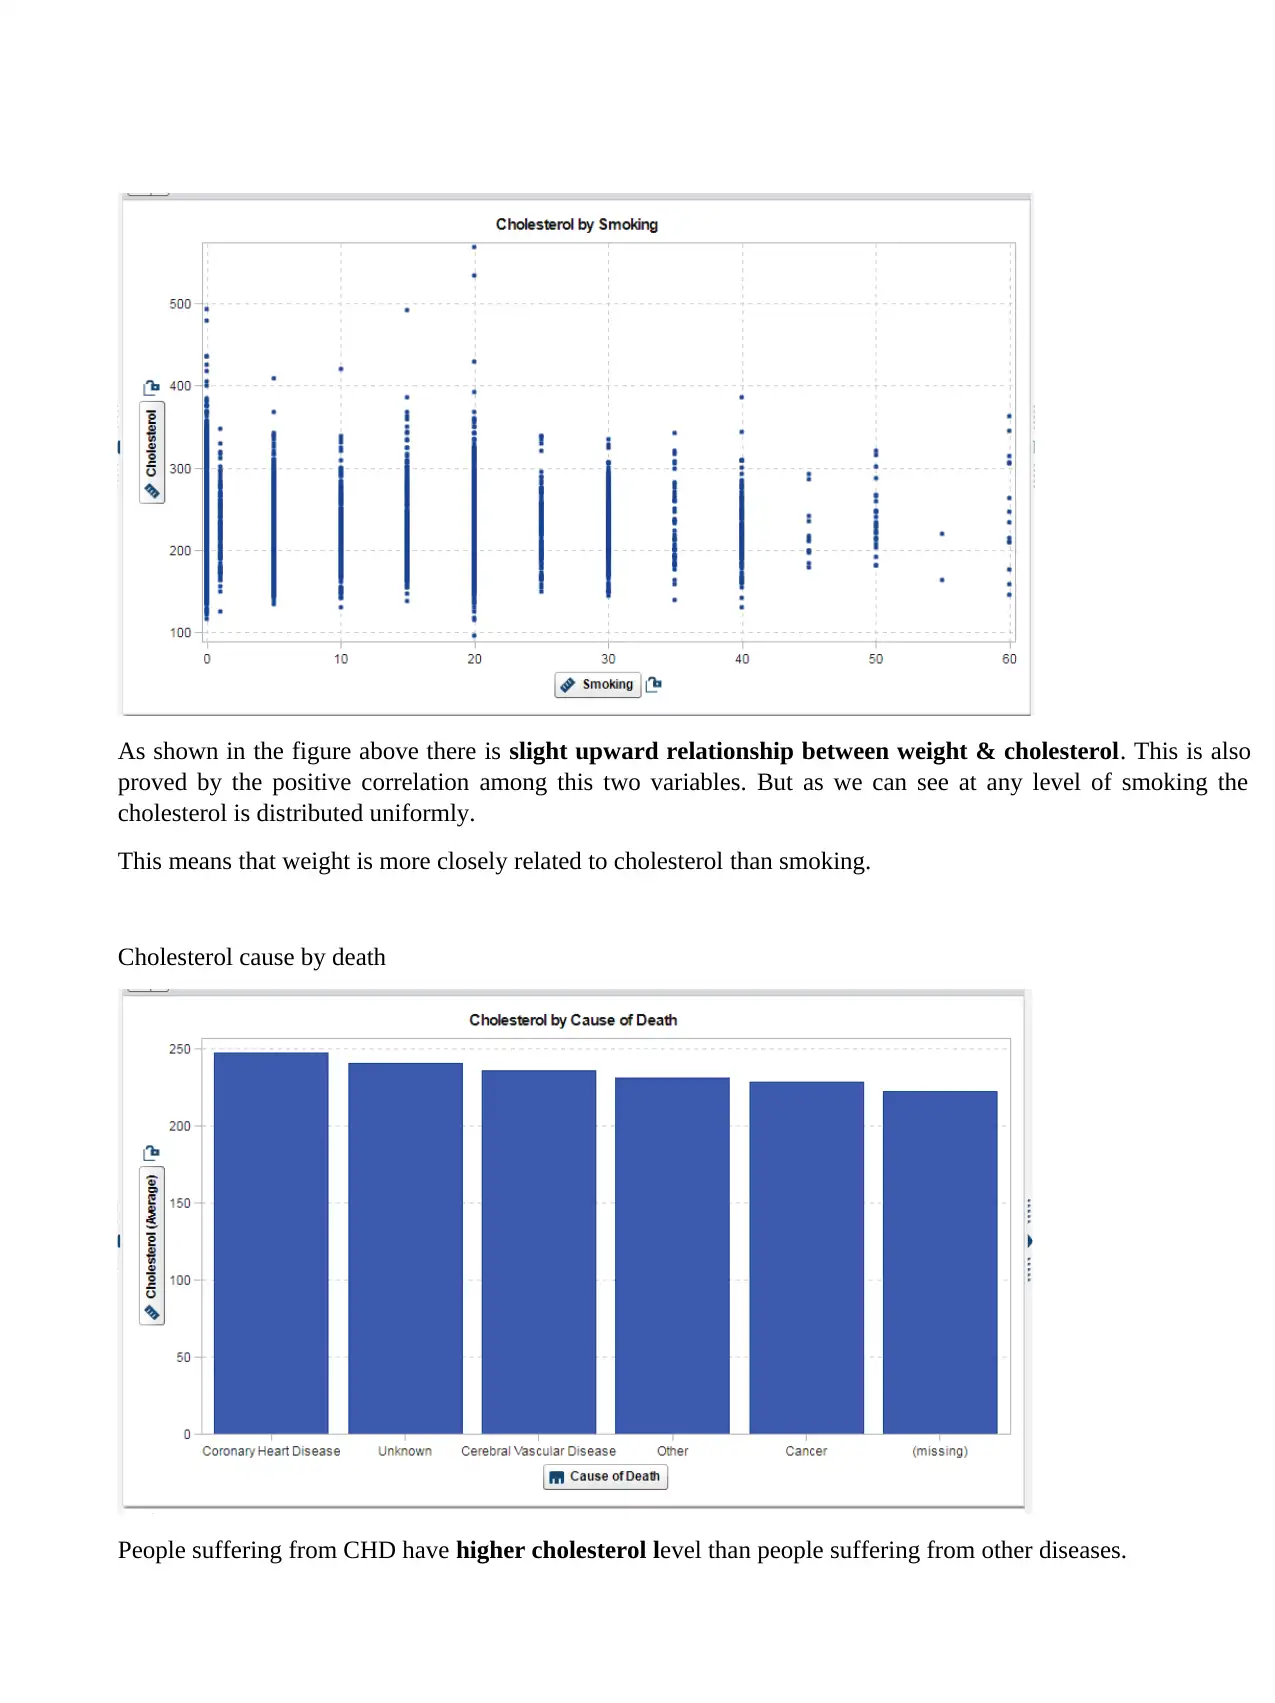
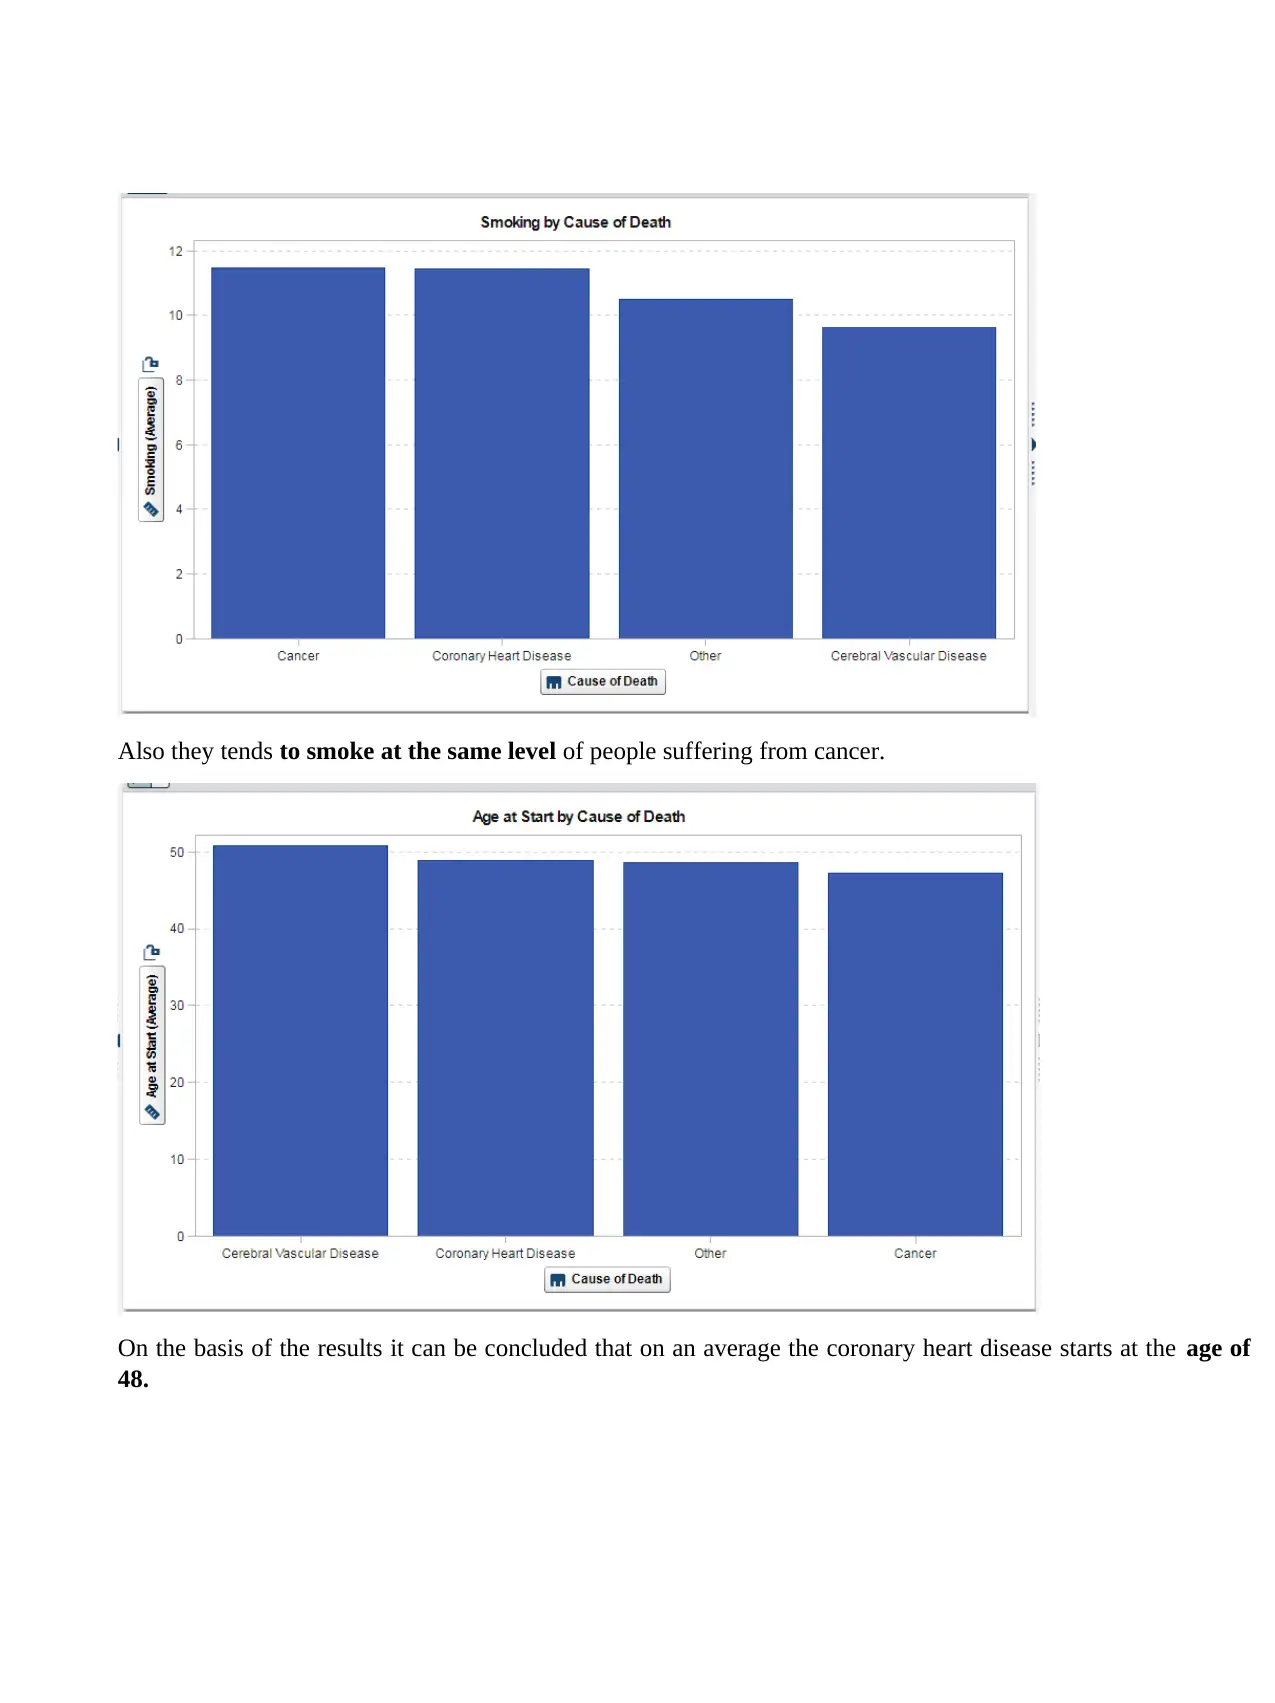
This project focuses on the data visualization of a large hospital's collected data to present it in a more meaningful way. The analysis uses SAS to test six different hypotheses related to weight, cholesterol levels, gender, smoking habits, blood pressure, and their correlations. The project utilizes scatter plots and graphical representations to illustrate the relationships between variables. Key findings include the lack of a clear relationship between weight and cholesterol, the higher average weight of males compared to females, the observation that smoking habits do not appear to affect cholesterol levels, the positive correlation between cholesterol and blood pressure, and the conclusion that weight has a closer relationship with cholesterol than smoking. The analysis also provides insights into the average age at which coronary heart disease starts. The results provide valuable insights into the relationships between various health factors within the hospital's patient data.
Document Page
Using Data Visualization for Problem Solving
The current research is aimed to provide the visualization for the collected data in the large hospital. The
visualization of the results helps to present the collect data in more meaning full way. In the current research six
different hypotheses have been proposed and the results for each hypothesis have been discussed below. All the
analysis for the current research have been conducted on SAS.
Hypothesis 1:
H1: The weight and cholesterol levels are closely related
The first hypothesis for the current research is to check the correlation between the weight and the cholesterol
level. One of the best way to show the correlation graphically is scatter plot of the variables. In this case also the
scatter plot has been used and the results have been shown in the figure below.
tabler-icon-diamond-filled.svg

Secure Best Marks with AI Grader

Need help grading? Try our AI Grader for instant feedback on your assignments.
Document Page
From the above scatter plot it can be inferred that there is no clear relationship between weight & cholesterol
level. The correlation is positive but the magnitude is very low. This indicates that the increase in weight leads to
increase in cholesterol. However it cannot be concluded that increase in cholesterol will increase in weight.
Therefore correlation cannot be misinterpreted as causation.
H2: Men are usually more obese than women.
The second hypothesis is related to the difference in obesity in term of gender. To test the hypothesis the analysis
was conducted on SAS and the result is shown in the figure below.
As we can observe from the graph that the average weight of male is higher than the female. The difference is
statistically significant from the ANOVA test. So, the proposed hypothesis is accepted. There may be different
Document Page
reason behind the higher weight in male as compare to the female such as eating habits or lifestyle. It can also be
the case that the sample is biased which leads to such results.
H3: Women usually smoke less than men, but their cholesterol level is higher.
The third hypothesis is related to the fact, despite the lower smoking cases, cholesterol level is higher in women
as compared to male. Results from the analysis are shown in the figure below.
Graph on left hand side tells us that the number of men who smoke is much higher than the number of female
smoker. It has also been the expected results as men are more likely to smoke as compared to the females. This
has been shown by the previous research also. However on the right hand side the level of cholesterol is higher
in females as compared to the cholesterol level in men. On the basis of the results it can be concluded that the
smoking habit do not affect the cholesterol level or the cholesterol level is negatively related to the smoking
habits. The negative relation does not seem to be appropriate on the basis of the previous research. Since the
results are only from the data collected from hospital, so the results cannot be generalized to the entire
population. If the data is collected from other sources there may be difference in the results.
Document Page
H4: The blood pressure is higher for people with higher cholesterol level.
As the results shows cholesterol level for high blood pressure is around 240 which is close to 225 for the people
with normal blood pressure. This clearly indicates that the blood pressure is higher for those people who have
higher cholesterol level.
H5: Systolic pressure accounts more for blood pressure than diastolic pressure.
tabler-icon-diamond-filled.svg

Secure Best Marks with AI Grader

Need help grading? Try our AI Grader for instant feedback on your assignments.
Document Page
As shown in the figure above blood pressure is high for systolic as compared to the diastolic. So on the basis of
these results the hypothesis is accepted.
H6 Cholesterol has much to do with weight than smoking.
Document Page
As shown in the figure above there is slight upward relationship between weight & cholesterol. This is also
proved by the positive correlation among this two variables. But as we can see at any level of smoking the
cholesterol is distributed uniformly.
This means that weight is more closely related to cholesterol than smoking.
Cholesterol cause by death
People suffering from CHD have higher cholesterol level than people suffering from other diseases.
Document Page
Also they tends to smoke at the same level of people suffering from cancer.
On the basis of the results it can be concluded that on an average the coronary heart disease starts at the age of
48.
chevron_up_icon
1 out of 7
circle_padding
hide_on_mobile
zoom_out_icon
[object Object]