Report on Numeracy and Data Analysis: Liverpool Humidity Forecasting
VerifiedAdded on 2023/06/14
|9
|1307
|454
Report
AI Summary
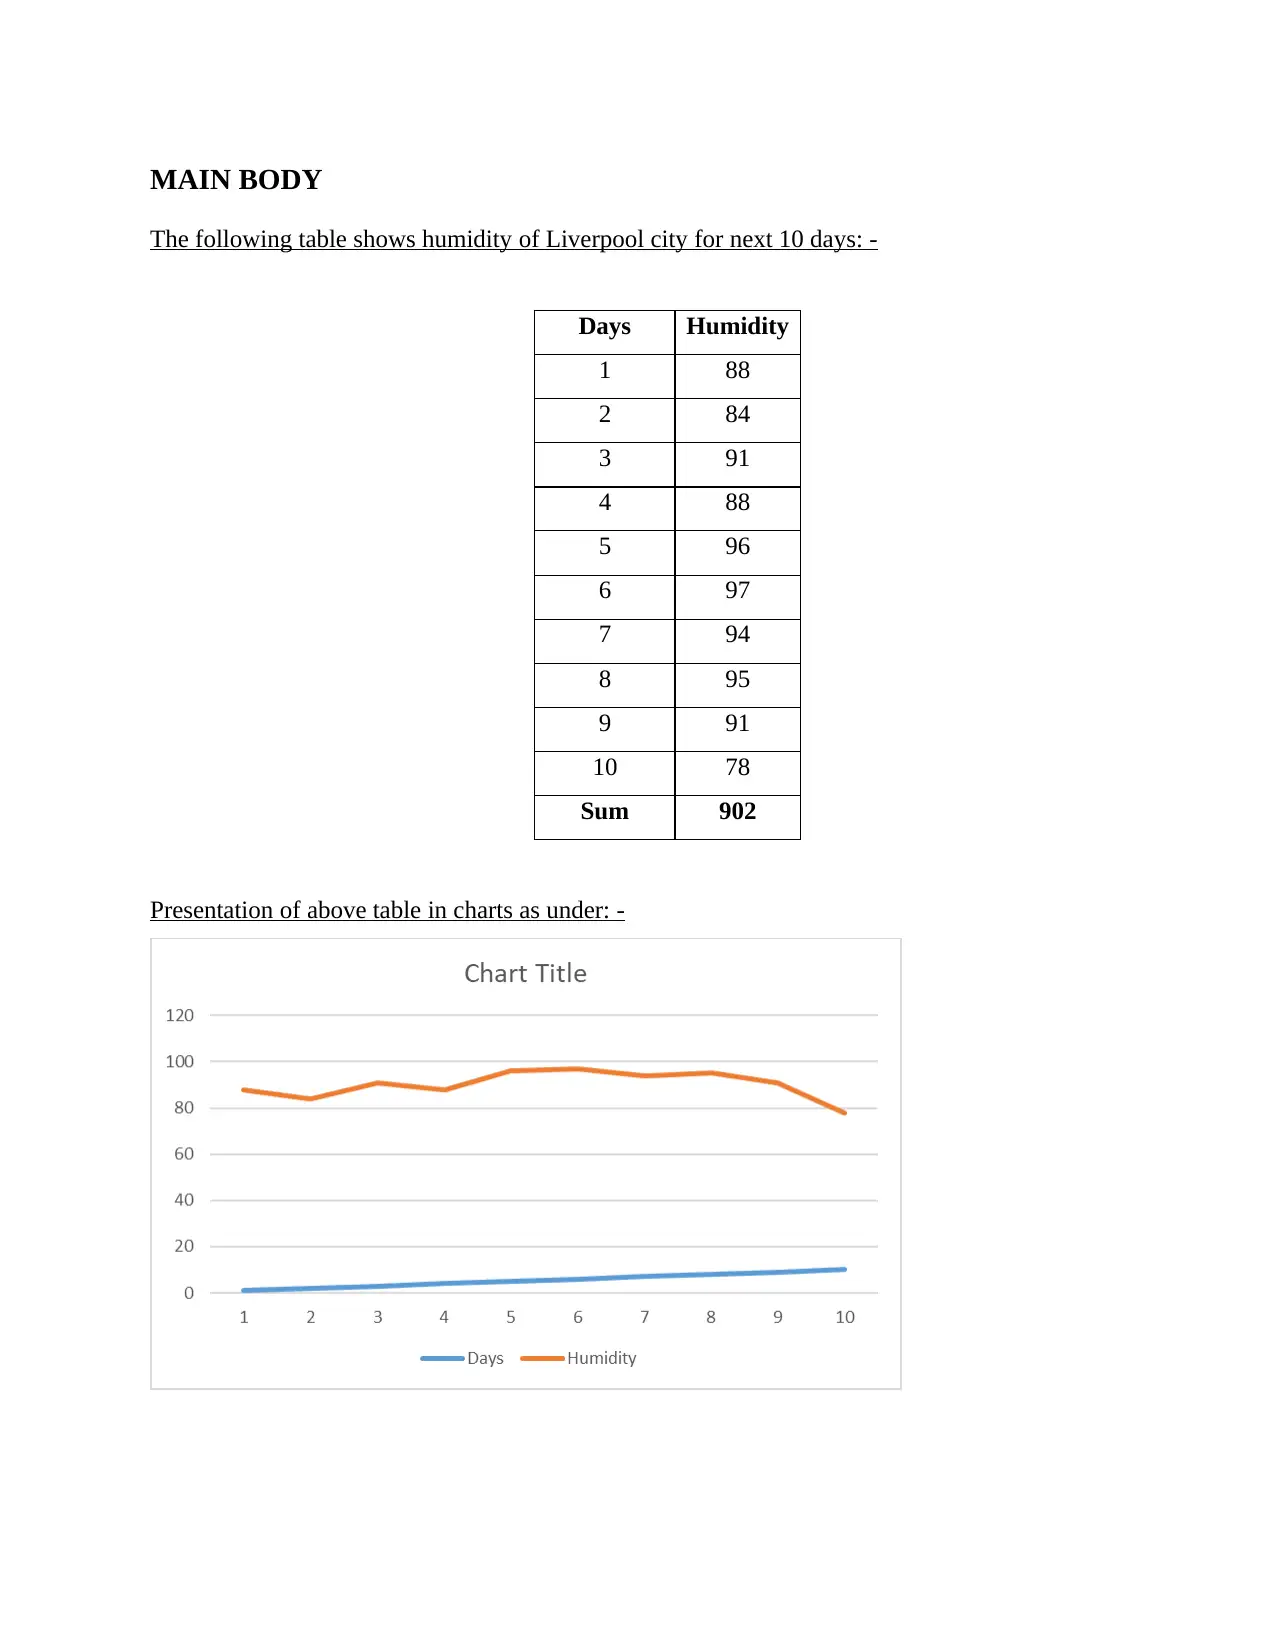
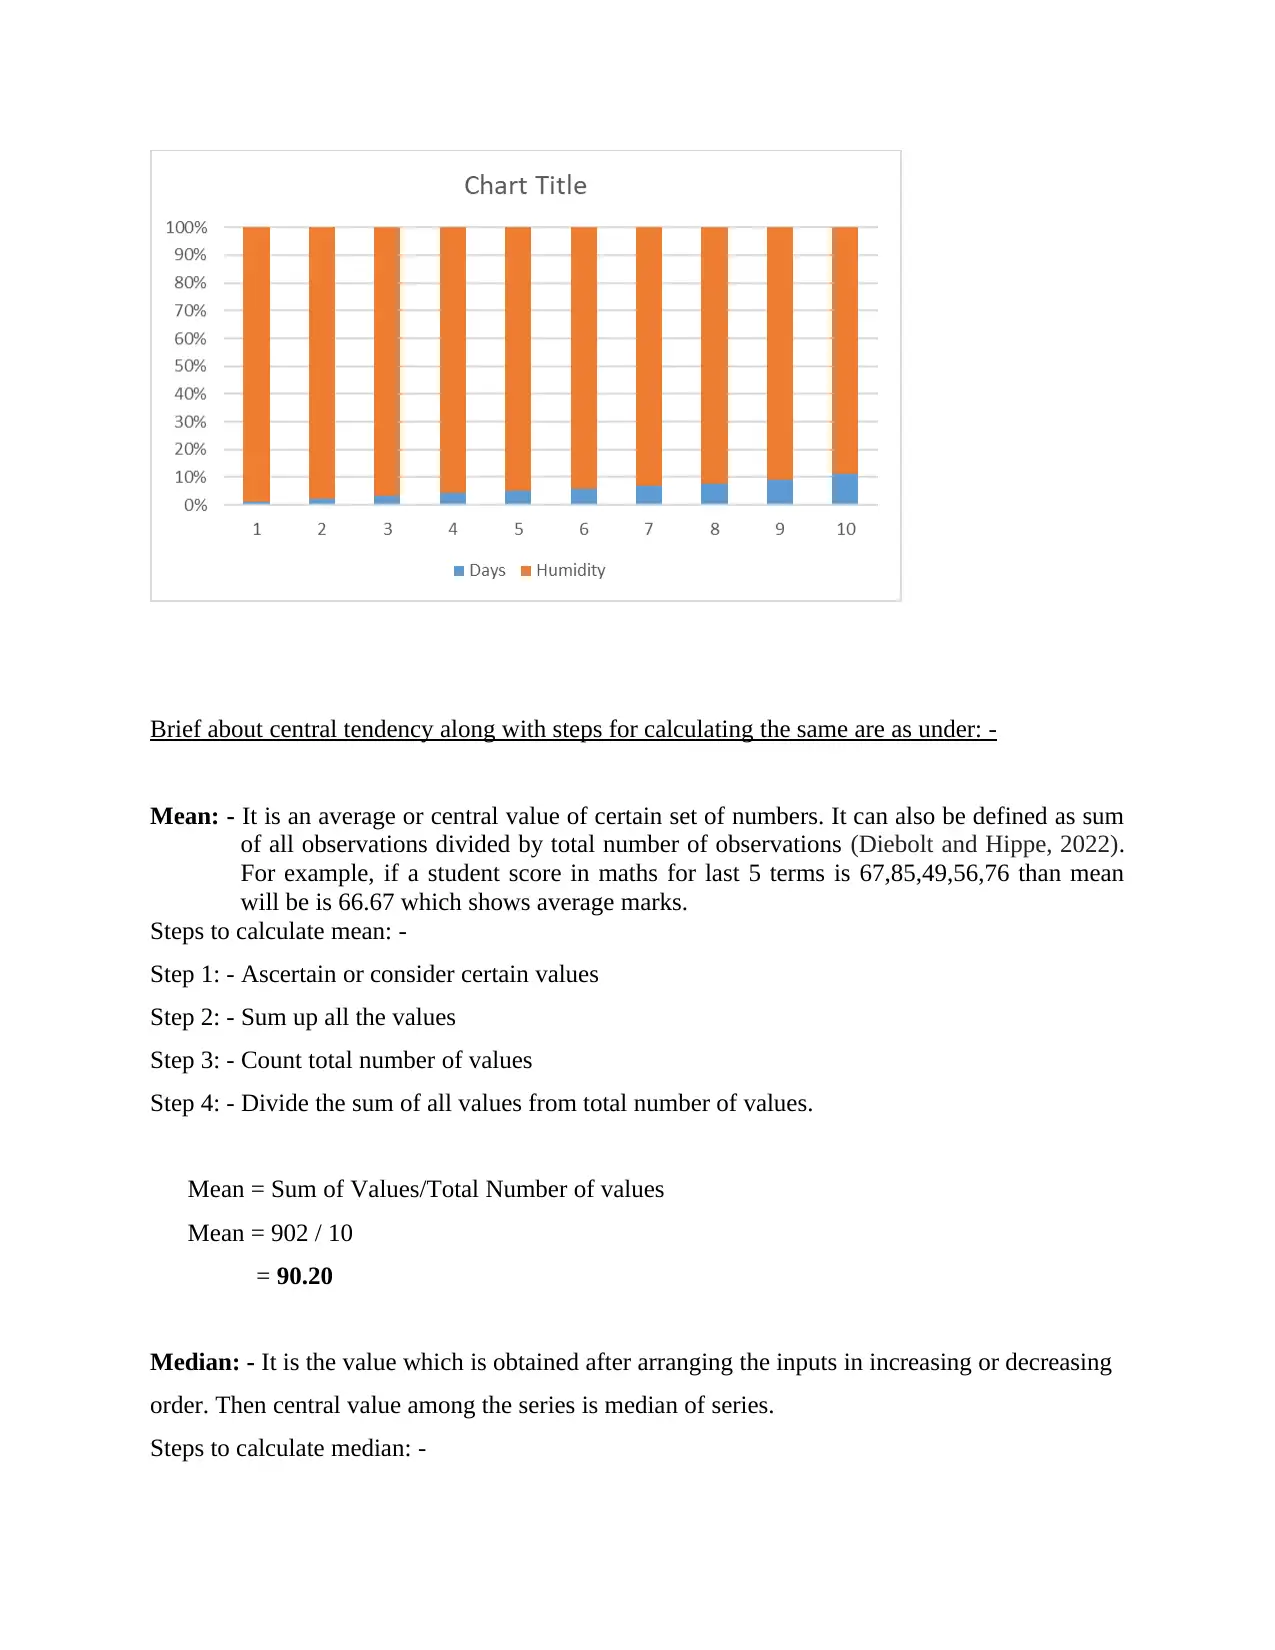
This report provides a detailed analysis of humidity data for Liverpool over a 10-day period. It includes a presentation of the data in chart form and explains key statistical concepts such as mean, median, mode, range, and standard deviation, along with the steps to calculate each. The report then employs a linear forecasting model to predict future humidity values, framing the regression equation and calculating the constant 'c'. The conclusion summarizes the findings, including the calculated statistical measures and the forecasted humidity values, referencing relevant academic sources.

NUMERICY AND
DATA ANALYSIS
DATA ANALYSIS
Paraphrase This Document
Need a fresh take? Get an instant paraphrase of this document with our AI Paraphraser

Contents
MAIN BODY...................................................................................................................................3
The following table shows humidity of Liverpool city for next 10 days: -............................3
Presentation of above table in charts as under: -....................................................................3
Brief about central tendency along with steps for calculating the same are as under: -.........4
Using the linear forecasting model frame the regression equation and calculate value of C.6
CONCLUSION................................................................................................................................8
REFERENCES................................................................................................................................9

MAIN BODY
The following table shows humidity of Liverpool city for next 10 days: -
Days Humidity
1 88
2 84
3 91
4 88
5 96
6 97
7 94
8 95
9 91
10 78
Sum 902
Presentation of above table in charts as under: -
The following table shows humidity of Liverpool city for next 10 days: -
Days Humidity
1 88
2 84
3 91
4 88
5 96
6 97
7 94
8 95
9 91
10 78
Sum 902
Presentation of above table in charts as under: -
⊘ This is a preview!⊘
Do you want full access?
Subscribe today to unlock all pages.

Trusted by 1+ million students worldwide

Brief about central tendency along with steps for calculating the same are as under: -
Mean: - It is an average or central value of certain set of numbers. It can also be defined as sum
of all observations divided by total number of observations (Diebolt and Hippe, 2022).
For example, if a student score in maths for last 5 terms is 67,85,49,56,76 than mean
will be is 66.67 which shows average marks.
Steps to calculate mean: -
Step 1: - Ascertain or consider certain values
Step 2: - Sum up all the values
Step 3: - Count total number of values
Step 4: - Divide the sum of all values from total number of values.
Mean = Sum of Values/Total Number of values
Mean = 902 / 10
= 90.20
Median: - It is the value which is obtained after arranging the inputs in increasing or decreasing
order. Then central value among the series is median of series.
Steps to calculate median: -
Paraphrase This Document
Need a fresh take? Get an instant paraphrase of this document with our AI Paraphraser

Step 1: - First of all arrange the inputs in increasing order (lowest to largest number)
Step 2: - Then calculate the number of observations whether it is odd/even.
Step 3: - If it is Even, then the following formula should be used (N/2)
Step 4: - And if it is odd, then following formula should be used ((N+1)/2)
Step 5: - The resulted outcome is the median.
Median: - If 'n' is odd = (N+1) / 2
If 'n' is even = (N/2)
In the following case all data are in %: -
88,84,91,88,96,97,94,95,91,78
78,84,88,88,91,91,94,95,96,97
Median = (91+91)/2
= 91
Mode: - Mode is the value which has incurred most number of times.
Steps to calculate Mode: -
Step 1: - Collect and organise the data given.
Step 2: - Find out the distinct values.
Step 3: - Count the Frequency of occurrence of the data.
Step 4: - Most occurred value is the Mode.
88,84,91,88,96,97,94,95,91,78
From the above data it can be found that the most occurring value are 88 and 91. This type of
mode is known as Bimodal series.
Range: - The difference between maximum value and lowermost value is known as Range
(Lüssenhop, and Kaiser, 2020). If range is small, it represents the central tendency and
if it is large then it does not represent central tendency.
Steps to calculate Range: -
Step 1: - Arrange all input available.
Step 2: - Then identify highest and the lowest value.
Step 3: - Subtract lowest value from the highest.
Step 4: - The value we got after the third step is Range.

Range = Maximum Value – Minimum value
Range = 97-78
Range = 19
Standard Deviation: - It is a distance of variable from the central tendency, which is generally
mean.
Steps to Calculate Standard Deviation
Step 1: - Firstly we have to find the mean of available data.
Step 2: - For each observation find out difference between value and mode of the data.
Step 3: -Sum of all values of step 2.
Step 4: - Divide the same by number of terms (n).
Step 5: - Finally, Square root the result of step 4.
Standard Deviation = √ (xi – μ) 2 / N
= √ (315.60) / 10
= √ 31.56
= 5.62
Using the linear forecasting model frame the regression equation and calculate value of C.
Linear Forecasting Model: - It predicts ' future values' based on the 'past values' in a linear
y = mx + c
where, 'y' is the dependent variable
'mx' is the independent variable
'c' is the constant
Steps of Calculating m is:
1. Multiply both the variables X and Y which are named as days and humidity.
2. Do the sum of the above calculation?
3. Sum of the x variable and y factor separately.
4. Then multiply both the factors.
5. Calculate ( x)⅀ 2 at the end put the values in the formula.
⊘ This is a preview!⊘
Do you want full access?
Subscribe today to unlock all pages.

Trusted by 1+ million students worldwide

6. The resultant value is the value of 'm'.
M = 10 (4960) – (55) * (902) / 10 * (385) – (55) 2
m = 49600 – 49610 / 3850 - 3025
m = - 10/ 825
m = - .01
Steps of calculation value of 'c'
1. First of all, calculate the sum of 'y' variable.
2. Then calculate the sum of 'x' variable.
3. Finally divide it with the sum of 'N'.
4. The value derived from Step 3 is the value of 'c'.
C = 902 + .01 * 55
c = 902 + .55
c = 902.55
humidity on Day 11: -
m = -.01, c = 902.55 x = 11,
y = - .01 * 11 + 902.55
y = - .11 + 902.55
y = 902.44
Humidity on Day 13: -
Paraphrase This Document
Need a fresh take? Get an instant paraphrase of this document with our AI Paraphraser

M = - .01, c = 902.55, x = 13
y = mx + c
y = - .01 * 13 + 902.55
y = - .13 + 902.55
y = - 902.42
CONCLUSION
From the above calculated data it can be concluded that mean, median and mode are 90.20, 91
and 88/91 respectively. The Range and Standard deviation are 19 and 5.62 respectively. The
value of standard deviation states that variable deviates more than the mean. The values of 'm'
and 'c' derived from the linear forecasting model are - .01 and 902.55 respectively.

REFERENCES
Books and Journals
Diebolt, C. and Hippe, R., 2022. Spatial Clustering of Numeracy and Literacy. In Human Capital
and Regional Development in Europe (pp. 35-55). Springer, Cham.z
Lüssenhop, M. and Kaiser, G., 2020. Refugees and numeracy: what can we learn from
international large-scale assessments, especially from TIMSS?. ZDM. 52(3). pp.541-
555.
Silinskas, G., and et.al., 2020. Responsive home numeracy as children progress from
kindergarten through Grade 1. Early Childhood Research Quarterly. 53. pp.484-495.
Thomas, A., and et.al., 2021. Early Numeracy Assessment In French preschool: structural
analysis and links with children’s characteristics. International Journal of Early Years
Education, pp.1-18.
⊘ This is a preview!⊘
Do you want full access?
Subscribe today to unlock all pages.

Trusted by 1+ million students worldwide
1 out of 9
Related Documents
Your All-in-One AI-Powered Toolkit for Academic Success.
+13062052269
info@desklib.com
Available 24*7 on WhatsApp / Email
Unlock your academic potential
Copyright © 2020–2025 A2Z Services. All Rights Reserved. Developed and managed by ZUCOL.


