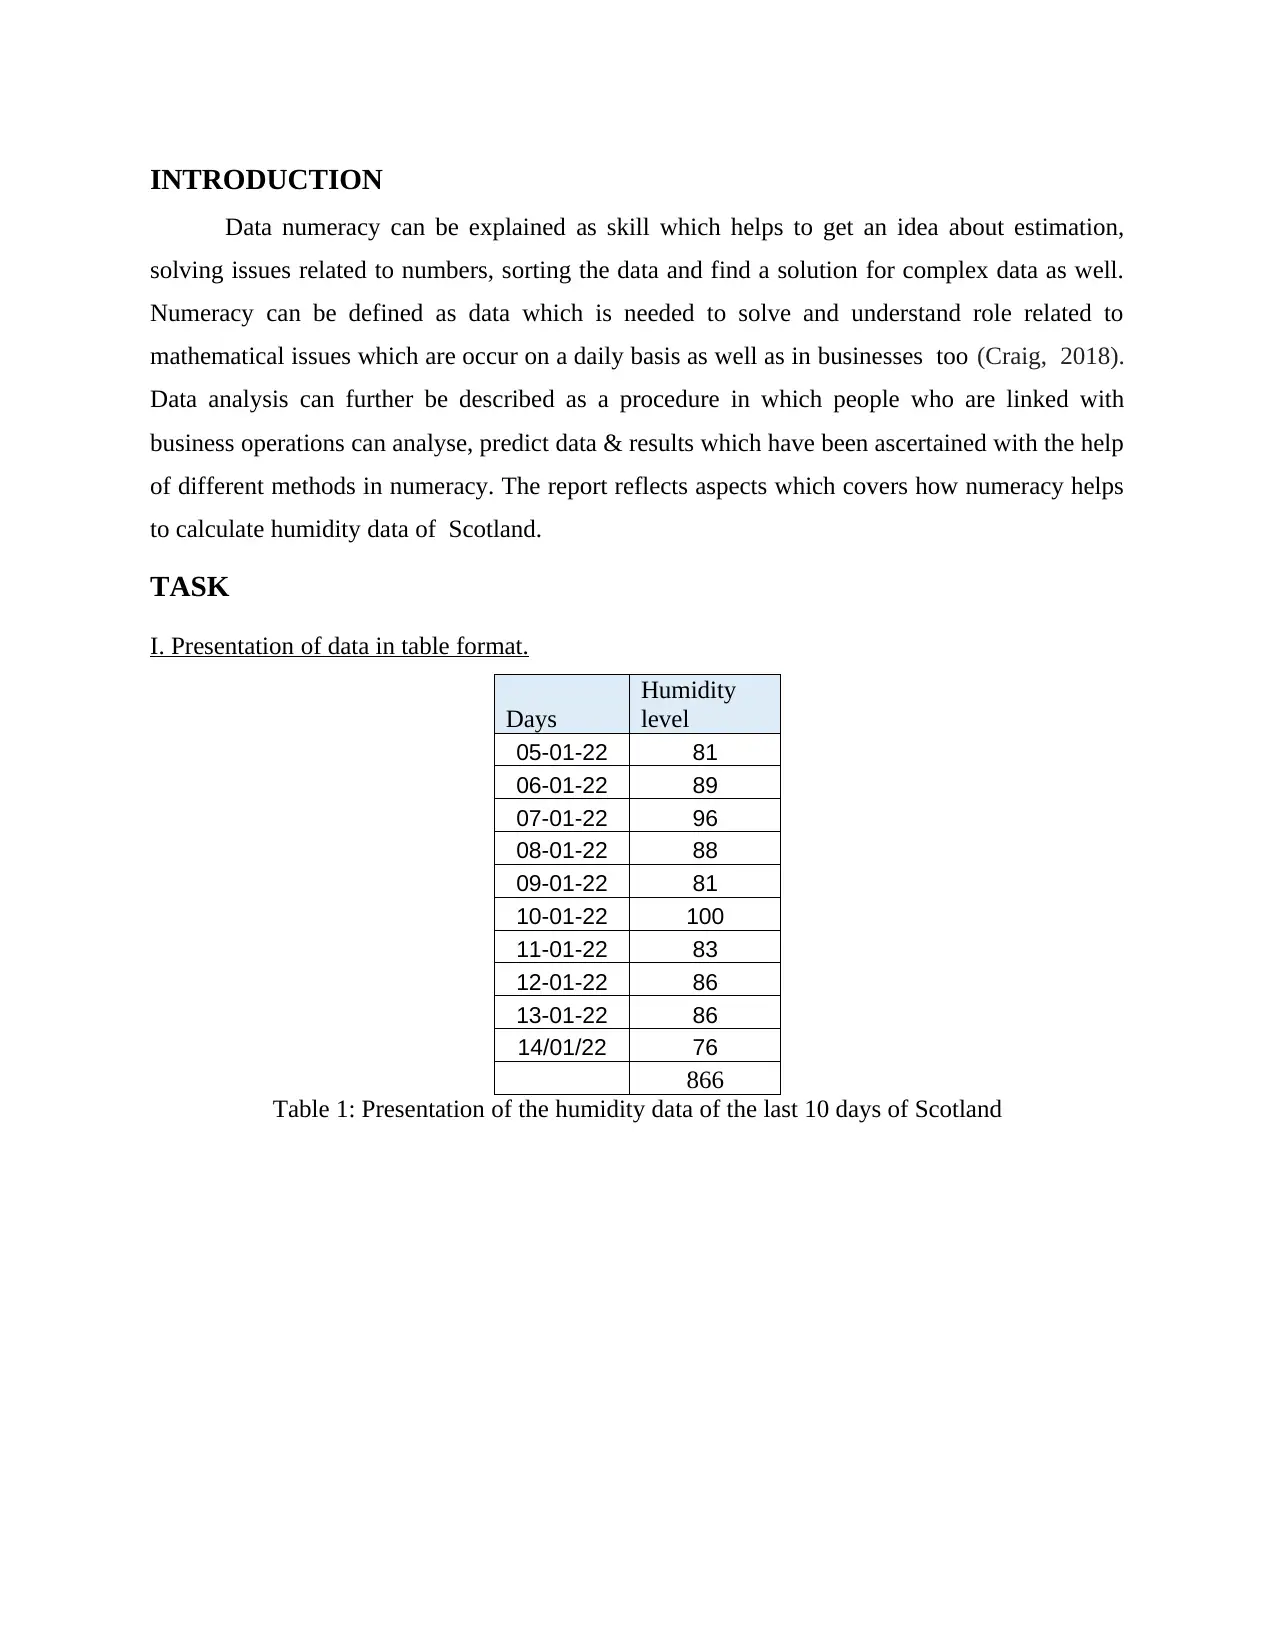
Data Analysis & Numeracy Report: Humidity Levels in Scotland

Verified

Added on  2023/06/14

|10
|1791
|478
Report
AI Summary
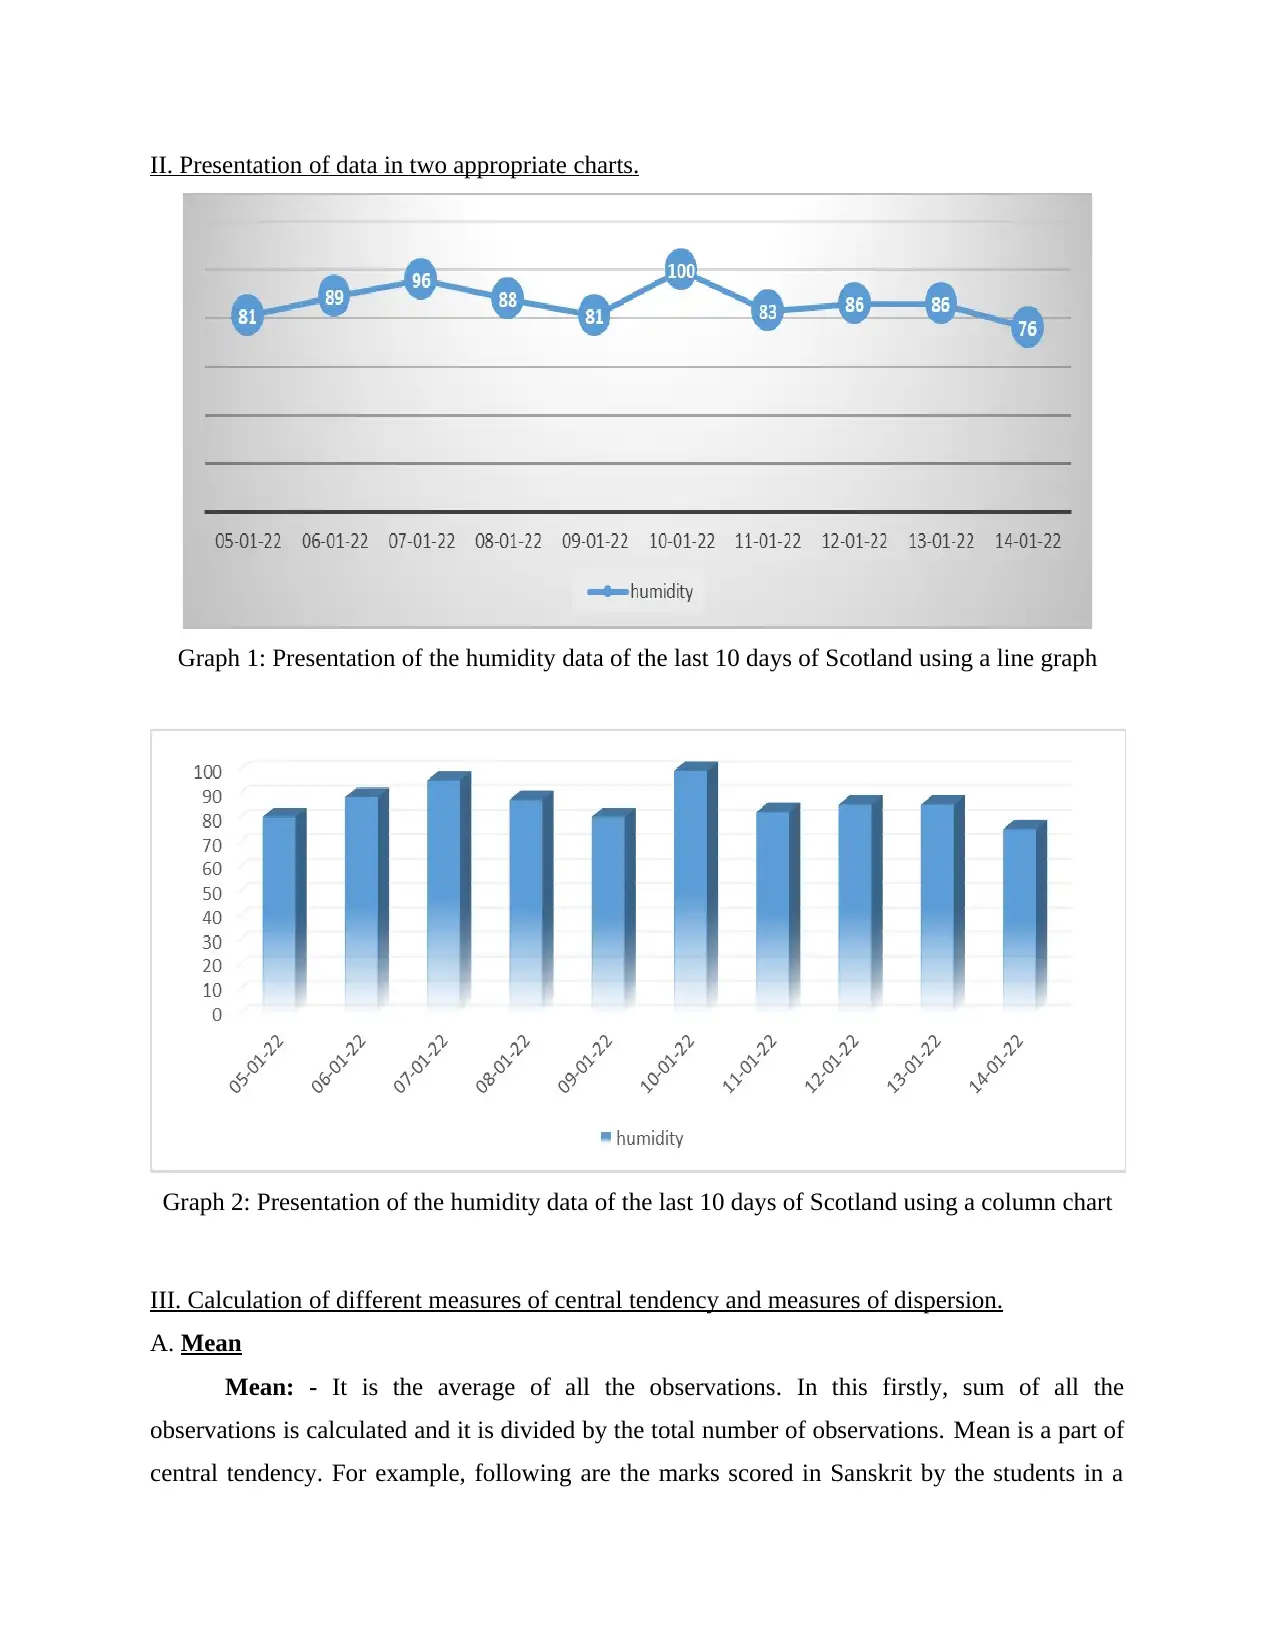
This report provides a detailed analysis of humidity data collected in Scotland, employing various numeracy techniques. It begins with a presentation of the data in tabular and graphical formats, using line and column charts to visualize humidity levels over a 10-day period. The report then delves into calculating measures of central tendency, including mean, median, and mode, and measures of dispersion, such as range and standard deviation, to understand the distribution of the data. Furthermore, a linear forecasting model is applied to predict future humidity levels based on past observations, demonstrating the practical application of numeracy in environmental data analysis. The report concludes by highlighting the importance of data analysis in research and emphasizes the role of numeracy in interpreting quantitative data for informed decision-making. This assignment solution is available on Desklib, where students can find similar resources and study tools.
tabler-icon-diamond-filled.svg

Contribute Materials

Your contribution can guide someone’s learning journey. Share your documents today.
Document Page
and Data Analysis
(Pass Criteria)
tabler-icon-diamond-filled.svg

Secure Best Marks with AI Grader

Need help grading? Try our AI Grader for instant feedback on your assignments.
Document Page
Contents
INTRODUCTION ..........................................................................................................................3
TASK...............................................................................................................................................3
I. Presentation of data in table format..........................................................................................3
II. Presentation of data in two appropriate charts........................................................................4
III. Calculation of different measures of central tendency and measures of dispersion..............4
IV. Calculation of different elements of linear forecasting model..............................................7
CONCLUSION ..............................................................................................................................9
REFERENCES..............................................................................................................................10
Document Page
INTRODUCTION
Data numeracy can be explained as skill which helps to get an idea about estimation,
solving issues related to numbers, sorting the data and find a solution for complex data as well.
Numeracy can be defined as data which is needed to solve and understand role related to
mathematical issues which are occur on a daily basis as well as in businesses too (Craig, 2018).
Data analysis can further be described as a procedure in which people who are linked with
business operations can analyse, predict data & results which have been ascertained with the help
of different methods in numeracy. The report reflects aspects which covers how numeracy helps
to calculate humidity data of Scotland.
TASK
I. Presentation of data in table format.
Days
Humidity
level
05-01-22 81
06-01-22 89
07-01-22 96
08-01-22 88
09-01-22 81
10-01-22 100
11-01-22 83
12-01-22 86
13-01-22 86
14/01/22 76
866
Table 1: Presentation of the humidity data of the last 10 days of Scotland
Document Page
II. Presentation of data in two appropriate charts.
Graph 1: Presentation of the humidity data of the last 10 days of Scotland using a line graph
Graph 2: Presentation of the humidity data of the last 10 days of Scotland using a column chart
III. Calculation of different measures of central tendency and measures of dispersion.
A. Mean
Mean: - It is the average of all the observations. In this firstly, sum of all the
observations is calculated and it is divided by the total number of observations. Mean is a part of
central tendency. For example, following are the marks scored in Sanskrit by the students in a
tabler-icon-diamond-filled.svg

Secure Best Marks with AI Grader

Need help grading? Try our AI Grader for instant feedback on your assignments.
Document Page
exam are as follows 92, 85 ,88 ,95. Then the mean value of students is 90 (Dewi, Suryana and
Hidayat, 2020).
Steps to calculate mean: -
Step 1: - Find out all the values given
Step 2: - Total of all the observations
Step 3: - Work out the total observation
Step 4: - Divide sum of all the observations to the total number of observations
Mean= S/N
Mean = 877 / 10
= 87.7
Where 's' means Sum of all the observations and 'N' means total number of observations.
Median: - Firstly the data should be arranged in ascending or descending order and then
the middle term is selected as according to the number of terms (Grasby and et. al., 2020). If the
data is odd then the middle term is selected. And if the number of observations is even then the
following formula is applied. It explains the middle term of the data.
Steps to calculate median: -
Step 1: - Firstly data should be arranged in ascending order or descending order.
Step 2: - Calculate the no. of observations whether it is even or odd.
Step 3: - The result number is Even, then the following expression should be used (N/2)
Step 4: - And if the result is odd, then the following expression should be used ((N+1)/2)
Step 5: - The result is the point of median.
Median: -
'n' is odd = (N+1) / 2
'n' is even = (N/2)
In the following case all the data are in %: -
85, 88, 87, 92, 84, 91, 97, 88, 91, 74
74, 84, 85, 87, 88, 88, 91, 91, 92, 97
Median= (N/2)
= 10/2
= 5th term
Document Page
= 88
Mode: - This is value which resembles most of the time in a data (Lüssenhop and Kaiser,
2020).
Following are the steps to compute Mode: -
Step 1: - Accumulate and arrange the data given.
Step 2: - Find out the distinct values.
Step 3: - Tally the Frequency of happening of the data.
Step 4: - Value which has occurred the most is Mode.
74, 84, 85, 87, 88, 88, 91, 91, 92, 97
From the above data it can be found that the most occurring value are 88 and 91. This is also
known as Bimodal.
Mode of the Humidity data of Scotland = 83 as it is occurring two times in the data set.
D. Range
Range explains variation observed between data of upper as well as lower limit on a set
scale. It helps to understand what data is falling in which range and what would be the difference
between largest and smallest value and how can its variability be measured (Zamarian and et.
al., 2020). It helps to determine two extreme values in a data series. It helps to calculate central
tendency from a random range of data collected, for any possible city at a specified point of time.
Range can be calculated with the help of following steps:
Step 1: Arrange the following randomly spread data in a line ranging from ascending to
descending.
Step 2: After arrangement find the lowest and highest value.
Step 3: Subtract identified highest value from lowest value.
Step 4: The value recorded is Range for the collected data.
Range = Highest value – Lowest value
Humidity range for Scotland = 97 – 74
= 23
E. Standard Deviation
It can be depicted as data which can explain deviation recorded from actual mean. It
helps to understand the dispersion of data from actual value and how distributed it is. The steps
to calculate the same are listed below :
Document Page
Step 1: Calculate the mean for collected data.
Step 2: At each step find deviation from actual mean recorded and mode of the series.
Step 3: Add all the values obtained from step 2.
Step 4: After summing the values divide the value by no. of observations(n).
Step 5: At last Square root the result calculated so far for finding standard deviation.
Standard Deviation of Scotland for Humidity data = √ (xi – μ) 2 / N
= √ (336.1) / 10
= 18.36/10
= 1.84
IV. Calculation of different elements of linear forecasting model.
Linear forecasting is helpful in understanding futuristic results based on past values in a
linear equation.
y = mx + c
where, 'y' highlights dependent variable
'mx' denotes independent variable
'c' is constant
Steps for calculating m:
Step 1: Multiplication of both variables X and Y which reflect data for days and humidity.
Step 2: Add above computed data.
Step 3: Addition of x and y variable.
Step 4: Multiply both the factors.
Step 5: Calculate ( x) 2 by placing the data in the formula.
Step 6: The value obtained is for 'm'.
m= 10 (4798) – (55) * (877) / 10 * (385) – (55) 2
m= 47980 – 48235 / 3850 - 3025
m= -255 / 825
tabler-icon-diamond-filled.svg

Paraphrase This Document

Need a fresh take? Get an instant paraphrase of this document with our AI Paraphraser
Document Page
m= -0.31
Steps to calculate value for C:
Step 1: Calculate value for 'y'.
Step 2: Find value for 'x' with the help of summation of data.
Step 3: Divide the value by sum of 'N'.
Step 4: The value recorded with the help of above steps results as the value for 'c'.
c= 877 – (-0.31) * (55) / 10
c = (877 + 17.05) / 10
c = 894.05 / 10
c = 89.41
Humidity on Day 11th :
m= -0.31, c= 89.41, x= 11,
y= mx + c
y= -0.31(11) + 89.41
y = - 3.41 + 89.41
y = 86.0
Humidity on Day 13th :
m= -0.31, c= 89.41, x=13
y= mx+ c
y= -0.31 (13) + 89.41
y= -4.03 + 89.41
Document Page
y= 85.38
Humidity on 11th Day is 85.38 %
CONCLUSION
From the above prepared report it can be said that Data analysis is a major step for
understanding the use of it in research based areas. One who is implementing such methods must
have thorough knowledge as which tool must be applied and how they would help in interpreting
data. Data numeracy helps to understand quantitative data which affect working of company on a
larger scale as compared to qualitative data. The above data explains humidity of Scotland with
the help of different techniques and analyse how they will provide a better understanding for
future perspectives as well.
Document Page
REFERENCES
Books and Journals
Craig, J., 2018. The promises of numeracy. Educational Studies in Mathematics. 99(1). pp.57-71.
Dewi, V.F., Suryana, Y. and Hidayat, S., 2020. Pengaruh Penggunaan Jarimatika Terhadap
Kemampuan Berhitung Perkalian Peserta Didik Kelas IV Sekolah Dasar. EduBasic
Journal: Jurnal Pendidikan Dasar. 2(2). pp.79-87.
Grasby, K.L. and et. al., 2020. Estimating classroom-level influences on literacy and numeracy:
A twin study. Journal of Educational Psychology. 112(6). p.1154.
Lüssenhop, M. and Kaiser, G., 2020. Refugees and numeracy: what can we learn from
international large-scale assessments, especially from TIMSS?. ZDM. 52(3). pp.541-
555.
Zamarian, L. and et. al., 2020. Effects of cognitive functioning and education on later-life health
numeracy. Gerontology. 66(6). pp.582-592.
chevron_up_icon
1 out of 10
circle_padding
hide_on_mobile
zoom_out_icon
logo.png

Your All-in-One AI-Powered Toolkit for Academic Success.

Available 24*7 on WhatsApp / Email

[object Object]