Report: Numeracy and Data Analysis of Humidity Using Statistics

Verified

Added on  2023/06/15

|8
|1220
|295
Report
AI Summary
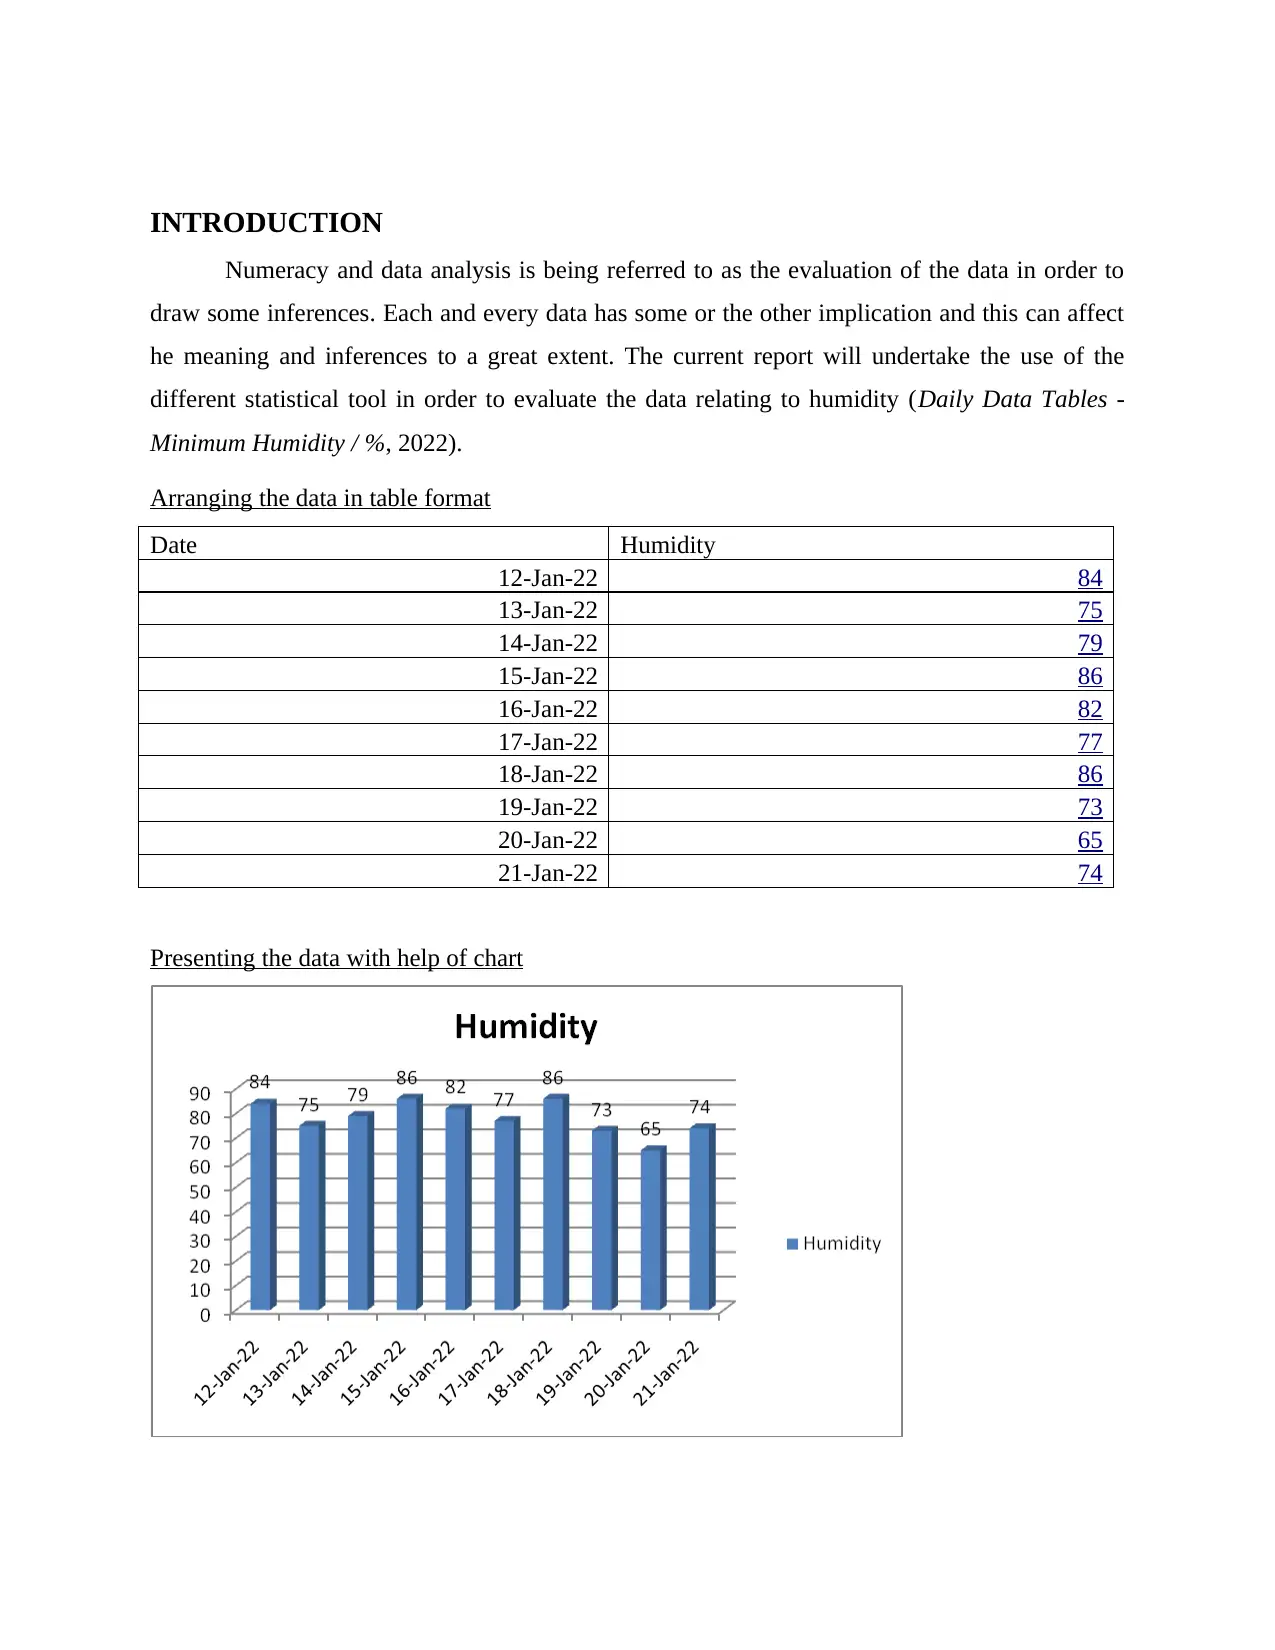
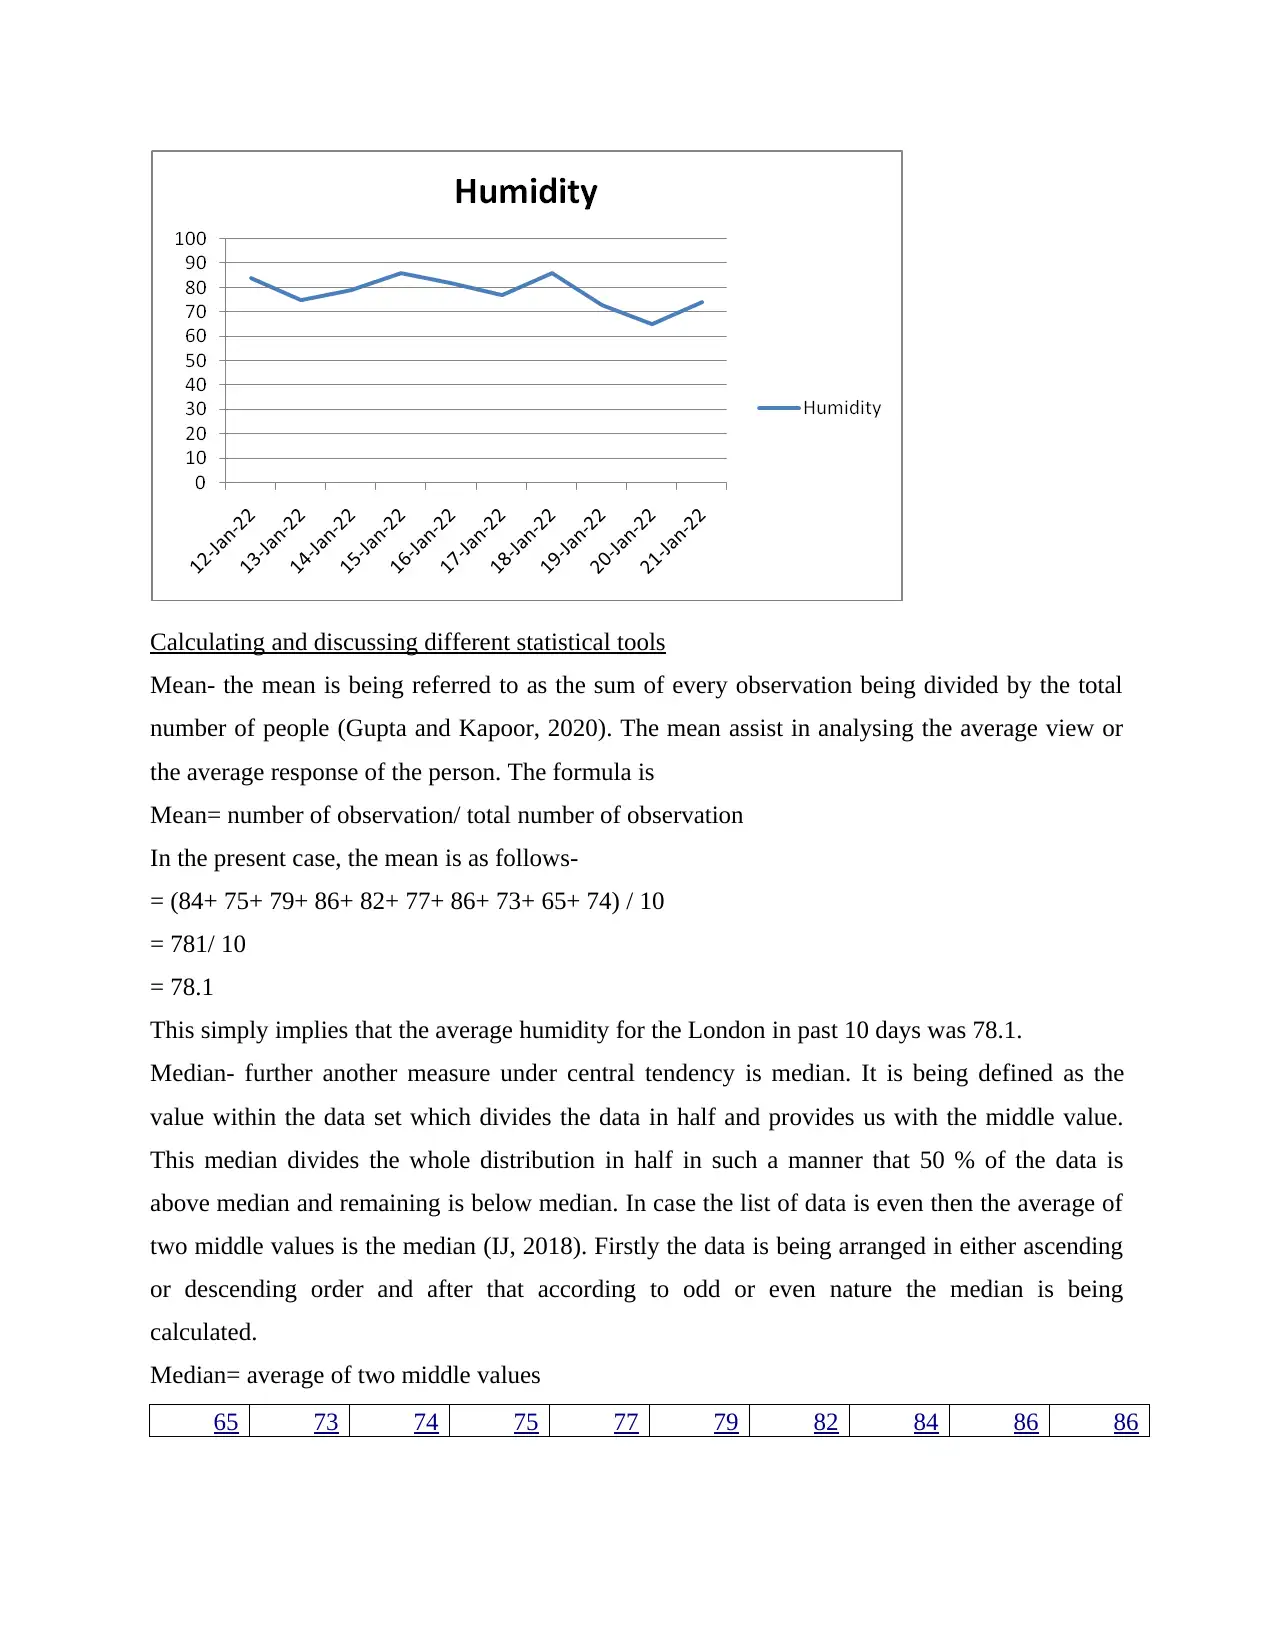
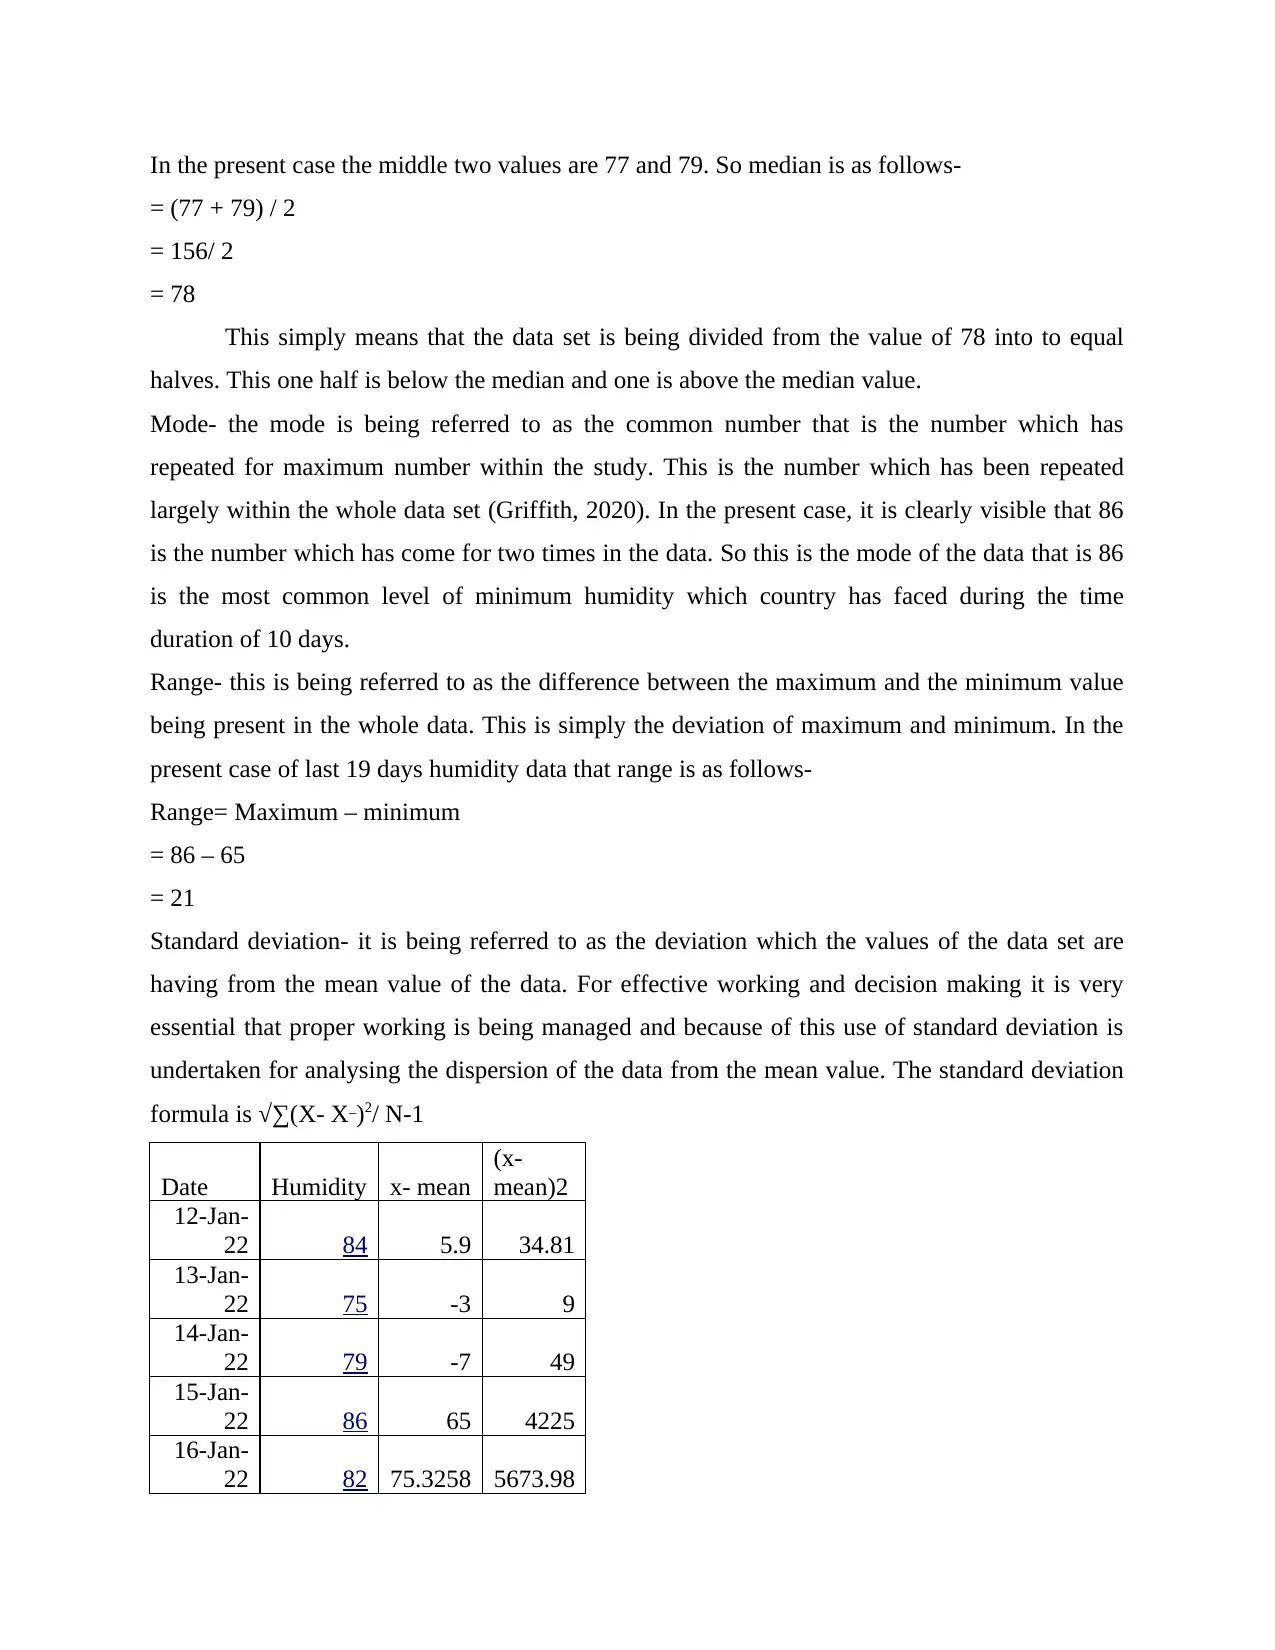
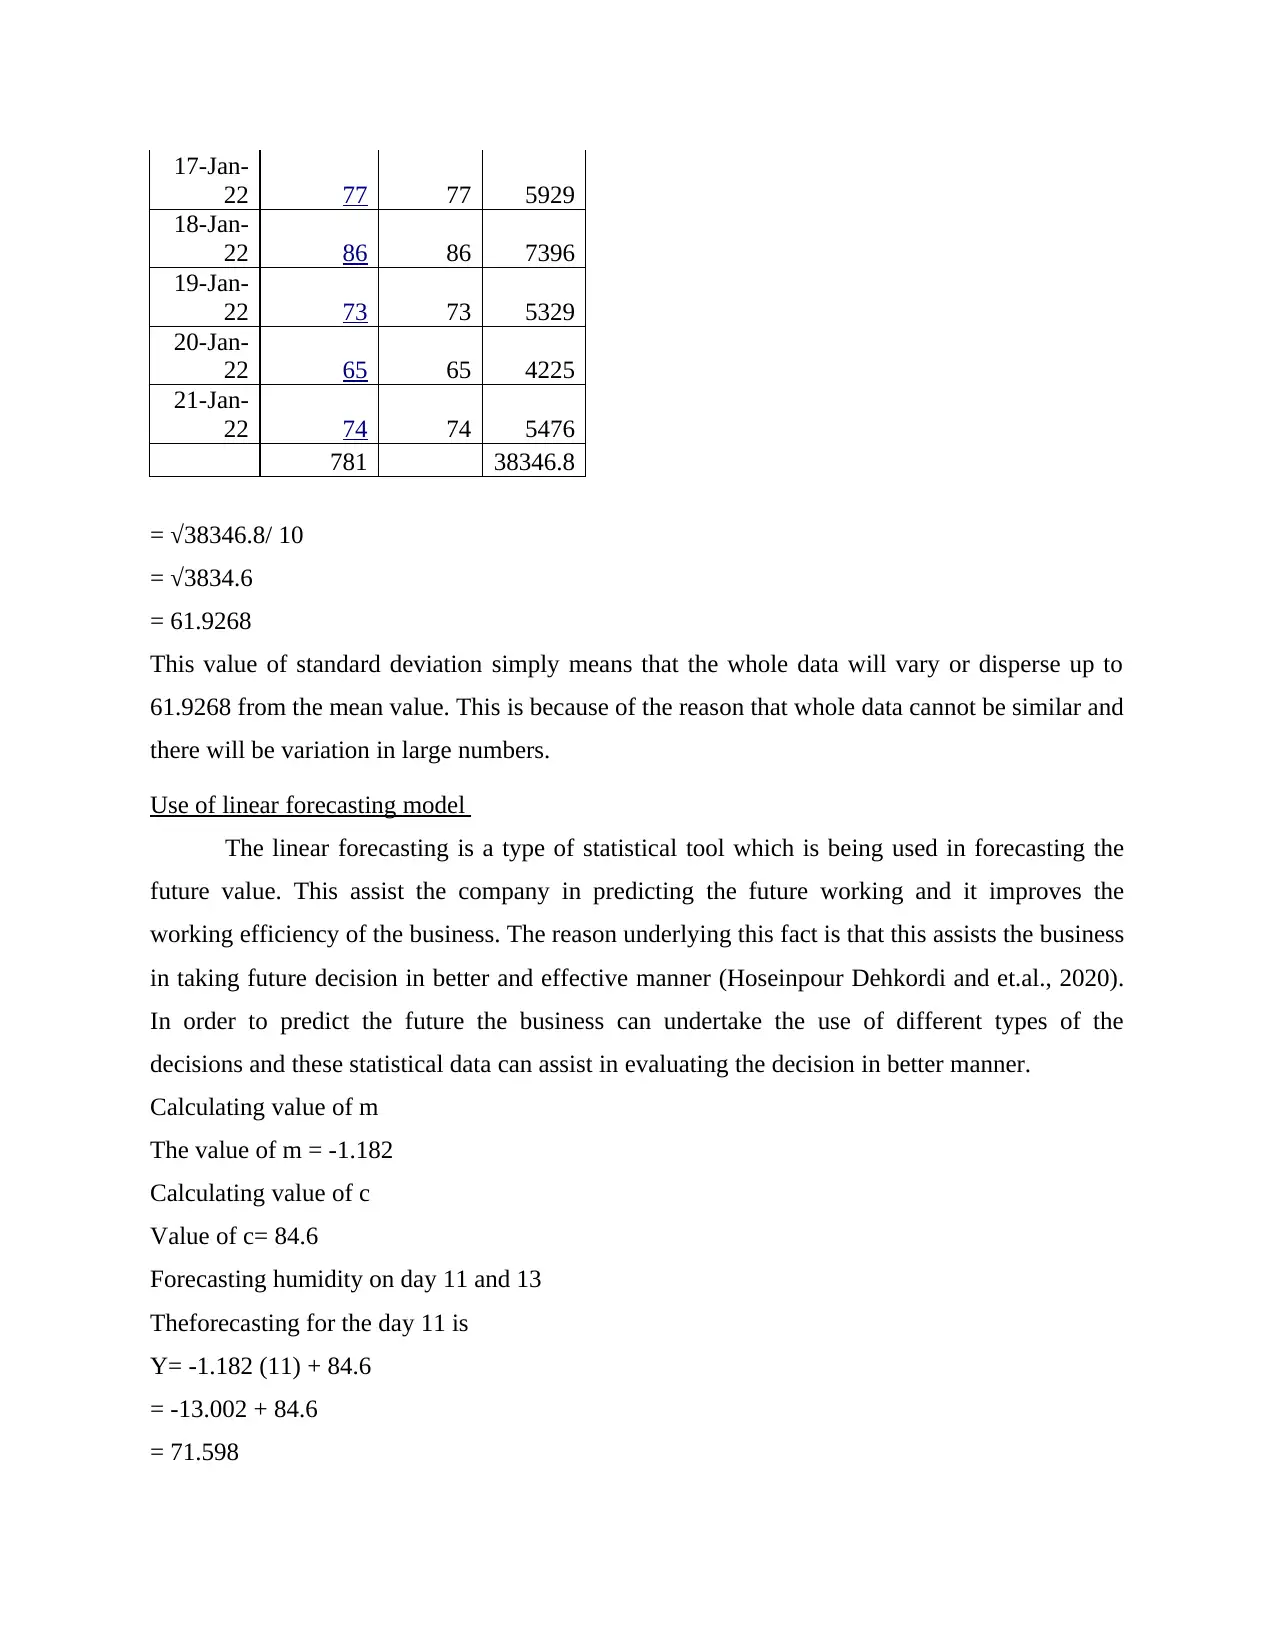
This report focuses on the numeracy and data analysis of humidity data, employing various statistical tools to draw meaningful inferences. The analysis includes calculating the mean, median, mode, range, and standard deviation of humidity levels recorded over a 10-day period. The mean humidity was found to be 78.1, with a median of 78 and a mode of 86. The standard deviation was calculated as 61.9268, indicating the dispersion of data from the mean. Furthermore, a linear forecasting model was applied to predict future humidity levels, estimating 71.598 for day 11 and 69.234 for day 13. The report concludes that data analysis is crucial for making informed decisions and provides a clear understanding of humidity trends. Desklib provides similar solved assignments for students.
Document Page
Numeracy and Data Analysis
tabler-icon-diamond-filled.svg

Paraphrase This Document

Need a fresh take? Get an instant paraphrase of this document with our AI Paraphraser
Document Page
TABLE OF CONTENTS
INTRODUCTION...........................................................................................................................3
Arranging the data in table format..............................................................................................3
Presenting the data with help of chart.........................................................................................3
Calculating and discussing different statistical tools..................................................................4
Use of linear forecasting model..................................................................................................6
CONCLUSION................................................................................................................................7
REFERENCES................................................................................................................................8
Document Page
INTRODUCTION
Numeracy and data analysis is being referred to as the evaluation of the data in order to
draw some inferences. Each and every data has some or the other implication and this can affect
he meaning and inferences to a great extent. The current report will undertake the use of the
different statistical tool in order to evaluate the data relating to humidity (Daily Data Tables -
Minimum Humidity / %, 2022).
Arranging the data in table format
Date Humidity
12-Jan-22 84
13-Jan-22 75
14-Jan-22 79
15-Jan-22 86
16-Jan-22 82
17-Jan-22 77
18-Jan-22 86
19-Jan-22 73
20-Jan-22 65
21-Jan-22 74
Presenting the data with help of chart
Document Page
Calculating and discussing different statistical tools
Mean- the mean is being referred to as the sum of every observation being divided by the total
number of people (Gupta and Kapoor, 2020). The mean assist in analysing the average view or
the average response of the person. The formula is
Mean= number of observation/ total number of observation
In the present case, the mean is as follows-
= (84+ 75+ 79+ 86+ 82+ 77+ 86+ 73+ 65+ 74) / 10
= 781/ 10
= 78.1
This simply implies that the average humidity for the London in past 10 days was 78.1.
Median- further another measure under central tendency is median. It is being defined as the
value within the data set which divides the data in half and provides us with the middle value.
This median divides the whole distribution in half in such a manner that 50 % of the data is
above median and remaining is below median. In case the list of data is even then the average of
two middle values is the median (IJ, 2018). Firstly the data is being arranged in either ascending
or descending order and after that according to odd or even nature the median is being
calculated.
Median= average of two middle values
65 73 74 75 77 79 82 84 86 86
tabler-icon-diamond-filled.svg

Paraphrase This Document

Need a fresh take? Get an instant paraphrase of this document with our AI Paraphraser
Document Page
In the present case the middle two values are 77 and 79. So median is as follows-
= (77 + 79) / 2
= 156/ 2
= 78
This simply means that the data set is being divided from the value of 78 into to equal
halves. This one half is below the median and one is above the median value.
Mode- the mode is being referred to as the common number that is the number which has
repeated for maximum number within the study. This is the number which has been repeated
largely within the whole data set (Griffith, 2020). In the present case, it is clearly visible that 86
is the number which has come for two times in the data. So this is the mode of the data that is 86
is the most common level of minimum humidity which country has faced during the time
duration of 10 days.
Range- this is being referred to as the difference between the maximum and the minimum value
being present in the whole data. This is simply the deviation of maximum and minimum. In the
present case of last 19 days humidity data that range is as follows-
Range= Maximum – minimum
= 86 – 65
= 21
Standard deviation- it is being referred to as the deviation which the values of the data set are
having from the mean value of the data. For effective working and decision making it is very
essential that proper working is being managed and because of this use of standard deviation is
undertaken for analysing the dispersion of the data from the mean value. The standard deviation
formula is √∑(X- X_)2/ N-1
Date Humidity x- mean
(x-
mean)2
12-Jan-
22 84 5.9 34.81
13-Jan-
22 75 -3 9
14-Jan-
22 79 -7 49
15-Jan-
22 86 65 4225
16-Jan-
22 82 75.3258 5673.98
Document Page
17-Jan-
22 77 77 5929
18-Jan-
22 86 86 7396
19-Jan-
22 73 73 5329
20-Jan-
22 65 65 4225
21-Jan-
22 74 74 5476
781 38346.8
= √38346.8/ 10
= √3834.6
= 61.9268
This value of standard deviation simply means that the whole data will vary or disperse up to
61.9268 from the mean value. This is because of the reason that whole data cannot be similar and
there will be variation in large numbers.
Use of linear forecasting model
The linear forecasting is a type of statistical tool which is being used in forecasting the
future value. This assist the company in predicting the future working and it improves the
working efficiency of the business. The reason underlying this fact is that this assists the business
in taking future decision in better and effective manner (Hoseinpour Dehkordi and et.al., 2020).
In order to predict the future the business can undertake the use of different types of the
decisions and these statistical data can assist in evaluating the decision in better manner.
Calculating value of m
The value of m = -1.182
Calculating value of c
Value of c= 84.6
Forecasting humidity on day 11 and 13
Theforecasting for the day 11 is
Y= -1.182 (11) + 84.6
= -13.002 + 84.6
= 71.598
Document Page
The forecasting for 13 day is as follows-
Y= -1.182 (13) + 84.6
= -15.366 + 84.6
= 69.234
With the help of the above linear forecasting model it is clear that on day 11 the humidity will be
71.598 and on day 13 it will be 69.234.
CONCLUSION
The above report evaluated the fact that data analysis is very important for the company
and other people in order to draw some inferences. This is necessary because of the reason that it
assists the company in evaluating the business decision taken is correct or not. The above report
evaluated that the mean humidity for 10 days was 78.1. Further it was also evaluated that the
forecasted humidity for 11 day was 71.598 and for 13 day it was 69.234.
tabler-icon-diamond-filled.svg

Paraphrase This Document

Need a fresh take? Get an instant paraphrase of this document with our AI Paraphraser
Document Page
REFERENCES
Books and Journals
Gupta, S. C. and Kapoor, V.K., 2020. Fundamentals of mathematical statistics. Sultan Chand &
Sons.
IJ, H., 2018. Statistics versus machine learning. Nature methods. 15(4). p.233.
Griffith, D. A., 2020. Introduction: the need for spatial statistics. In Practical handbook of
spatial statistics (pp. 1-15). CRC Press.
Hoseinpour Dehkordi, A., and et.al., 2020. Understanding epidemic data and statistics: A case
study of COVID19. Journal of medical virology. 92(7). pp.868-882.
Online
Daily Data Tables - Minimum Humidity / %. 2022. [Online]. Available through:
<http://nw3weather.co.uk/wxdataday.php?vartype=hmin&year=2022>
chevron_up_icon
1 out of 8
circle_padding
hide_on_mobile
zoom_out_icon
[object Object]