Financial Review Magazine: Data Analysis of Car Insurance Brokers
VerifiedAdded on 2023/06/08
|16
|2410
|76
Report
AI Summary
This report, prepared for Financial Review Magazine, analyzes a dataset of 400 customers from the Insurance Brokers Association to evaluate the effectiveness of car insurance brokerage services. The analysis investigates customer savings on insurance premiums, comparing the experiences of those who used brokers versus those who did not, and examines the performance of different brokers. The report explores factors such as vehicle type, valuation methods, and customer satisfaction levels, including gender-based comparisons and the impact of negotiation attempts. Statistical tests are conducted to assess claims made by the Insurance Brokers Association and other stakeholders, providing insights into the benefits of using brokers and identifying trends in customer experiences, ultimately aiming to inform readers about the value proposition of car insurance brokerage services. The report's findings include customer savings analysis, performance comparisons of different brokers, and identification of customer dissatisfaction factors.
Running Head: DATA ANALYTICS AND BUSINESS INTELLIGENCE
Data Analytics and Business Intelligence
Name of the Student
Name of the University
Author Note
Data Analytics and Business Intelligence
Name of the Student
Name of the University
Author Note
Paraphrase This Document
Need a fresh take? Get an instant paraphrase of this document with our AI Paraphraser
1DATA ANALYTICS AND BUSINESS INTELLIGENCE
Table of Contents
Introduction......................................................................................................................................3
Main Body.......................................................................................................................................3
Customer’s worse off using a broker...........................................................................................3
Average savings using a sports or luxury car..............................................................................3
Claim of Insurance Brokers Association.....................................................................................4
Incentive for Customer................................................................................................................4
Top performing Broker................................................................................................................4
Dissatisfaction of Customers.......................................................................................................5
Average savings on insurance premiums....................................................................................5
Savings based on Valuation method............................................................................................5
Gender comparison based on Diamond NCBR...........................................................................6
Conclusion.......................................................................................................................................6
Appendices......................................................................................................................................8
Task 1...........................................................................................................................................8
Task 2...........................................................................................................................................8
Task 3...........................................................................................................................................9
Task 4.........................................................................................................................................10
Task 5.........................................................................................................................................11
Task 6.........................................................................................................................................12
2DATA ANALYTICS AND BUSINESS INTELLIGENCE
Task 7.........................................................................................................................................13
Part a..........................................................................................................................................13
Part b..........................................................................................................................................14
Part c..........................................................................................................................................15
⊘ This is a preview!⊘
Do you want full access?
Subscribe today to unlock all pages.
Trusted by 1+ million students worldwide
3DATA ANALYTICS AND BUSINESS INTELLIGENCE
To: Daniel Rand
From: Mercedes Knight
Subject: Analysis of car insurance brokerage services
Introduction
Dear, Daniel this is in response to your mail regarding car insurance brokers. We obtained a
sample data of 400 customers from the insurance brokers association. We present the analysis of
the information with reference to the savings made by customers who have taken the aid of
brokerage firms. The detailed analysis of the insurance savings was made possible since the data
contained information on gender, NCBR, valuation method, type of vehicle, broker’s and
satisfaction level of the customers.
Main Body
Customer’s worse off using a broker
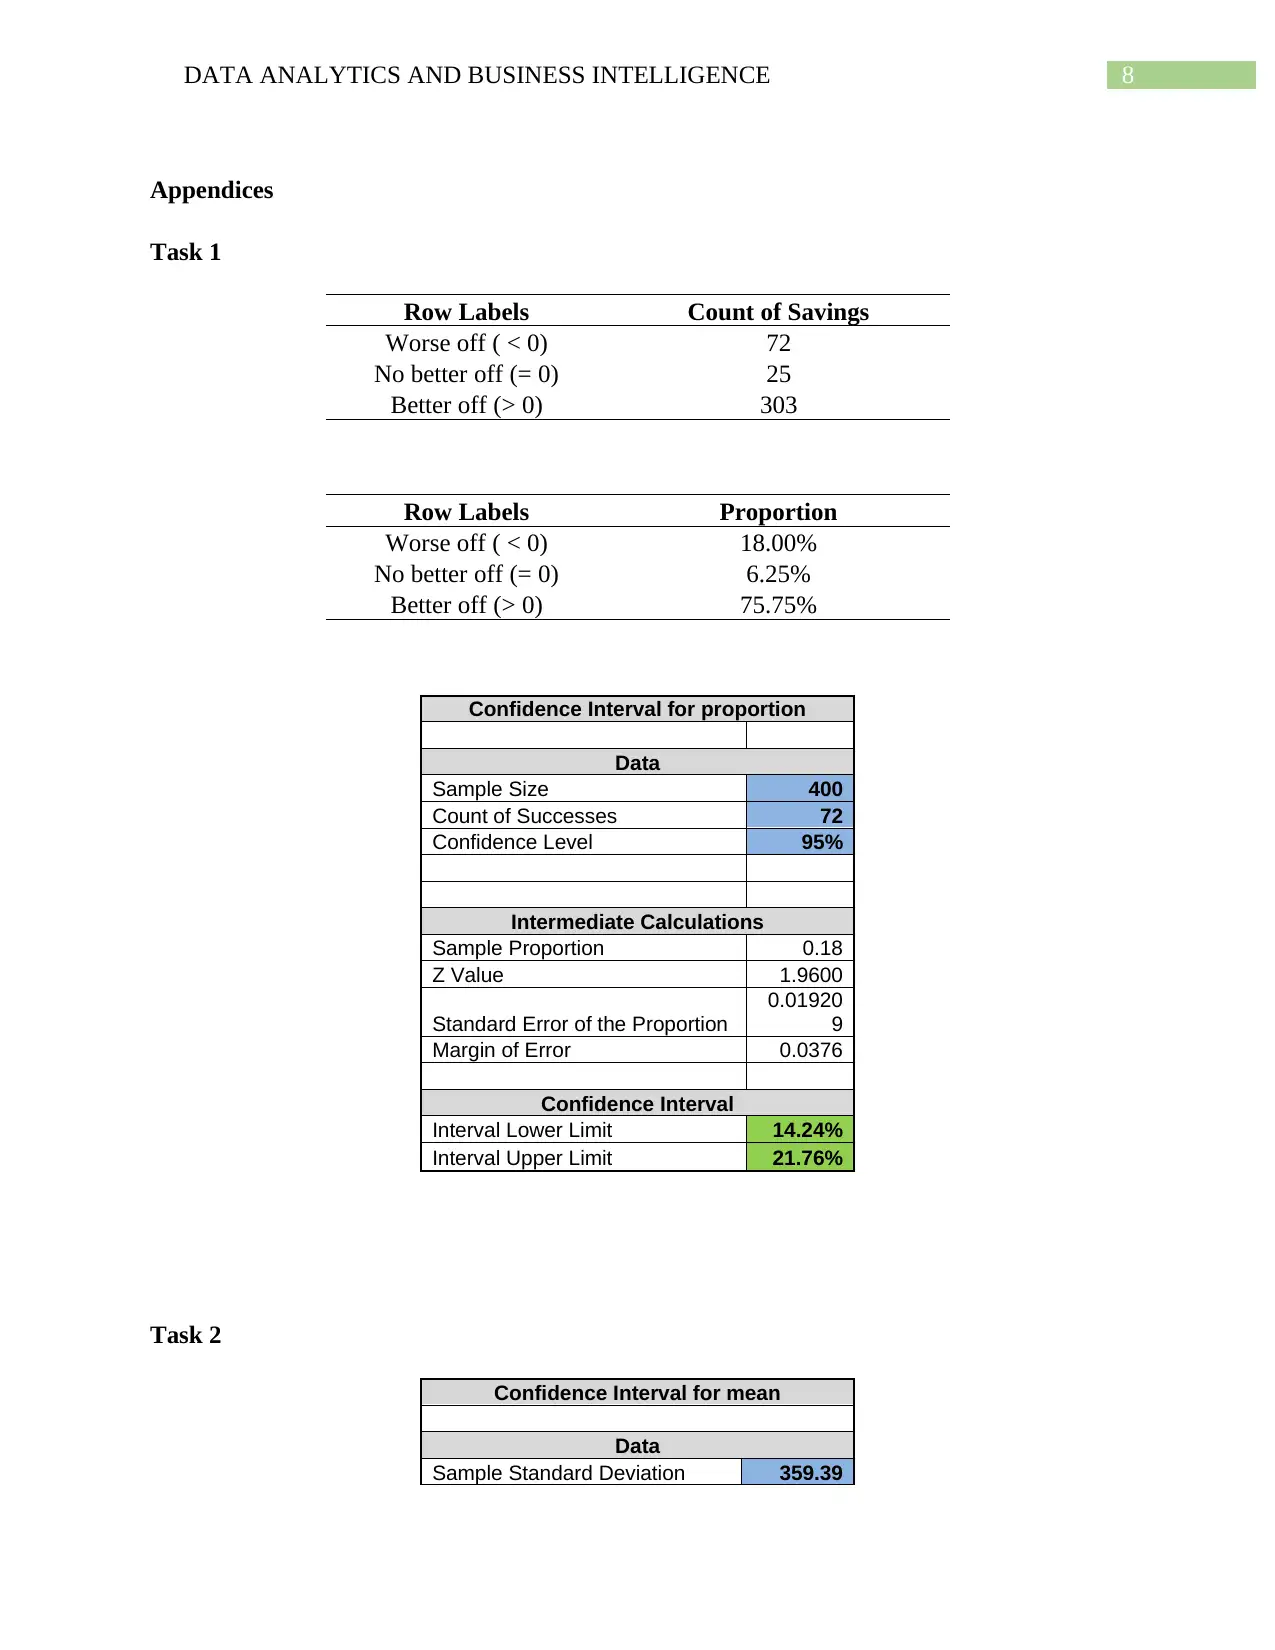
The analysis showed that the number of customers who paid less insurance amount in this year
than previous year is 72. Similarly, 25 customers paid insurance amount equal to last years.
Further, it was found that 303 customers paid more insurance amount than last years. Thus it was
estimated that the proportion of customers who were worse off is 18.00%. The estimate of
customers who are worse off ranges from 14.24% to 21.76%.
Average savings using a sports or luxury car
From the sample data it was found that of the 400 customers who were sampled 111 customers
had either a luxury car or a sports car. The average savings of all such customers is $589.5135
with a standard deviation of $359.39. From the analysis of the sampled data we can say with
95% confidence that the average savings of customers owning a luxury or sports car lies between
the range of $521.91 and $657.12.
To: Daniel Rand
From: Mercedes Knight
Subject: Analysis of car insurance brokerage services
Introduction
Dear, Daniel this is in response to your mail regarding car insurance brokers. We obtained a
sample data of 400 customers from the insurance brokers association. We present the analysis of
the information with reference to the savings made by customers who have taken the aid of
brokerage firms. The detailed analysis of the insurance savings was made possible since the data
contained information on gender, NCBR, valuation method, type of vehicle, broker’s and
satisfaction level of the customers.
Main Body
Customer’s worse off using a broker
The analysis showed that the number of customers who paid less insurance amount in this year
than previous year is 72. Similarly, 25 customers paid insurance amount equal to last years.
Further, it was found that 303 customers paid more insurance amount than last years. Thus it was
estimated that the proportion of customers who were worse off is 18.00%. The estimate of
customers who are worse off ranges from 14.24% to 21.76%.
Average savings using a sports or luxury car
From the sample data it was found that of the 400 customers who were sampled 111 customers
had either a luxury car or a sports car. The average savings of all such customers is $589.5135
with a standard deviation of $359.39. From the analysis of the sampled data we can say with
95% confidence that the average savings of customers owning a luxury or sports car lies between
the range of $521.91 and $657.12.
Paraphrase This Document
Need a fresh take? Get an instant paraphrase of this document with our AI Paraphraser
4DATA ANALYTICS AND BUSINESS INTELLIGENCE
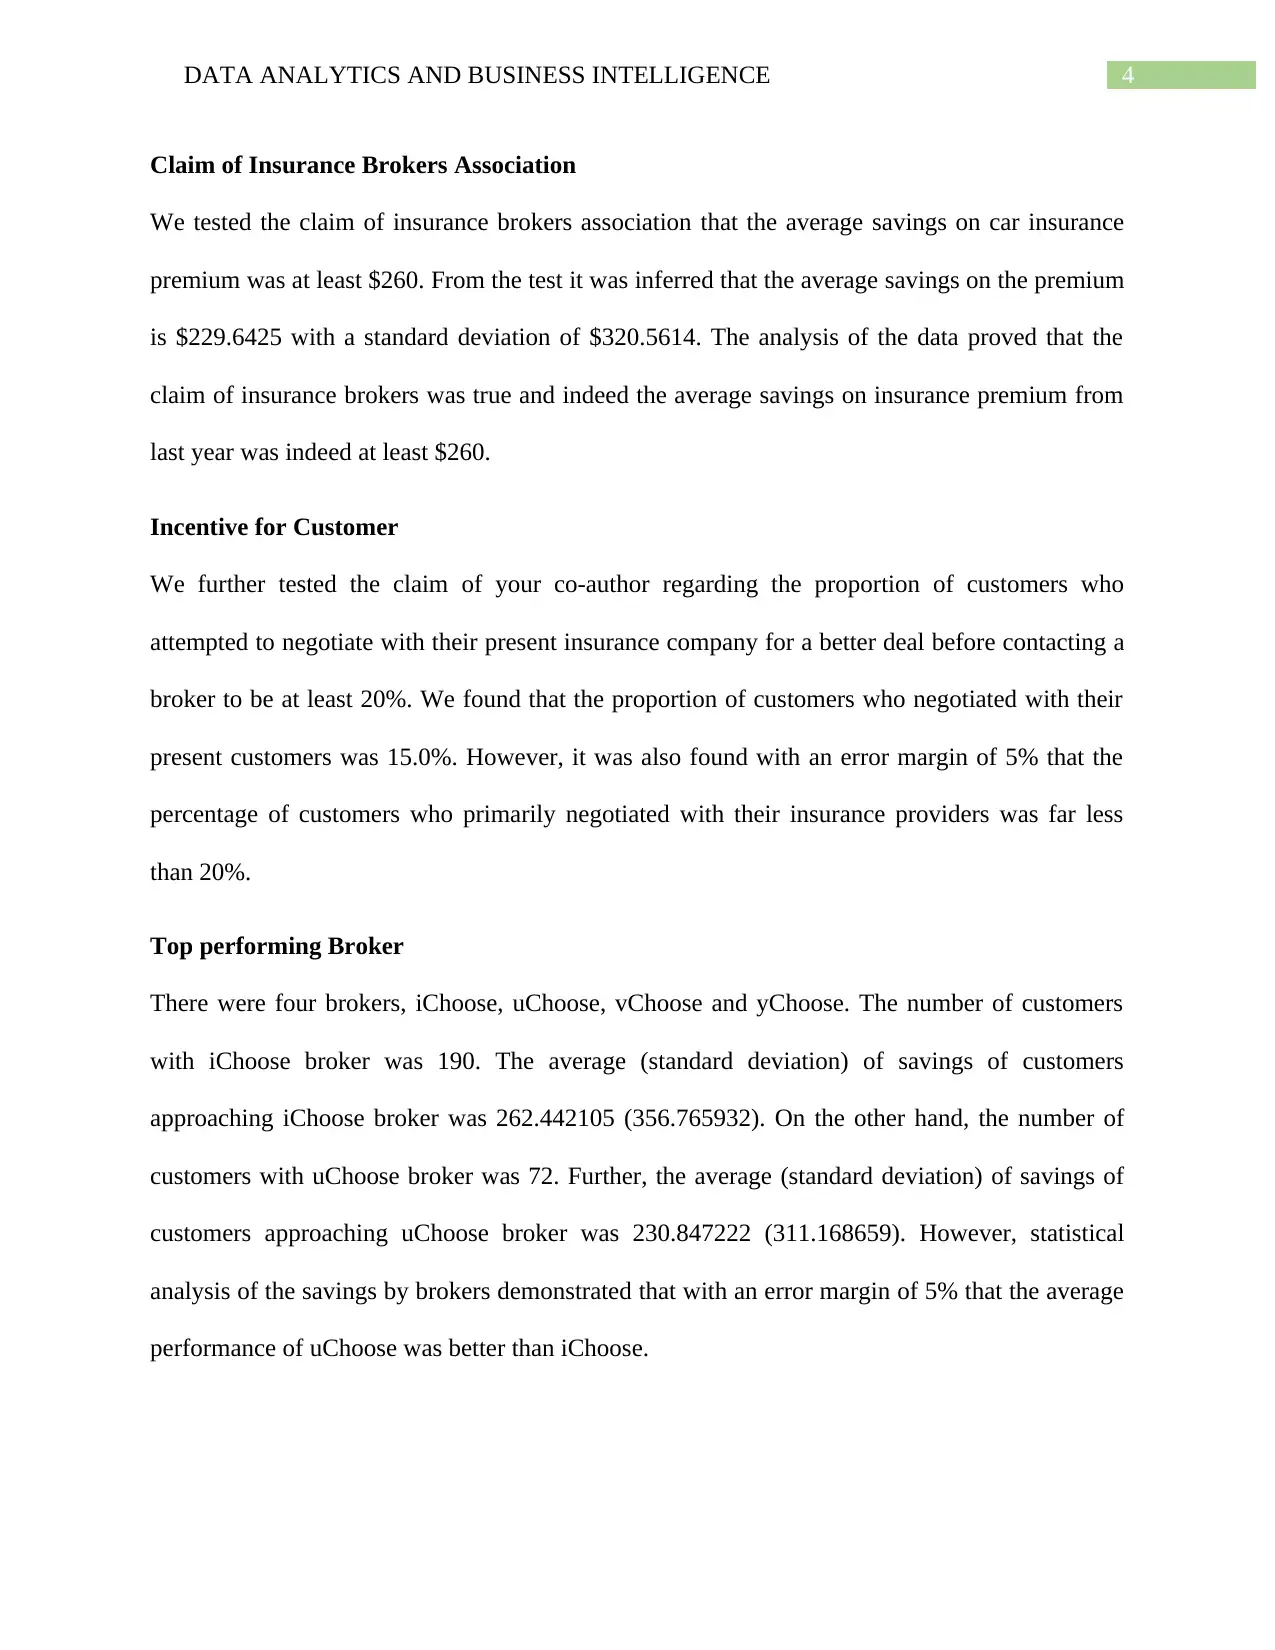
Claim of Insurance Brokers Association
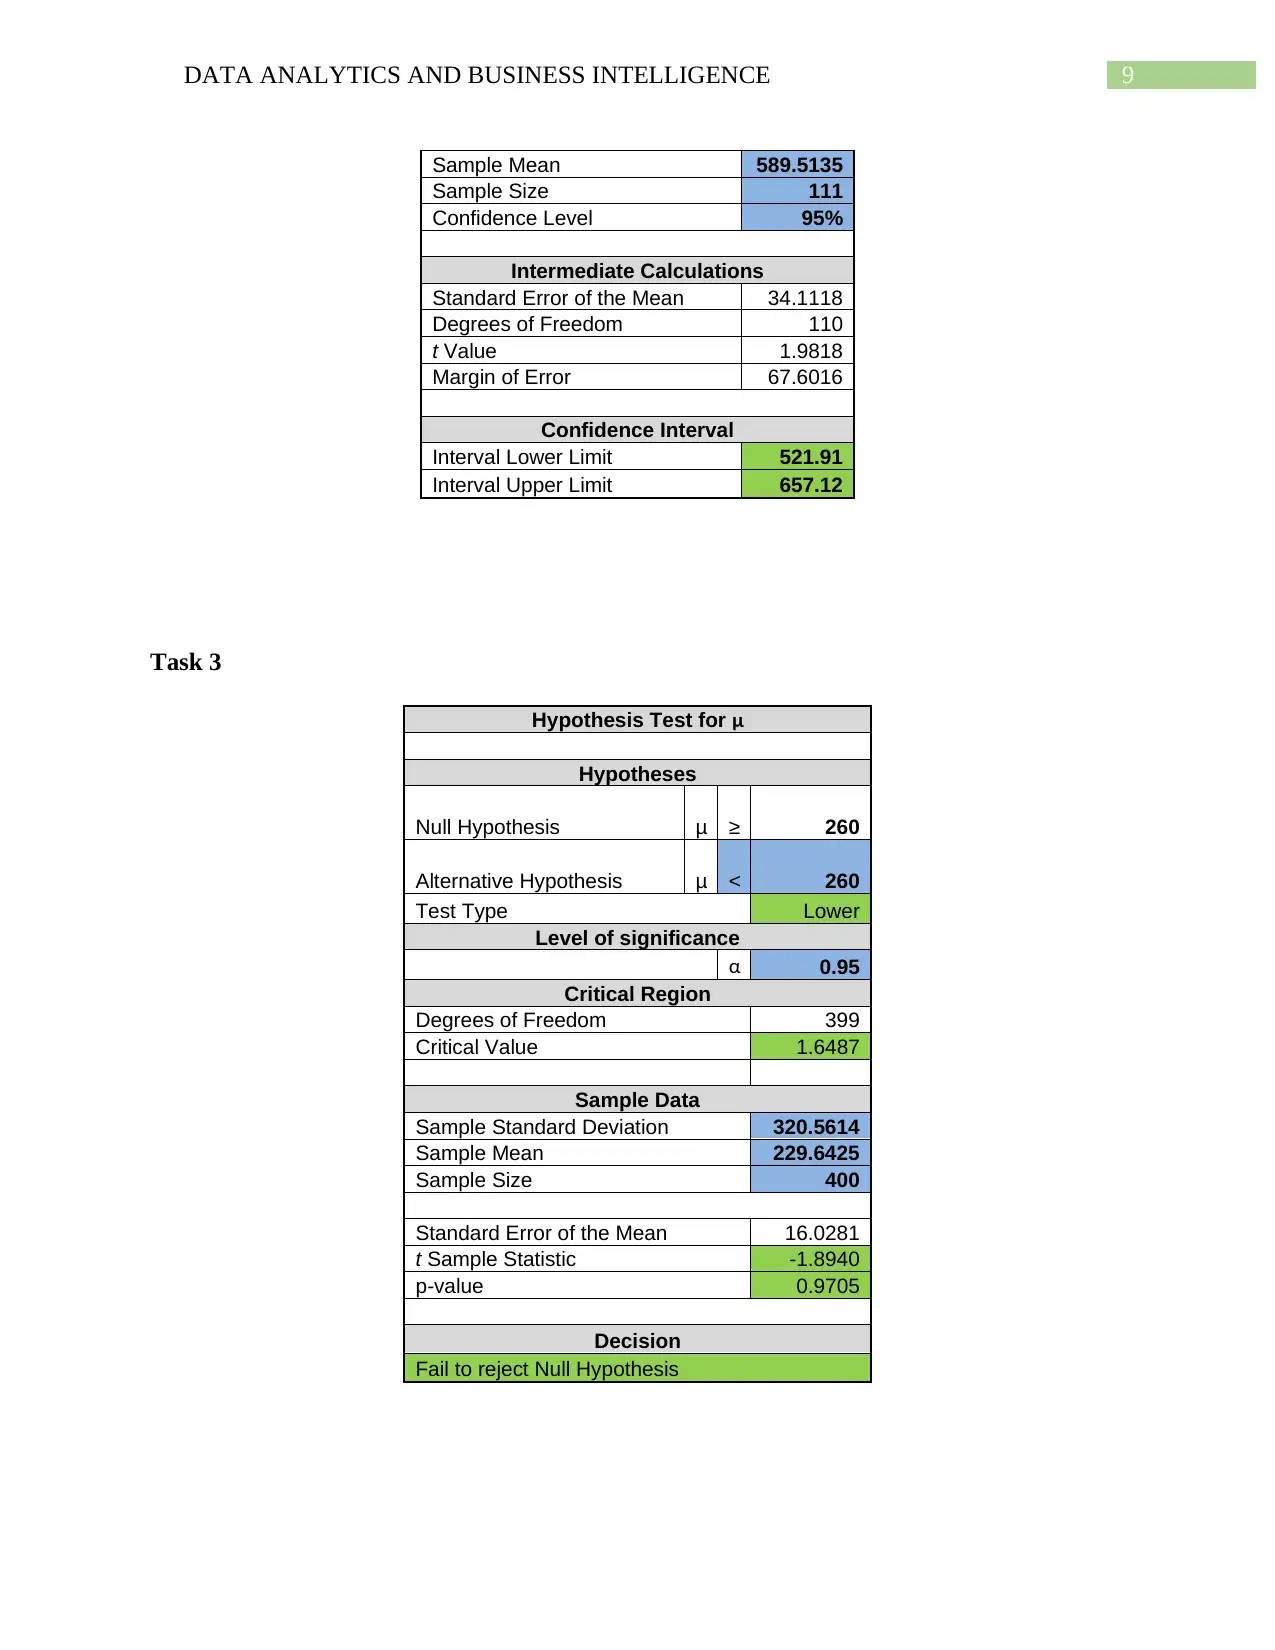
We tested the claim of insurance brokers association that the average savings on car insurance
premium was at least $260. From the test it was inferred that the average savings on the premium
is $229.6425 with a standard deviation of $320.5614. The analysis of the data proved that the
claim of insurance brokers was true and indeed the average savings on insurance premium from
last year was indeed at least $260.
Incentive for Customer
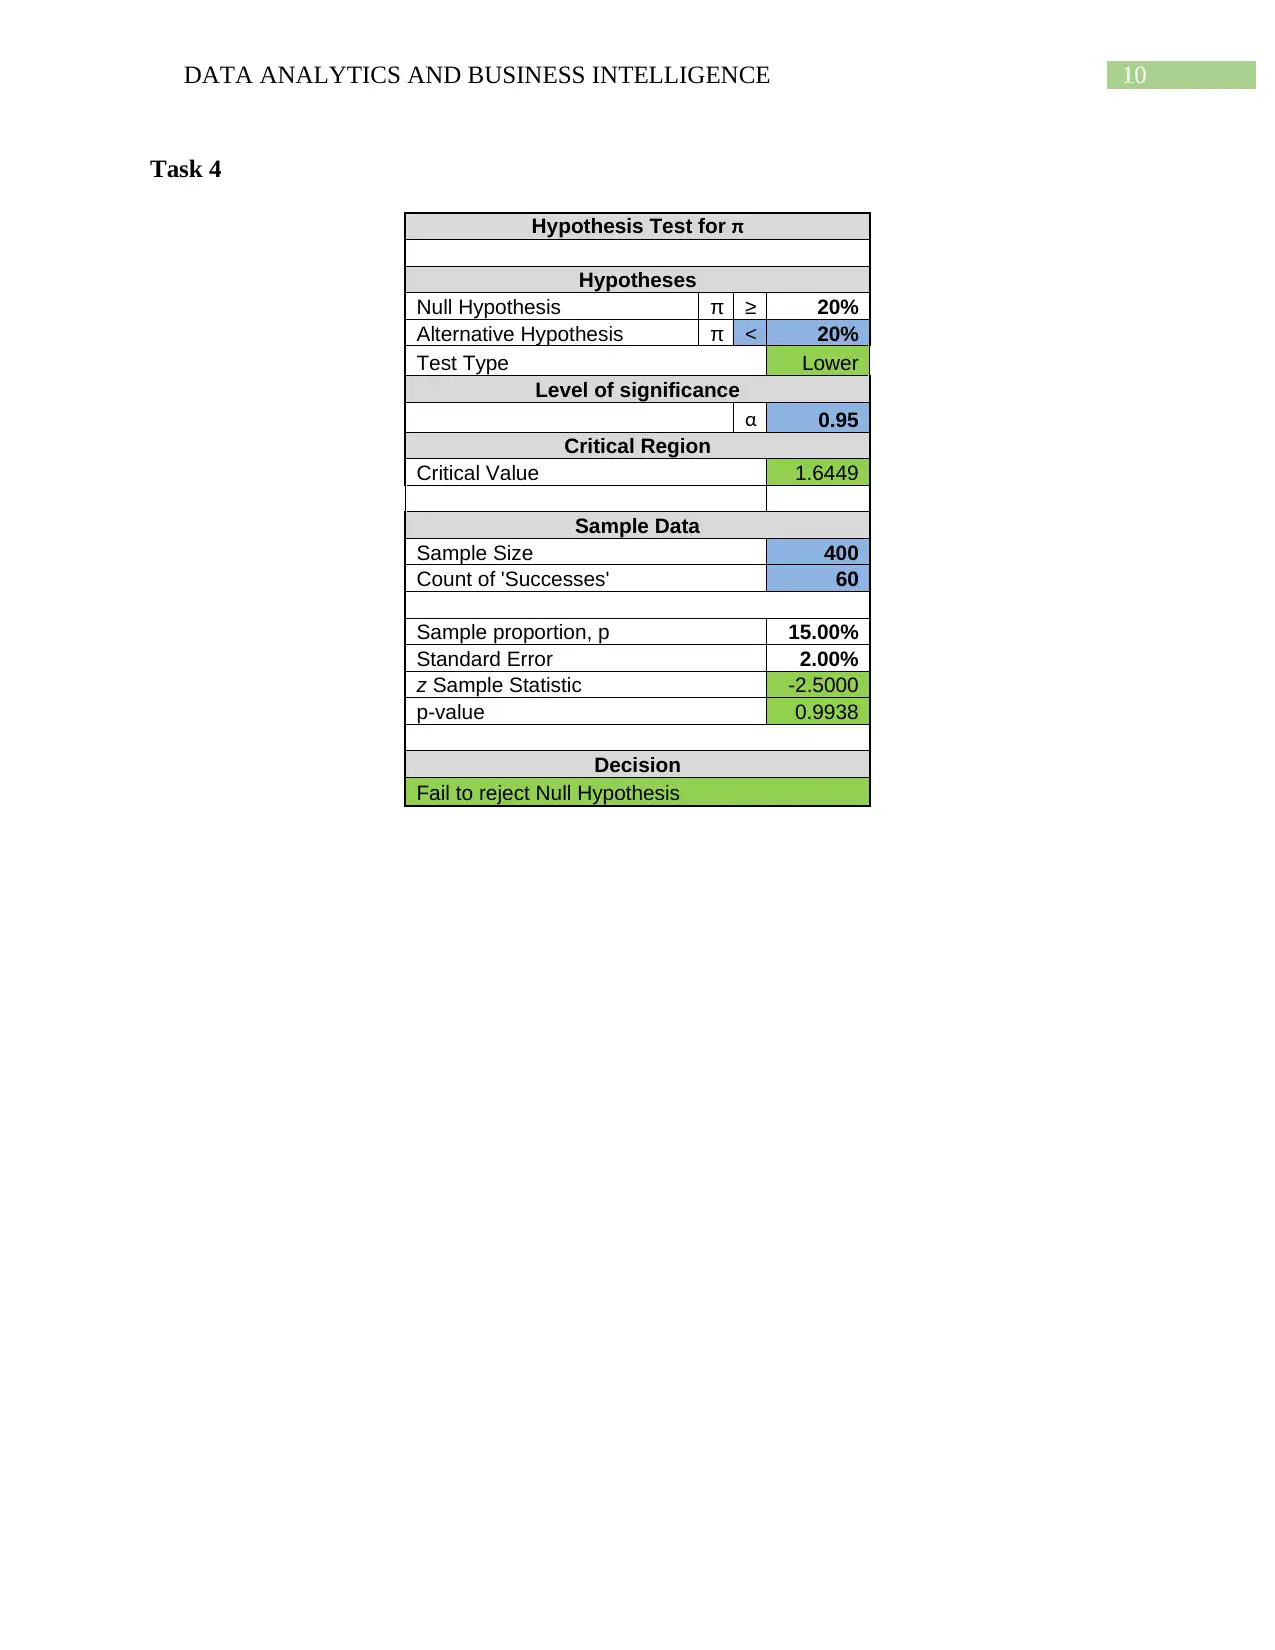
We further tested the claim of your co-author regarding the proportion of customers who
attempted to negotiate with their present insurance company for a better deal before contacting a
broker to be at least 20%. We found that the proportion of customers who negotiated with their
present customers was 15.0%. However, it was also found with an error margin of 5% that the
percentage of customers who primarily negotiated with their insurance providers was far less
than 20%.
Top performing Broker
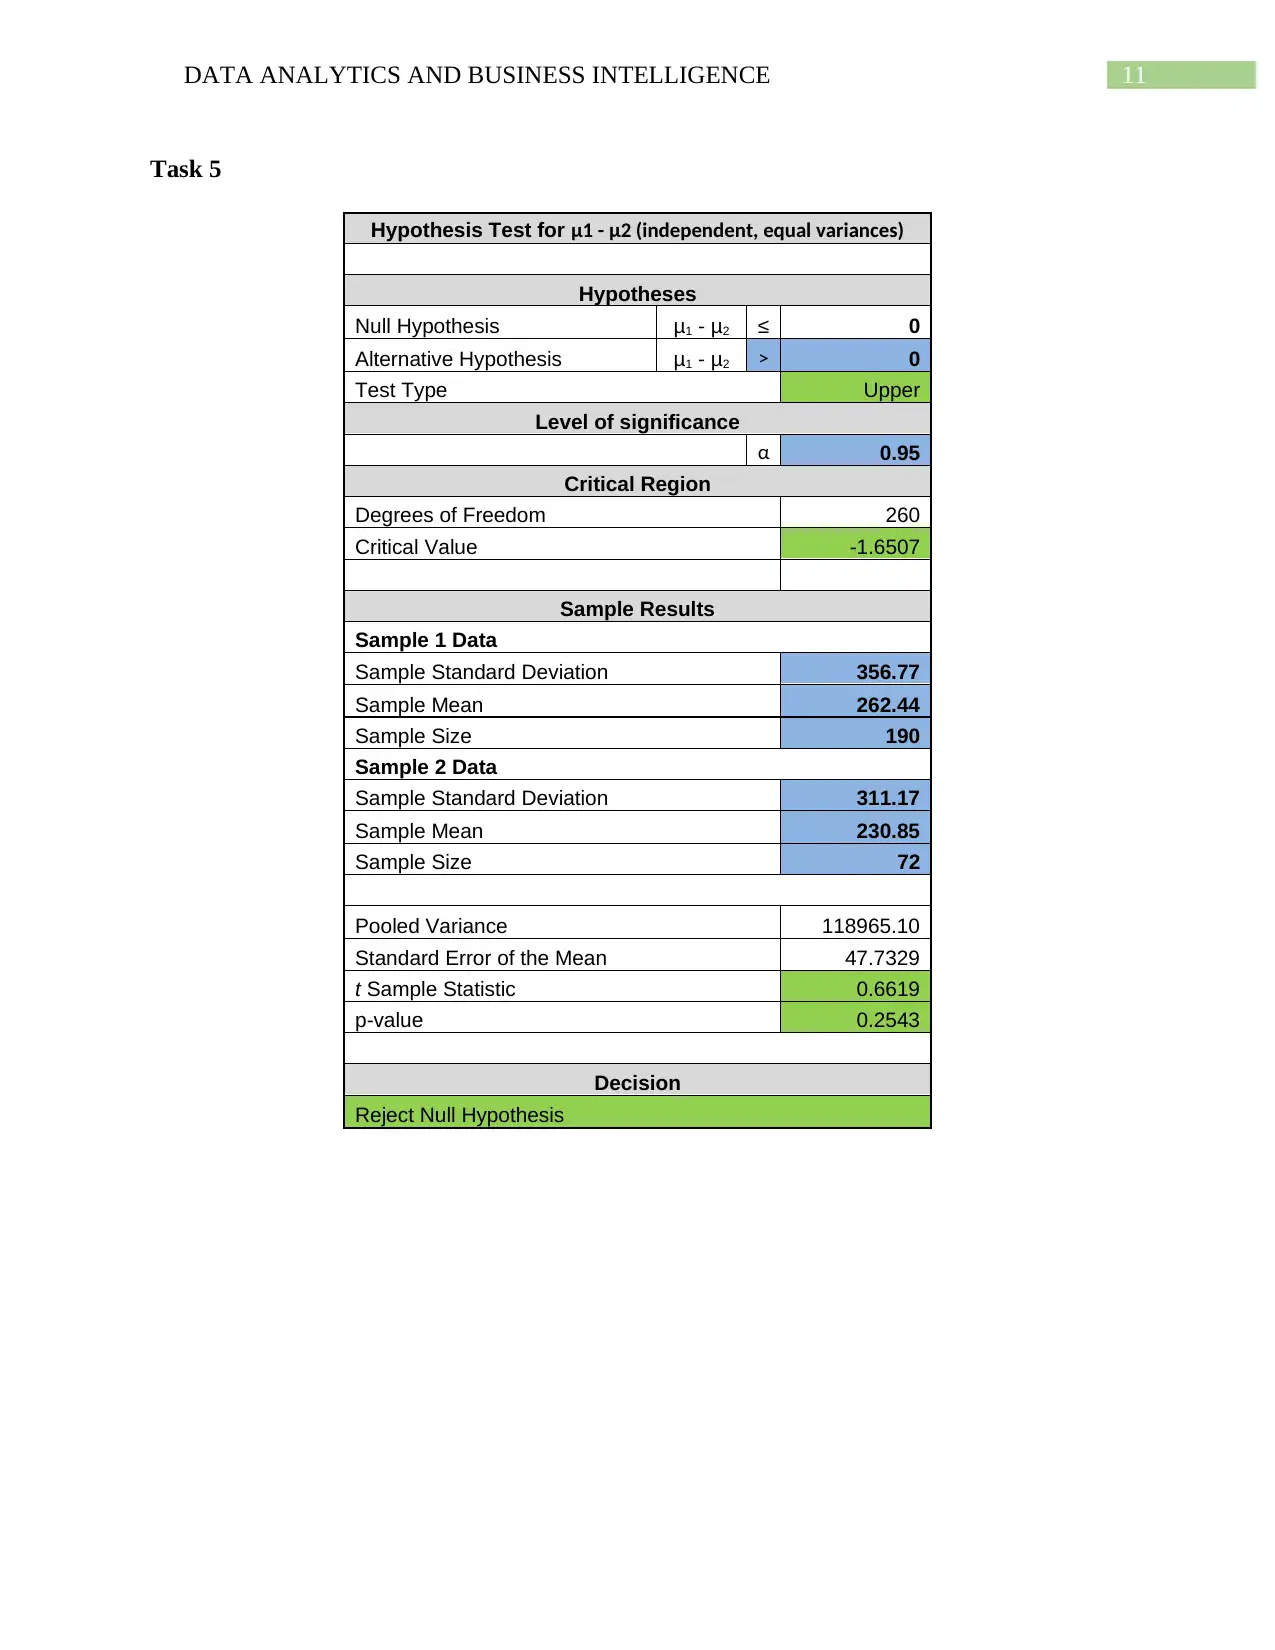
There were four brokers, iChoose, uChoose, vChoose and yChoose. The number of customers
with iChoose broker was 190. The average (standard deviation) of savings of customers
approaching iChoose broker was 262.442105 (356.765932). On the other hand, the number of
customers with uChoose broker was 72. Further, the average (standard deviation) of savings of
customers approaching uChoose broker was 230.847222 (311.168659). However, statistical
analysis of the savings by brokers demonstrated that with an error margin of 5% that the average
performance of uChoose was better than iChoose.
Claim of Insurance Brokers Association
We tested the claim of insurance brokers association that the average savings on car insurance
premium was at least $260. From the test it was inferred that the average savings on the premium
is $229.6425 with a standard deviation of $320.5614. The analysis of the data proved that the
claim of insurance brokers was true and indeed the average savings on insurance premium from
last year was indeed at least $260.
Incentive for Customer
We further tested the claim of your co-author regarding the proportion of customers who
attempted to negotiate with their present insurance company for a better deal before contacting a
broker to be at least 20%. We found that the proportion of customers who negotiated with their
present customers was 15.0%. However, it was also found with an error margin of 5% that the
percentage of customers who primarily negotiated with their insurance providers was far less
than 20%.
Top performing Broker
There were four brokers, iChoose, uChoose, vChoose and yChoose. The number of customers
with iChoose broker was 190. The average (standard deviation) of savings of customers
approaching iChoose broker was 262.442105 (356.765932). On the other hand, the number of
customers with uChoose broker was 72. Further, the average (standard deviation) of savings of
customers approaching uChoose broker was 230.847222 (311.168659). However, statistical
analysis of the savings by brokers demonstrated that with an error margin of 5% that the average
performance of uChoose was better than iChoose.
5DATA ANALYTICS AND BUSINESS INTELLIGENCE
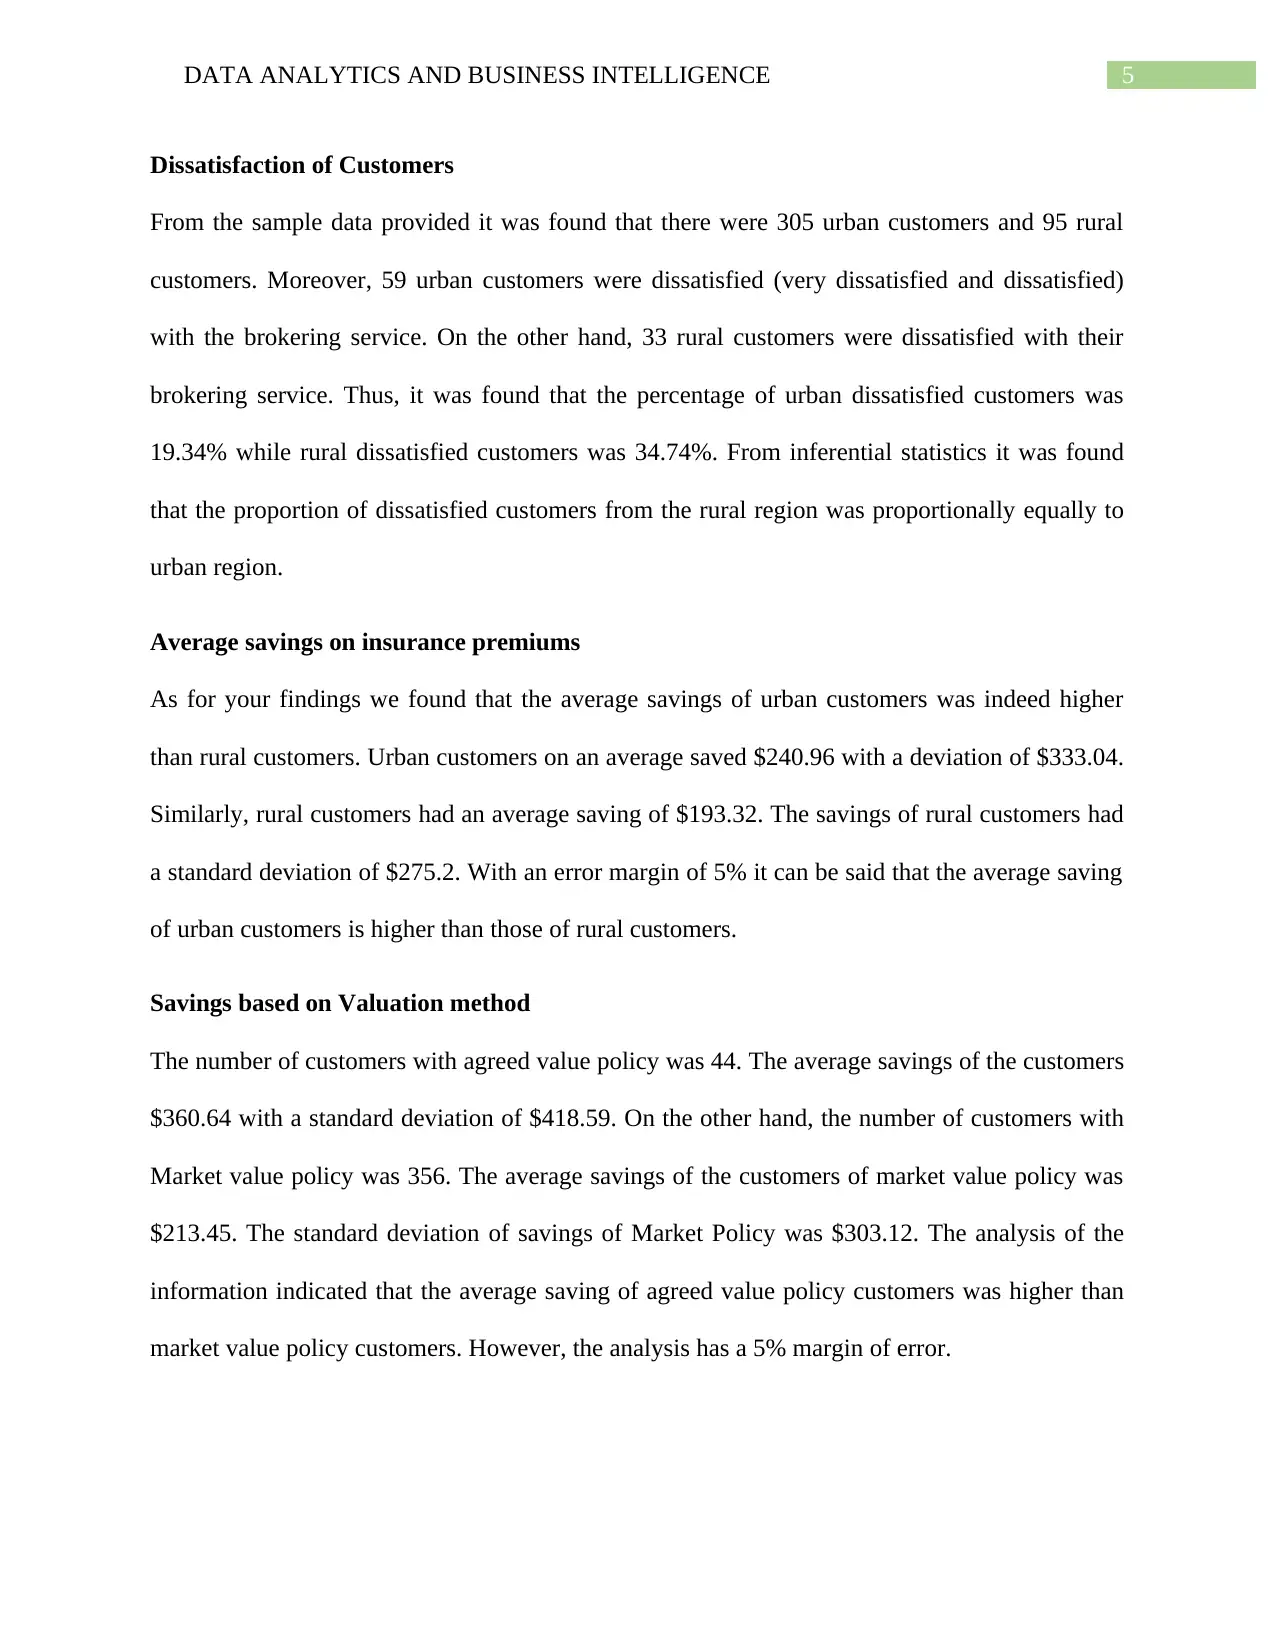
Dissatisfaction of Customers
From the sample data provided it was found that there were 305 urban customers and 95 rural
customers. Moreover, 59 urban customers were dissatisfied (very dissatisfied and dissatisfied)
with the brokering service. On the other hand, 33 rural customers were dissatisfied with their
brokering service. Thus, it was found that the percentage of urban dissatisfied customers was
19.34% while rural dissatisfied customers was 34.74%. From inferential statistics it was found
that the proportion of dissatisfied customers from the rural region was proportionally equally to
urban region.
Average savings on insurance premiums
As for your findings we found that the average savings of urban customers was indeed higher
than rural customers. Urban customers on an average saved $240.96 with a deviation of $333.04.
Similarly, rural customers had an average saving of $193.32. The savings of rural customers had
a standard deviation of $275.2. With an error margin of 5% it can be said that the average saving
of urban customers is higher than those of rural customers.
Savings based on Valuation method
The number of customers with agreed value policy was 44. The average savings of the customers
$360.64 with a standard deviation of $418.59. On the other hand, the number of customers with
Market value policy was 356. The average savings of the customers of market value policy was
$213.45. The standard deviation of savings of Market Policy was $303.12. The analysis of the
information indicated that the average saving of agreed value policy customers was higher than
market value policy customers. However, the analysis has a 5% margin of error.
⊘ This is a preview!⊘
Do you want full access?
Subscribe today to unlock all pages.
Trusted by 1+ million students worldwide
6DATA ANALYTICS AND BUSINESS INTELLIGENCE
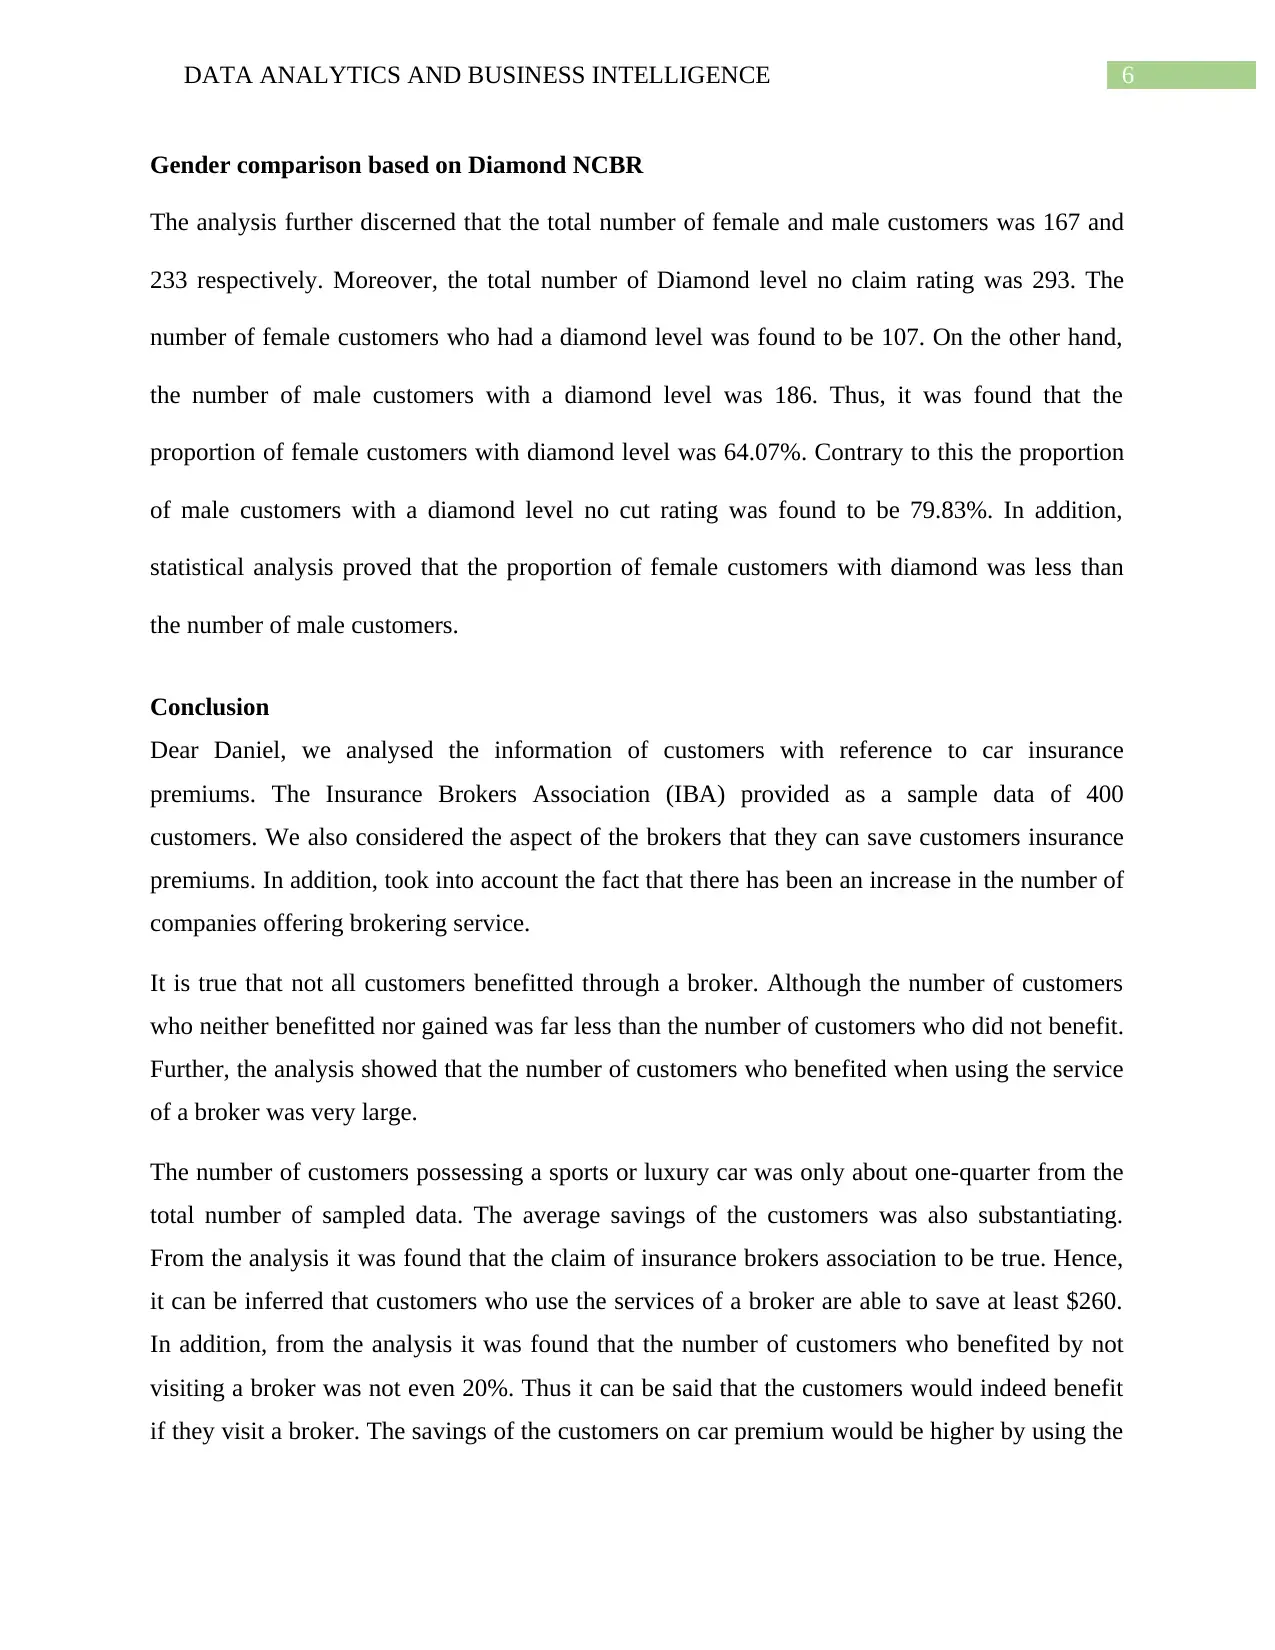
Gender comparison based on Diamond NCBR
The analysis further discerned that the total number of female and male customers was 167 and
233 respectively. Moreover, the total number of Diamond level no claim rating was 293. The
number of female customers who had a diamond level was found to be 107. On the other hand,
the number of male customers with a diamond level was 186. Thus, it was found that the
proportion of female customers with diamond level was 64.07%. Contrary to this the proportion
of male customers with a diamond level no cut rating was found to be 79.83%. In addition,
statistical analysis proved that the proportion of female customers with diamond was less than
the number of male customers.
Conclusion
Dear Daniel, we analysed the information of customers with reference to car insurance
premiums. The Insurance Brokers Association (IBA) provided as a sample data of 400
customers. We also considered the aspect of the brokers that they can save customers insurance
premiums. In addition, took into account the fact that there has been an increase in the number of
companies offering brokering service.
It is true that not all customers benefitted through a broker. Although the number of customers
who neither benefitted nor gained was far less than the number of customers who did not benefit.
Further, the analysis showed that the number of customers who benefited when using the service
of a broker was very large.
The number of customers possessing a sports or luxury car was only about one-quarter from the
total number of sampled data. The average savings of the customers was also substantiating.
From the analysis it was found that the claim of insurance brokers association to be true. Hence,
it can be inferred that customers who use the services of a broker are able to save at least $260.
In addition, from the analysis it was found that the number of customers who benefited by not
visiting a broker was not even 20%. Thus it can be said that the customers would indeed benefit
if they visit a broker. The savings of the customers on car premium would be higher by using the
Paraphrase This Document
Need a fresh take? Get an instant paraphrase of this document with our AI Paraphraser
7DATA ANALYTICS AND BUSINESS INTELLIGENCE
services of a broker. Further, we have analysed the services of 4 brokers. It was found that
savings made by the customers from broker uChoose was very high.
The investigation into the percentage of dissatisfied customers was found to be equal from both
rural and urban regions. Moreover, it was found that the average savings of urban customers was
higher than rural customers. Thus, we can say that rural customers should visit better brokers
who can offer more savings to their customers.
From the analysis of the data it can be said that the customers should agree to agree value policy
since it gives them more benefit as compared to market value policy. Moreover, it was found that
proportion of female customers was less than male customers with diamond NCBR.
In the end, we can say that customers indeed benefited through the services of a Broker.
8DATA ANALYTICS AND BUSINESS INTELLIGENCE
Appendices
Task 1
Row Labels Count of Savings
Worse off ( < 0) 72
No better off (= 0) 25
Better off (> 0) 303
Row Labels Proportion
Worse off ( < 0) 18.00%
No better off (= 0) 6.25%
Better off (> 0) 75.75%
Confidence Interval for proportion
Data
Sample Size 400
Count of Successes 72
Confidence Level 95%
Intermediate Calculations
Sample Proportion 0.18
Z Value 1.9600
Standard Error of the Proportion
0.01920
9
Margin of Error 0.0376
Confidence Interval
Interval Lower Limit 14.24%
Interval Upper Limit 21.76%
Task 2
Confidence Interval for mean
Data
Sample Standard Deviation 359.39
⊘ This is a preview!⊘
Do you want full access?
Subscribe today to unlock all pages.
Trusted by 1+ million students worldwide
9DATA ANALYTICS AND BUSINESS INTELLIGENCE
Sample Mean 589.5135
Sample Size 111
Confidence Level 95%
Intermediate Calculations
Standard Error of the Mean 34.1118
Degrees of Freedom 110
t Value 1.9818
Margin of Error 67.6016
Confidence Interval
Interval Lower Limit 521.91
Interval Upper Limit 657.12
Task 3
Hypothesis Test for μ
Hypotheses
Null Hypothesis μ ≥ 260
Alternative Hypothesis μ < 260
Test Type Lower
Level of significance
α 0.95
Critical Region
Degrees of Freedom 399
Critical Value 1.6487
Sample Data
Sample Standard Deviation 320.5614
Sample Mean 229.6425
Sample Size 400
Standard Error of the Mean 16.0281
t Sample Statistic -1.8940
p-value 0.9705
Decision
Fail to reject Null Hypothesis
Paraphrase This Document
Need a fresh take? Get an instant paraphrase of this document with our AI Paraphraser
10DATA ANALYTICS AND BUSINESS INTELLIGENCE
Task 4
Hypothesis Test for π
Hypotheses
Null Hypothesis π ≥ 20%
Alternative Hypothesis π < 20%
Test Type Lower
Level of significance
α 0.95
Critical Region
Critical Value 1.6449
Sample Data
Sample Size 400
Count of 'Successes' 60
Sample proportion, p 15.00%
Standard Error 2.00%
z Sample Statistic -2.5000
p-value 0.9938
Decision
Fail to reject Null Hypothesis
11DATA ANALYTICS AND BUSINESS INTELLIGENCE
Task 5
Hypothesis Test for μ1 - μ2 (independent, equal variances)
Hypotheses
Null Hypothesis μ1 - μ2 ≤ 0
Alternative Hypothesis μ1 - μ2 > 0
Test Type Upper
Level of significance
α 0.95
Critical Region
Degrees of Freedom 260
Critical Value -1.6507
Sample Results
Sample 1 Data
Sample Standard Deviation 356.77
Sample Mean 262.44
Sample Size 190
Sample 2 Data
Sample Standard Deviation 311.17
Sample Mean 230.85
Sample Size 72
Pooled Variance 118965.10
Standard Error of the Mean 47.7329
t Sample Statistic 0.6619
p-value 0.2543
Decision
Reject Null Hypothesis
⊘ This is a preview!⊘
Do you want full access?
Subscribe today to unlock all pages.
Trusted by 1+ million students worldwide
1 out of 16
Related Documents


Your All-in-One AI-Powered Toolkit for Academic Success.
+13062052269
info@desklib.com
Available 24*7 on WhatsApp / Email
![[object Object]](/_next/static/media/star-bottom.7253800d.svg)
Unlock your academic potential
Copyright © 2020–2026 A2Z Services. All Rights Reserved. Developed and managed by ZUCOL.