Data & IT Assignment: Using Numeracy, Data and IT FP Contents - Task
VerifiedAdded on 2023/06/18
|22
|3859
|152
Practical Assignment
AI Summary
This assignment focuses on numeracy, data analysis, and IT skills, encompassing mathematical proficiency, data interpretation, and spreadsheet application. Part 1 involves basic numerical operations, fractions, percentages, and problem-solving. Part 2 analyzes Olympic Games medal data, calculating ranges, modes, and comparisons between countries. It also discusses factors affecting a nation's performance. Part 3 demonstrates Microsoft Office skills, including creating and formatting tables and charts in Excel. The assignment includes tasks such as ranking countries by medal count and highlighting data, showcasing practical application of data analysis techniques. Desklib offers a wealth of similar assignments and study resources for students.
Using numeracy data
and IT FP
and IT FP
Paraphrase This Document
Need a fresh take? Get an instant paraphrase of this document with our AI Paraphraser
Contents
Contents...........................................................................................................................................2
INTRODUCTION...........................................................................................................................3
Part 1................................................................................................................................................3
Question 1....................................................................................................................................3
Question 2....................................................................................................................................4
Question 3....................................................................................................................................4
Question 4....................................................................................................................................4
Question 5....................................................................................................................................5
Question 6....................................................................................................................................5
Question 7....................................................................................................................................6
Question 8....................................................................................................................................6
Question 9....................................................................................................................................6
Question 10..................................................................................................................................7
Part 2................................................................................................................................................7
Part 3..............................................................................................................................................10
Question 13................................................................................................................................12
Question 14................................................................................................................................13
Question 15................................................................................................................................14
Question 16..................................................................................................................................1
Olympic Games Medal Table..........................................................................................................2
Olympic Games Medal Tables........................................................................................................3
Conclusion.......................................................................................................................................4
References........................................................................................................................................5
INTRODUCTION
Math proficiency is defined as the capacity to think and implement precise mathematical
principles, and proficiency is characterized as the capacity to calculate and analyse the offered
mathematics and IT information (Al-Qirim, Tarhini and Rouibah, 2017). Understanding essential
mathematical processes like divisions, multiplying, adding, and subtracting is part of core
mathematical skills. Individuals need arithmetic to acquire rational thought and cognitive
abilities in their daily actions. For tasks such as eating, following directions, analyzing invoices,
and participating in sports, the notion of arithmetic is necessary continue providing solutions to
issues and also making knowledge of mathematics, trends, timing, and forms. It was discovered
that perhaps the notion of reading and mathematics allows people to learn the core abilities they
need to succeed in existence. There is a broad strategy to improving reading and mathematics
skills and also assisting learners in order to live a happy and gratifying existence and
participating as an engaged and well-informed citizen. This arithmetic repertoire is divided into
three primary activities, each of which would be completed one by one.
Part 1
Question 1
Math proficiency, as previously mentioned, is defined as the capacity to analyze and
applying the basic mathematical principles. Understanding essential numerical calculations such
as divisions, multiplying, adding, and subtracting is required for essential mathematical skills.
The numerator and denominator concepts would be covered further down-
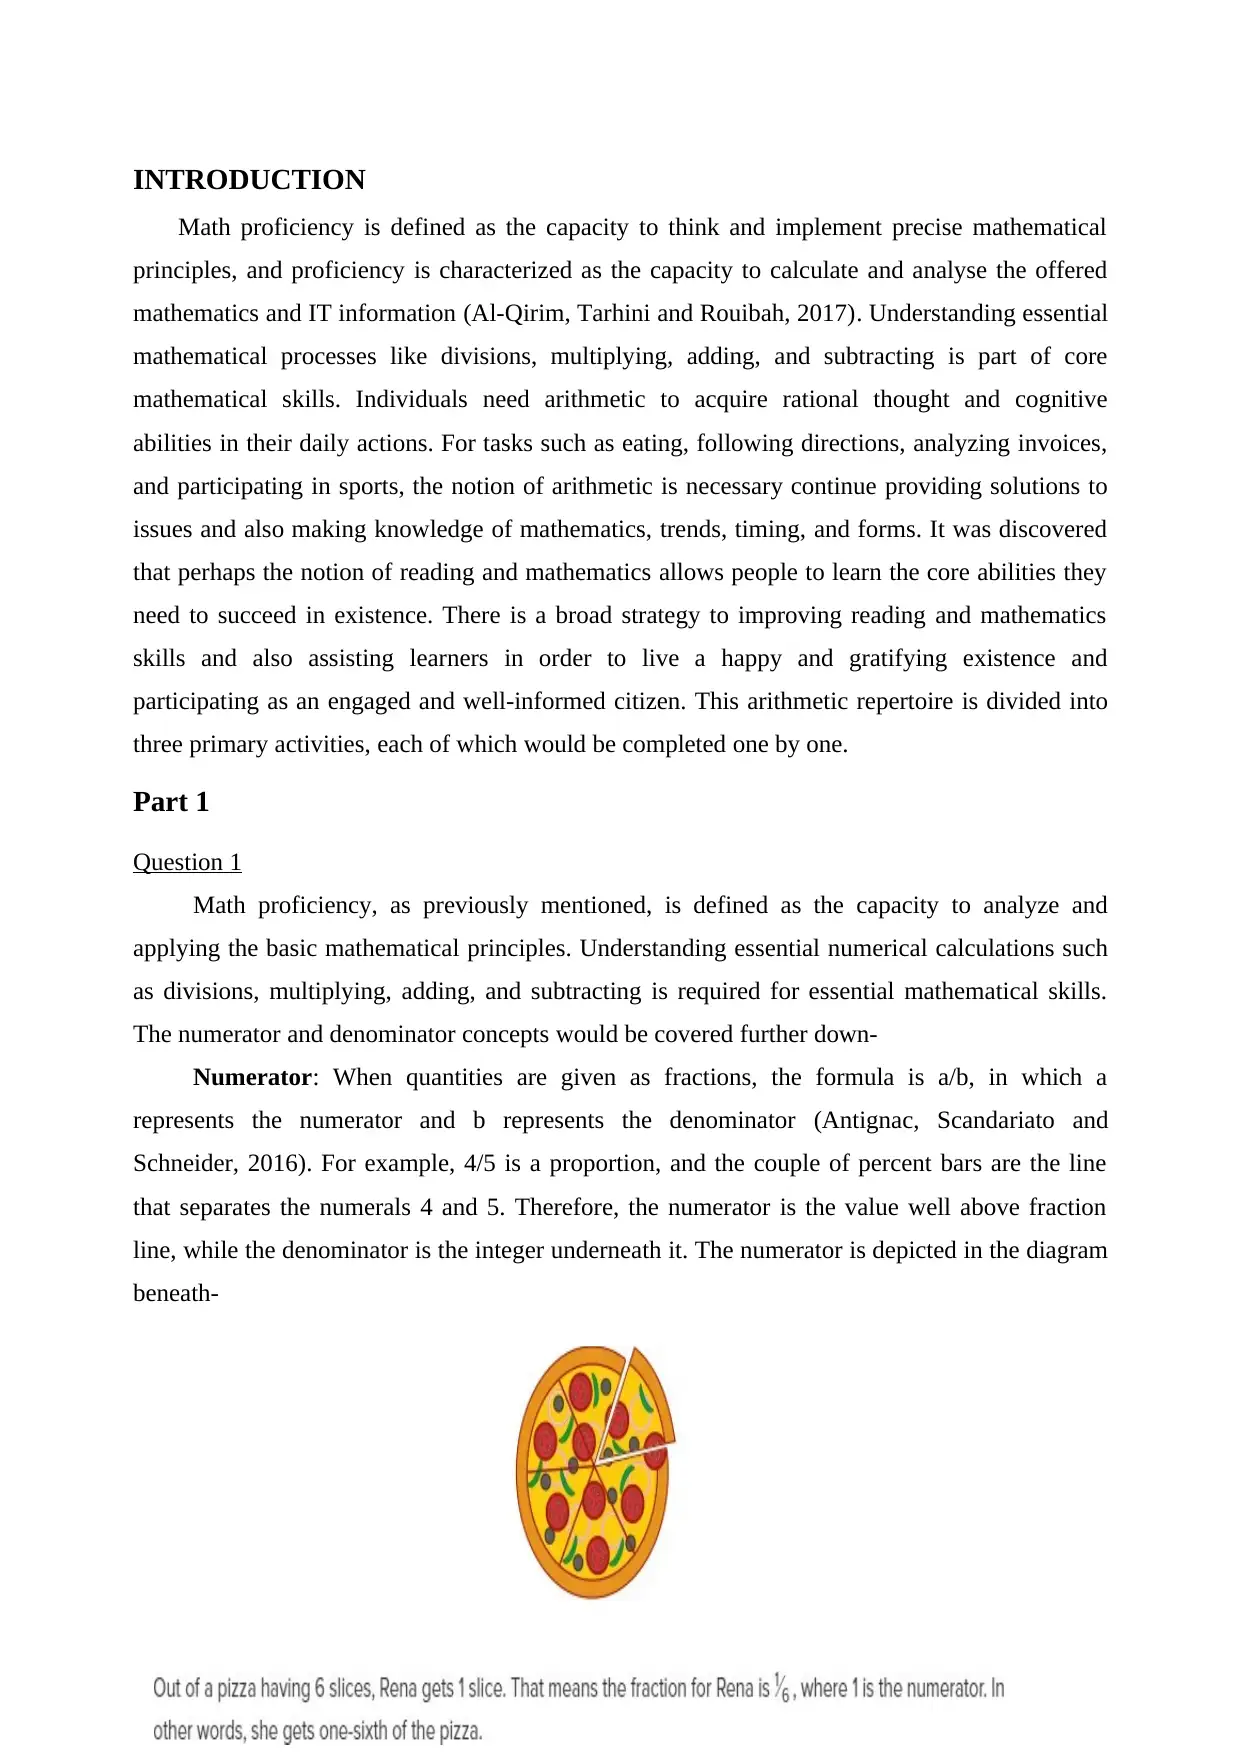
Numerator: When quantities are given as fractions, the formula is a/b, in which a
represents the numerator and b represents the denominator (Antignac, Scandariato and
Schneider, 2016). For example, 4/5 is a proportion, and the couple of percent bars are the line
that separates the numerals 4 and 5. Therefore, the numerator is the value well above fraction
line, while the denominator is the integer underneath it. The numerator is depicted in the diagram
beneath-
Math proficiency is defined as the capacity to think and implement precise mathematical
principles, and proficiency is characterized as the capacity to calculate and analyse the offered
mathematics and IT information (Al-Qirim, Tarhini and Rouibah, 2017). Understanding essential
mathematical processes like divisions, multiplying, adding, and subtracting is part of core
mathematical skills. Individuals need arithmetic to acquire rational thought and cognitive
abilities in their daily actions. For tasks such as eating, following directions, analyzing invoices,
and participating in sports, the notion of arithmetic is necessary continue providing solutions to
issues and also making knowledge of mathematics, trends, timing, and forms. It was discovered
that perhaps the notion of reading and mathematics allows people to learn the core abilities they
need to succeed in existence. There is a broad strategy to improving reading and mathematics
skills and also assisting learners in order to live a happy and gratifying existence and
participating as an engaged and well-informed citizen. This arithmetic repertoire is divided into
three primary activities, each of which would be completed one by one.
Part 1
Question 1
Math proficiency, as previously mentioned, is defined as the capacity to analyze and
applying the basic mathematical principles. Understanding essential numerical calculations such
as divisions, multiplying, adding, and subtracting is required for essential mathematical skills.
The numerator and denominator concepts would be covered further down-
Numerator: When quantities are given as fractions, the formula is a/b, in which a
represents the numerator and b represents the denominator (Antignac, Scandariato and
Schneider, 2016). For example, 4/5 is a proportion, and the couple of percent bars are the line
that separates the numerals 4 and 5. Therefore, the numerator is the value well above fraction
line, while the denominator is the integer underneath it. The numerator is depicted in the diagram
beneath-
⊘ This is a preview!⊘
Do you want full access?
Subscribe today to unlock all pages.
Trusted by 1+ million students worldwide
Denominator: The denominator is the lowest integer in a proportion which represents the
quantity of equivalent pieces separated into a thing (Berg and Carlsson, 2019).
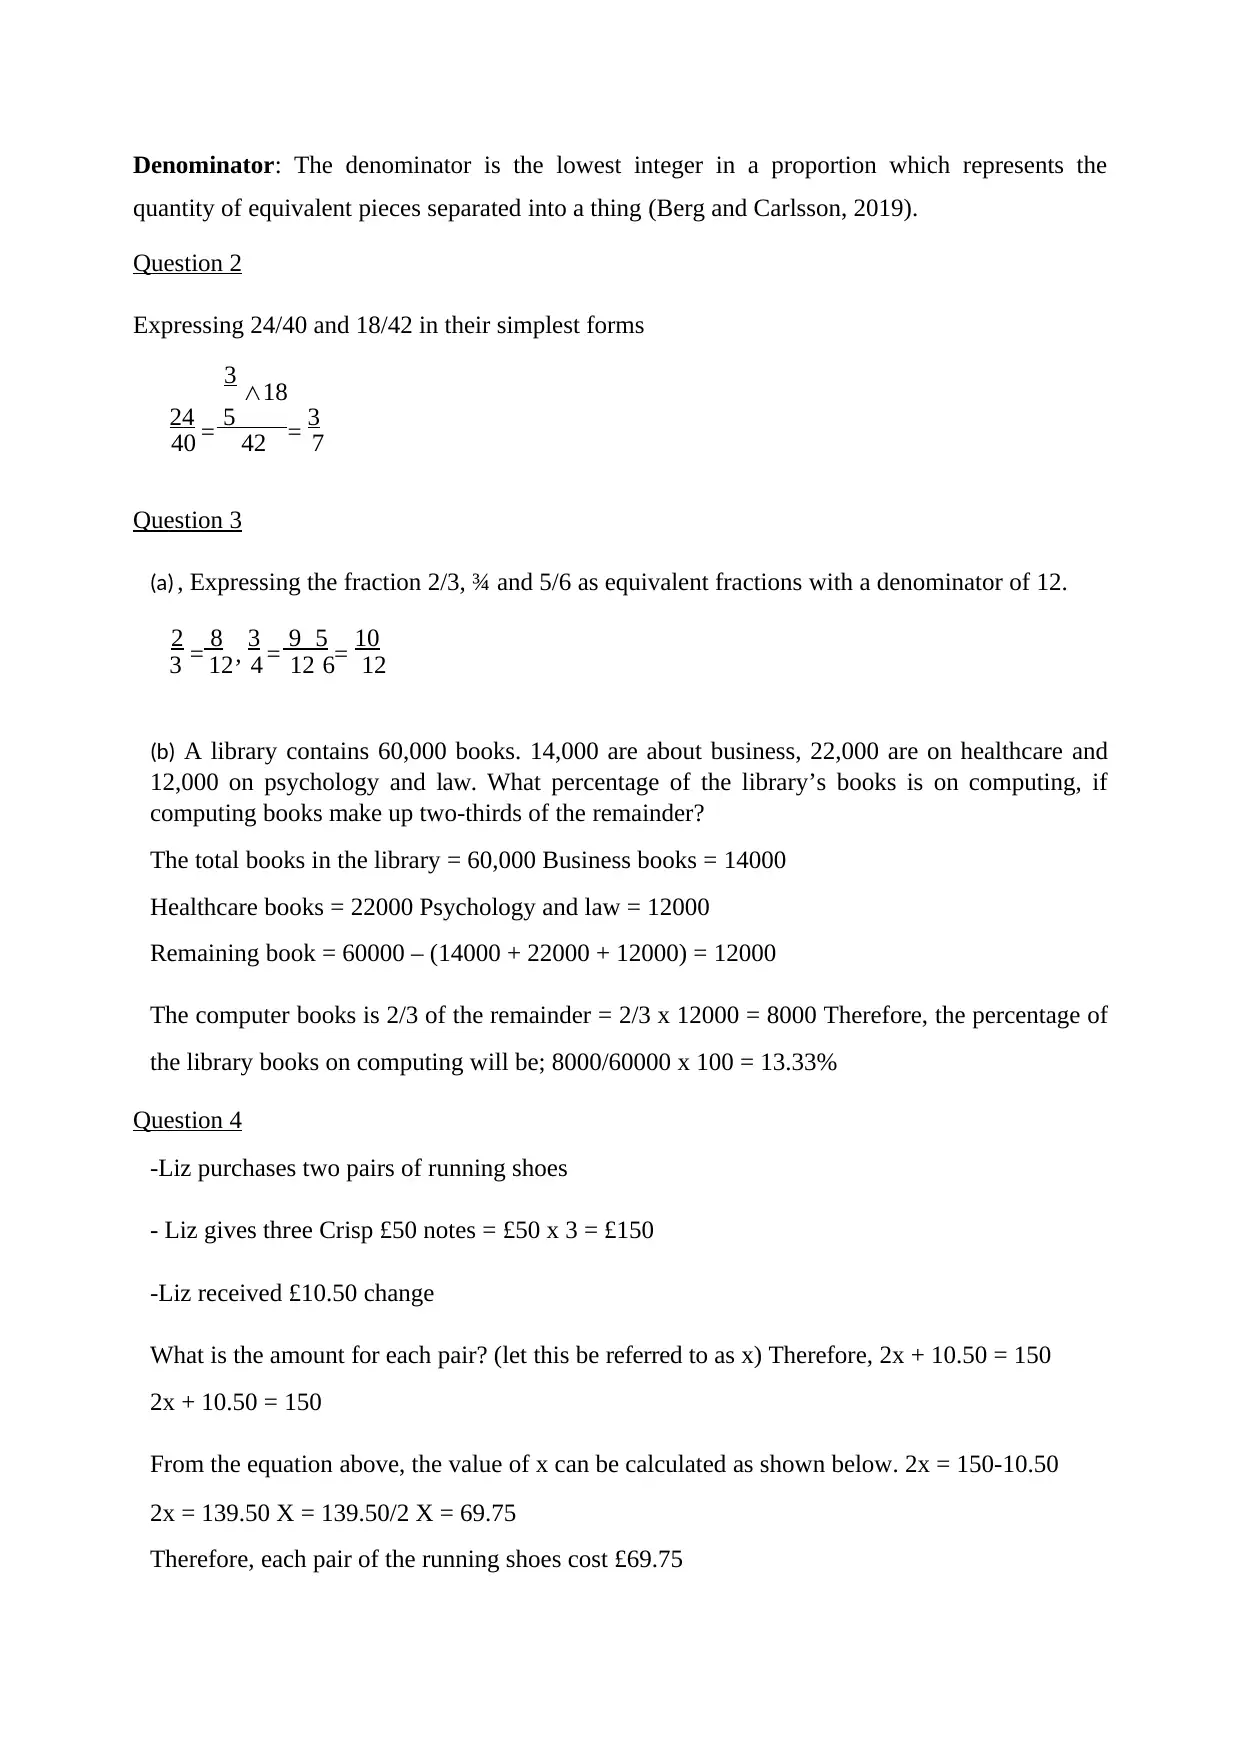
Question 2
Expressing 24/40 and 18/42 in their simplest forms
3 ∧18
24 = 5 = 3
40 42 7
Question 3
(a) , Expressing the fraction 2/3, ¾ and 5/6 as equivalent fractions with a denominator of 12.
2 = 8 , 3 = 9 5 = 10
3 12 4 12 6 12
(b) A library contains 60,000 books. 14,000 are about business, 22,000 are on healthcare and
12,000 on psychology and law. What percentage of the library’s books is on computing, if
computing books make up two-thirds of the remainder?
The total books in the library = 60,000 Business books = 14000
Healthcare books = 22000 Psychology and law = 12000
Remaining book = 60000 – (14000 + 22000 + 12000) = 12000
The computer books is 2/3 of the remainder = 2/3 x 12000 = 8000 Therefore, the percentage of
the library books on computing will be; 8000/60000 x 100 = 13.33%
Question 4
-Liz purchases two pairs of running shoes
- Liz gives three Crisp £50 notes = £50 x 3 = £150
-Liz received £10.50 change
What is the amount for each pair? (let this be referred to as x) Therefore, 2x + 10.50 = 150
2x + 10.50 = 150
From the equation above, the value of x can be calculated as shown below. 2x = 150-10.50
2x = 139.50 X = 139.50/2 X = 69.75
Therefore, each pair of the running shoes cost £69.75
quantity of equivalent pieces separated into a thing (Berg and Carlsson, 2019).
Question 2
Expressing 24/40 and 18/42 in their simplest forms
3 ∧18
24 = 5 = 3
40 42 7
Question 3
(a) , Expressing the fraction 2/3, ¾ and 5/6 as equivalent fractions with a denominator of 12.
2 = 8 , 3 = 9 5 = 10
3 12 4 12 6 12
(b) A library contains 60,000 books. 14,000 are about business, 22,000 are on healthcare and
12,000 on psychology and law. What percentage of the library’s books is on computing, if
computing books make up two-thirds of the remainder?
The total books in the library = 60,000 Business books = 14000
Healthcare books = 22000 Psychology and law = 12000
Remaining book = 60000 – (14000 + 22000 + 12000) = 12000
The computer books is 2/3 of the remainder = 2/3 x 12000 = 8000 Therefore, the percentage of
the library books on computing will be; 8000/60000 x 100 = 13.33%
Question 4
-Liz purchases two pairs of running shoes
- Liz gives three Crisp £50 notes = £50 x 3 = £150
-Liz received £10.50 change
What is the amount for each pair? (let this be referred to as x) Therefore, 2x + 10.50 = 150
2x + 10.50 = 150
From the equation above, the value of x can be calculated as shown below. 2x = 150-10.50
2x = 139.50 X = 139.50/2 X = 69.75
Therefore, each pair of the running shoes cost £69.75
Paraphrase This Document
Need a fresh take? Get an instant paraphrase of this document with our AI Paraphraser
Question 5
(a). 240.50 x 19.54 (2 significant)
From the above expression, there is a total of four decimal places from the two numbers 24050
x 1954 = 46993700
240.50 x 19.54 = 4699. 3700
= 4699.37 (2 decimal places)
(b) Rewriting 52100 to the power of 10
5.21 x 10⁴
Question 6
(a). A new gym offers 30% discount to individuals who sign up in the first month
-Patty and 2 siblings (which is 3 individuals in total)
-The 3 people paid a total amount of £210
-Let the total amount without the 30% discount be p
-Let the total discount be y Therefore
30/100 x P = y---------Eqn 1
P – y = 210...........Eqn 2
To solve for P, we substitute the value of y in equation 2
P – (30/100 x P) = 210 P – (30P/100) = 210
100P – 30P = 21000
70P = 21000 P = 21000/70 P = 300
We can now substitute the value of P in equation 2 to find y 300 – y = 210
y = 300- 210 = 90
Therefore, the total savings made was £90
(b) The total savings made was £90 There are 3 individuals involved
Therefore, the average savings per person can be calculated as
£90/3 = £30
Question 7
(a). ¾ - 7/9 + 2/3
(27-28+24)/36 = 23/36
(b) Which is the largest of the following numbers? 0.1, 0.02, 0.003, 0.0004, 0.00005
From the above, numbers the largest number is 0.1 because the position of the significant
number one is at tenth which is the largest position after the decimal place (Boyles, 2019).
Question 8
-90 men and 60 women were asked whether they had watched the latest ‘Expendables’ movie.
- The fraction of people that said yes = 3/5
-Fraction of women that said yes = 3/10
-Fraction of men that said yes = 3/5 – 3/10 = 3/10
-Fraction of men that said no = 1 – 3/10 = 7/10
-Number of men that said no = 7/10 x 90 = 63
-Percentage of men that said no = 63/90 x 100 = 70%
Question 9
-Annabelle lives at Bermondsey in London.
-She is required to speak in Birmingham at 10:30 am
-It will take her an hour (1 hr) to get to from her house to Euston Station, where she gets the
train to Birmingham
-The train journey from Euston Station to Birmingham is an hour and 10 minutes (7/6 hrs)
- The meeting venue In Birmingham is a 5-minute (1/6hr) walk from the station.
Therefore, total time it will take Annabelle to journey from her house to the meeting venue is =
1 hrs + 7/6 hrs + 1/12 hr = 27/12 hrs = 2 hours 15 minutes
In order to calculate the time, the total time needed to get the meeting venue from the
scheduled time
=(10hrs 30minutes) – (2hrs 15 minutes) = 8hr 15minutes
Even though the train that runs from Euston to Birmingham comes at 5 minutes past the hour,
25 minutes past the hour and 45 minutes past the hour.
⊘ This is a preview!⊘
Do you want full access?
Subscribe today to unlock all pages.
Trusted by 1+ million students worldwide
Therefore, the latest time that Annabelle can leave the house is at 8 : 15am
Question 10
The weight of Shredded Wheat = 0.35 = 35/100 The weight of Weetabix box = 9/25
Now we need to convert them into numbers (35,36)/100
From the above, the value of the Shredded Wheat is 35, while that of the Weetabix is 36
Therefore, the Weetabix is heavier
Part 2
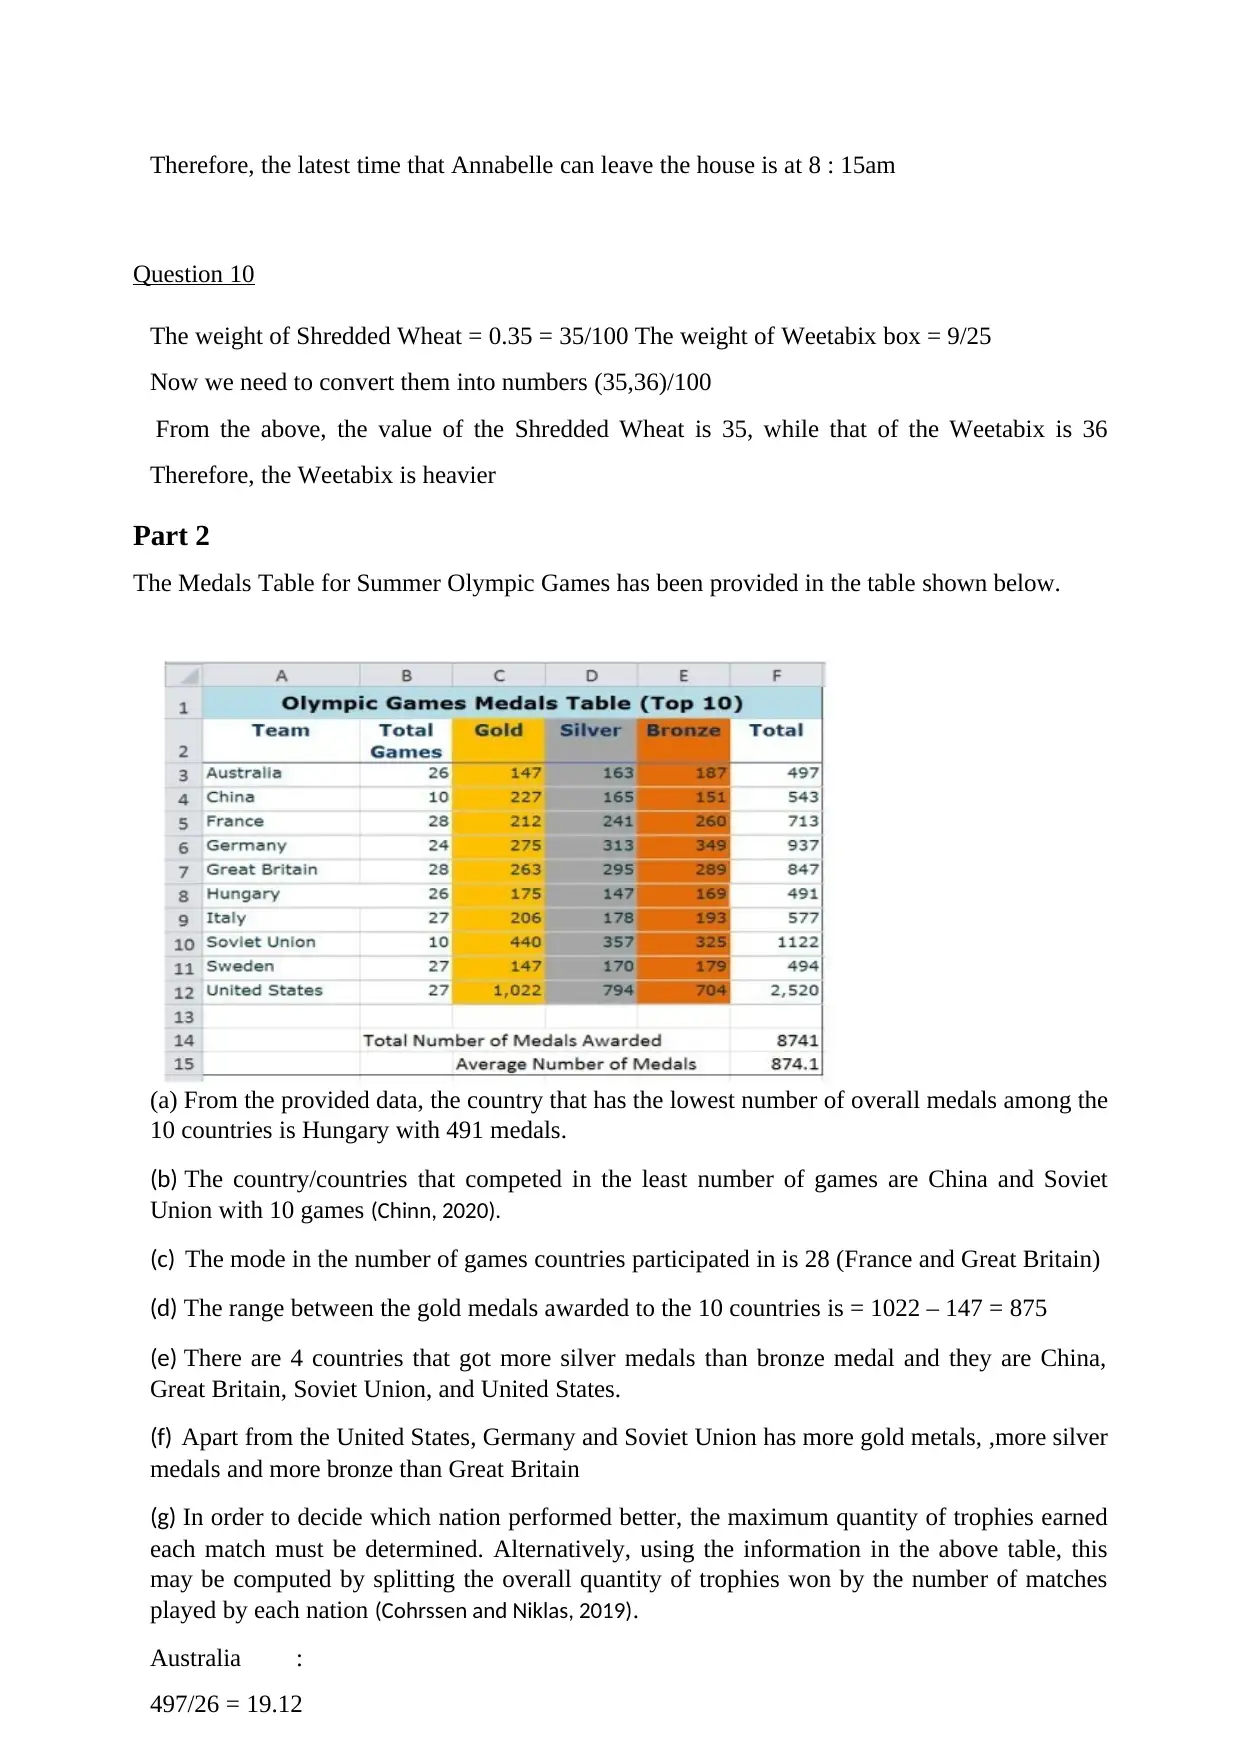
The Medals Table for Summer Olympic Games has been provided in the table shown below.
(a) From the provided data, the country that has the lowest number of overall medals among the
10 countries is Hungary with 491 medals.
(b) The country/countries that competed in the least number of games are China and Soviet
Union with 10 games (Chinn, 2020).
(c) The mode in the number of games countries participated in is 28 (France and Great Britain)
(d) The range between the gold medals awarded to the 10 countries is = 1022 – 147 = 875
(e) There are 4 countries that got more silver medals than bronze medal and they are China,
Great Britain, Soviet Union, and United States.
(f) Apart from the United States, Germany and Soviet Union has more gold metals, ,more silver
medals and more bronze than Great Britain
(g) In order to decide which nation performed better, the maximum quantity of trophies earned
each match must be determined. Alternatively, using the information in the above table, this
may be computed by splitting the overall quantity of trophies won by the number of matches
played by each nation (Cohrssen and Niklas, 2019).
Australia :
497/26 = 19.12
Question 10
The weight of Shredded Wheat = 0.35 = 35/100 The weight of Weetabix box = 9/25
Now we need to convert them into numbers (35,36)/100
From the above, the value of the Shredded Wheat is 35, while that of the Weetabix is 36
Therefore, the Weetabix is heavier
Part 2
The Medals Table for Summer Olympic Games has been provided in the table shown below.
(a) From the provided data, the country that has the lowest number of overall medals among the
10 countries is Hungary with 491 medals.
(b) The country/countries that competed in the least number of games are China and Soviet
Union with 10 games (Chinn, 2020).
(c) The mode in the number of games countries participated in is 28 (France and Great Britain)
(d) The range between the gold medals awarded to the 10 countries is = 1022 – 147 = 875
(e) There are 4 countries that got more silver medals than bronze medal and they are China,
Great Britain, Soviet Union, and United States.
(f) Apart from the United States, Germany and Soviet Union has more gold metals, ,more silver
medals and more bronze than Great Britain
(g) In order to decide which nation performed better, the maximum quantity of trophies earned
each match must be determined. Alternatively, using the information in the above table, this
may be computed by splitting the overall quantity of trophies won by the number of matches
played by each nation (Cohrssen and Niklas, 2019).
Australia :
497/26 = 19.12
Paraphrase This Document
Need a fresh take? Get an instant paraphrase of this document with our AI Paraphraser
China : 543/10
= 54.3
France : 713/28 = 25.46
Germany: 937/24
=39.04 Great
Britain : 847/28
=30.25 Hungary :
491/26 = 18.88
Italy : 577/27 =
21.37
Soviet Union:
1122/10 = 112.2
Sweden : 494/27=
18.30 United States:
2520/27 = 93.33
From the above calculations, it is clear that Soviet Union is the country that
perform the best since they have the highest number of medals per game (112.2
medals per game).
(h) There could be various factors why a nation like Jamaica, which excels in
athletes, doesn't really place in the top ten awards. The primary cause for their lack
of participation in numerous tournaments could be due to their relatively tiny
demographic in comparison to other nations. The larger the populace, the more
likely they are to participate in more tournaments and, as a result, to be among the
top ten medalist nations. Furthermore, contrasted to other sports such as group
sports, where individuals seldom engage in, the athletic activities engaged in
Olympic events are rather minor (Fatima and Linnes, 2019).
(i). The nearest competition to the United States, according to the chart, is the
Soviet Union, therefore each award class of the United States will indeed be
contrasted to that of the Soviet Union.
Gold medal US = 1022
Soviet Union = 440
The difference = 1022 – 440 = 582
Silver medal US = 794
Soviet Union = 357
The difference = 794 – 357 = 437
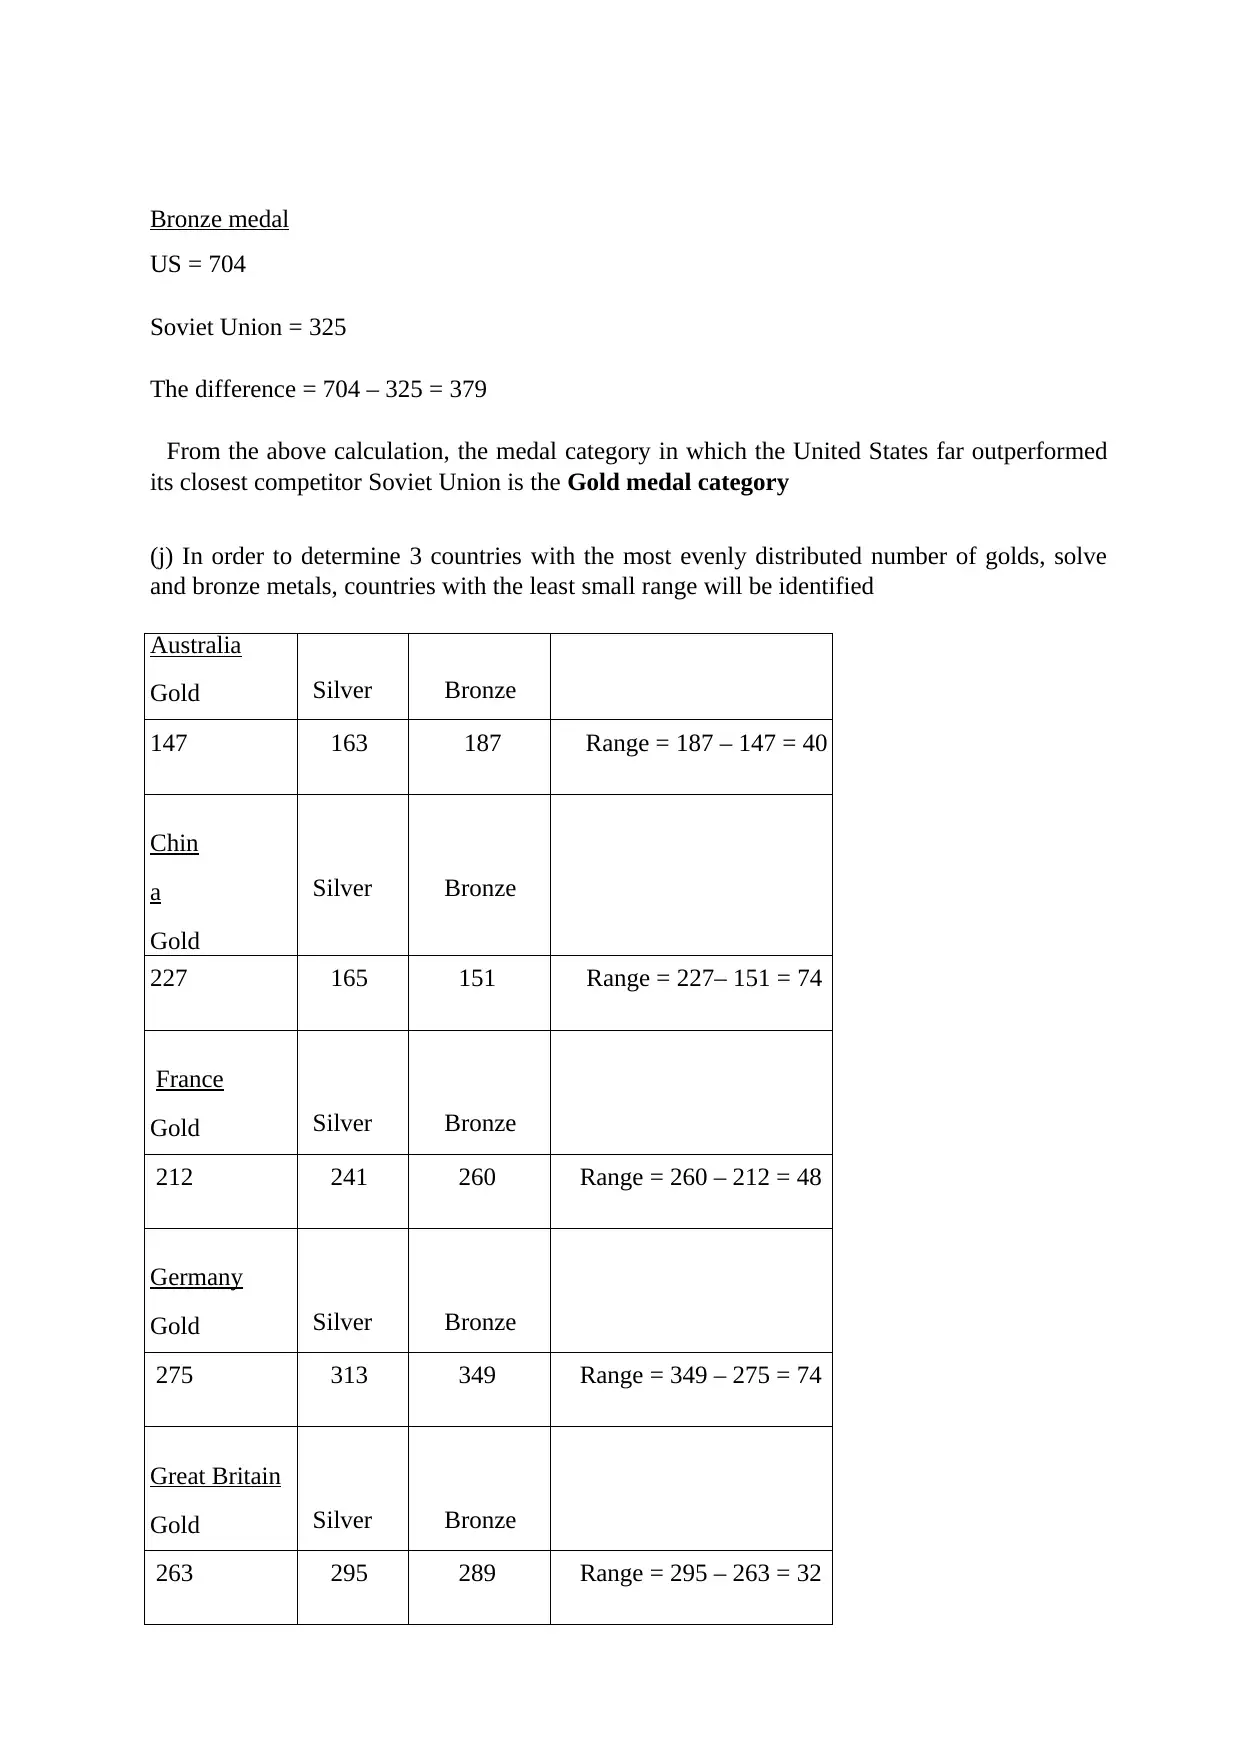
Bronze medal
US = 704
Soviet Union = 325
The difference = 704 – 325 = 379
From the above calculation, the medal category in which the United States far outperformed
its closest competitor Soviet Union is the Gold medal category
(j) In order to determine 3 countries with the most evenly distributed number of golds, solve
and bronze metals, countries with the least small range will be identified
Australia
Gold Silver Bronze
147 163 187 Range = 187 – 147 = 40
Chin
a
Gold
Silver Bronze
227 165 151 Range = 227– 151 = 74
France
Gold Silver Bronze
212 241 260 Range = 260 – 212 = 48
Germany
Gold Silver Bronze
275 313 349 Range = 349 – 275 = 74
Great Britain
Gold Silver Bronze
263 295 289 Range = 295 – 263 = 32
⊘ This is a preview!⊘
Do you want full access?
Subscribe today to unlock all pages.
Trusted by 1+ million students worldwide
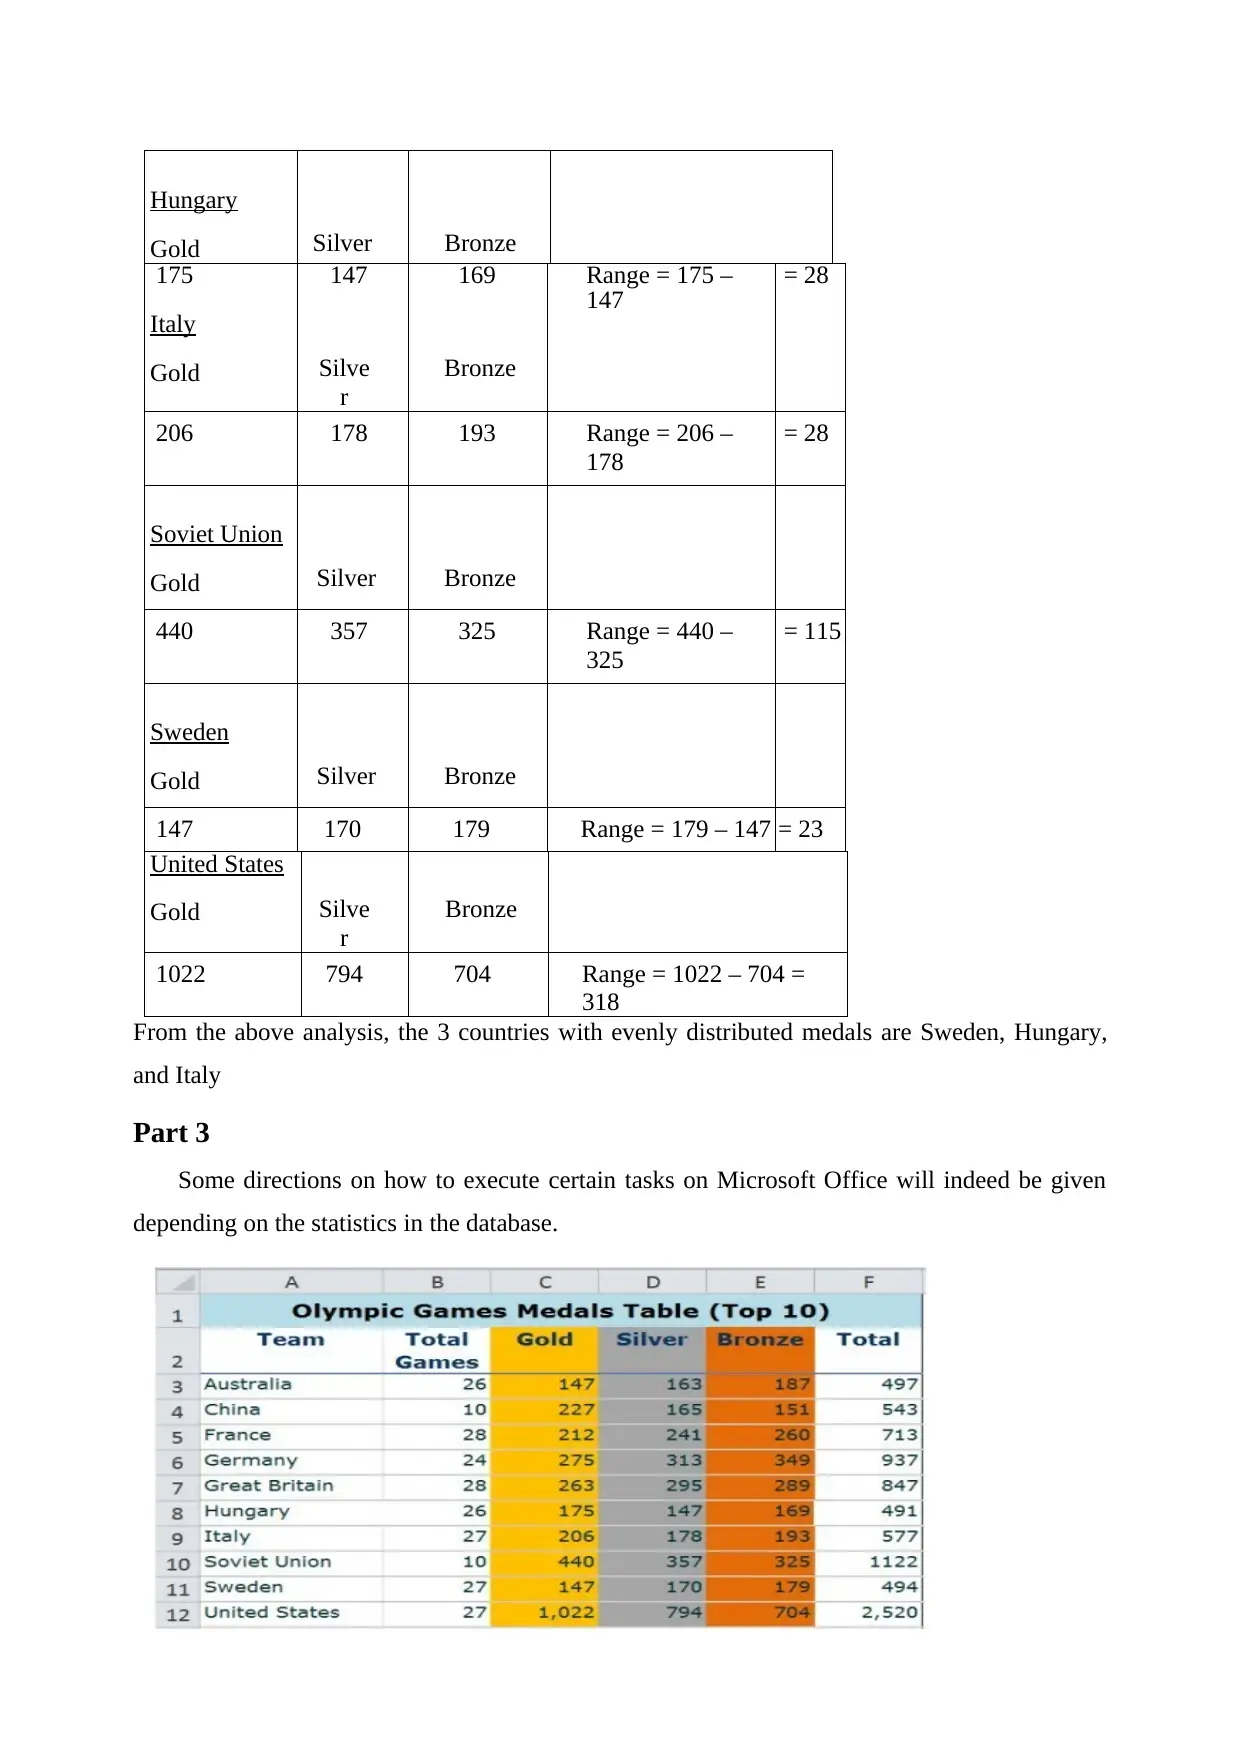
Hungary
Gold Silver Bronze
175
Italy
Gold
147
Silve
r
169
Bronze
Range = 175 –
147 = 28
206 178 193 Range = 206 –
178
= 28
Soviet Union
Gold Silver Bronze
440 357 325 Range = 440 –
325
= 115
Sweden
Gold Silver Bronze
147 170 179 Range = 179 – 147 = 23
United States
Gold Silve
r
Bronze
1022 794 704 Range = 1022 – 704 =
318
From the above analysis, the 3 countries with evenly distributed medals are Sweden, Hungary,
and Italy
Part 3
Some directions on how to execute certain tasks on Microsoft Office will indeed be given
depending on the statistics in the database.
Gold Silver Bronze
175
Italy
Gold
147
Silve
r
169
Bronze
Range = 175 –
147 = 28
206 178 193 Range = 206 –
178
= 28
Soviet Union
Gold Silver Bronze
440 357 325 Range = 440 –
325
= 115
Sweden
Gold Silver Bronze
147 170 179 Range = 179 – 147 = 23
United States
Gold Silve
r
Bronze
1022 794 704 Range = 1022 – 704 =
318
From the above analysis, the 3 countries with evenly distributed medals are Sweden, Hungary,
and Italy
Part 3
Some directions on how to execute certain tasks on Microsoft Office will indeed be given
depending on the statistics in the database.
Paraphrase This Document
Need a fresh take? Get an instant paraphrase of this document with our AI Paraphraser
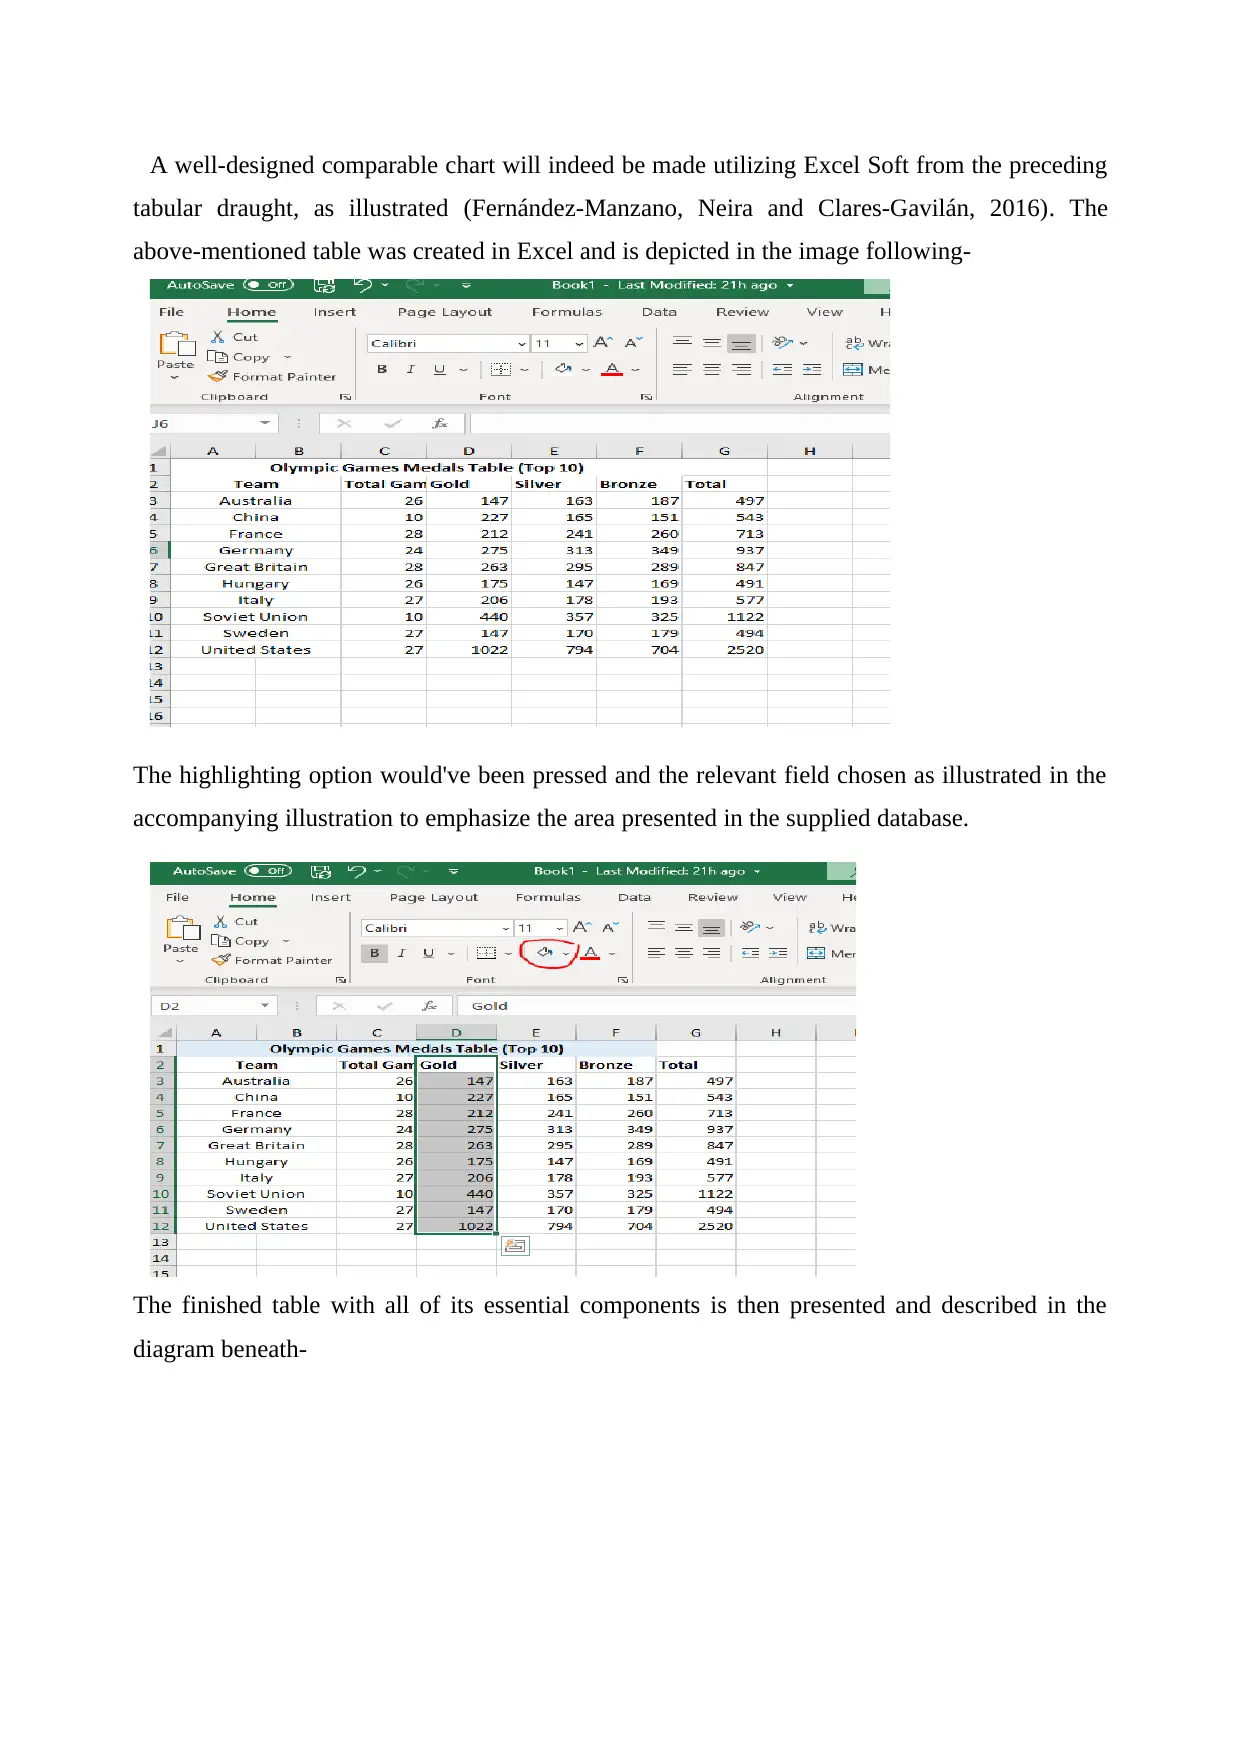
A well-designed comparable chart will indeed be made utilizing Excel Soft from the preceding
tabular draught, as illustrated (Fernández-Manzano, Neira and Clares-Gavilán, 2016). The
above-mentioned table was created in Excel and is depicted in the image following-
The highlighting option would've been pressed and the relevant field chosen as illustrated in the
accompanying illustration to emphasize the area presented in the supplied database.
The finished table with all of its essential components is then presented and described in the
diagram beneath-
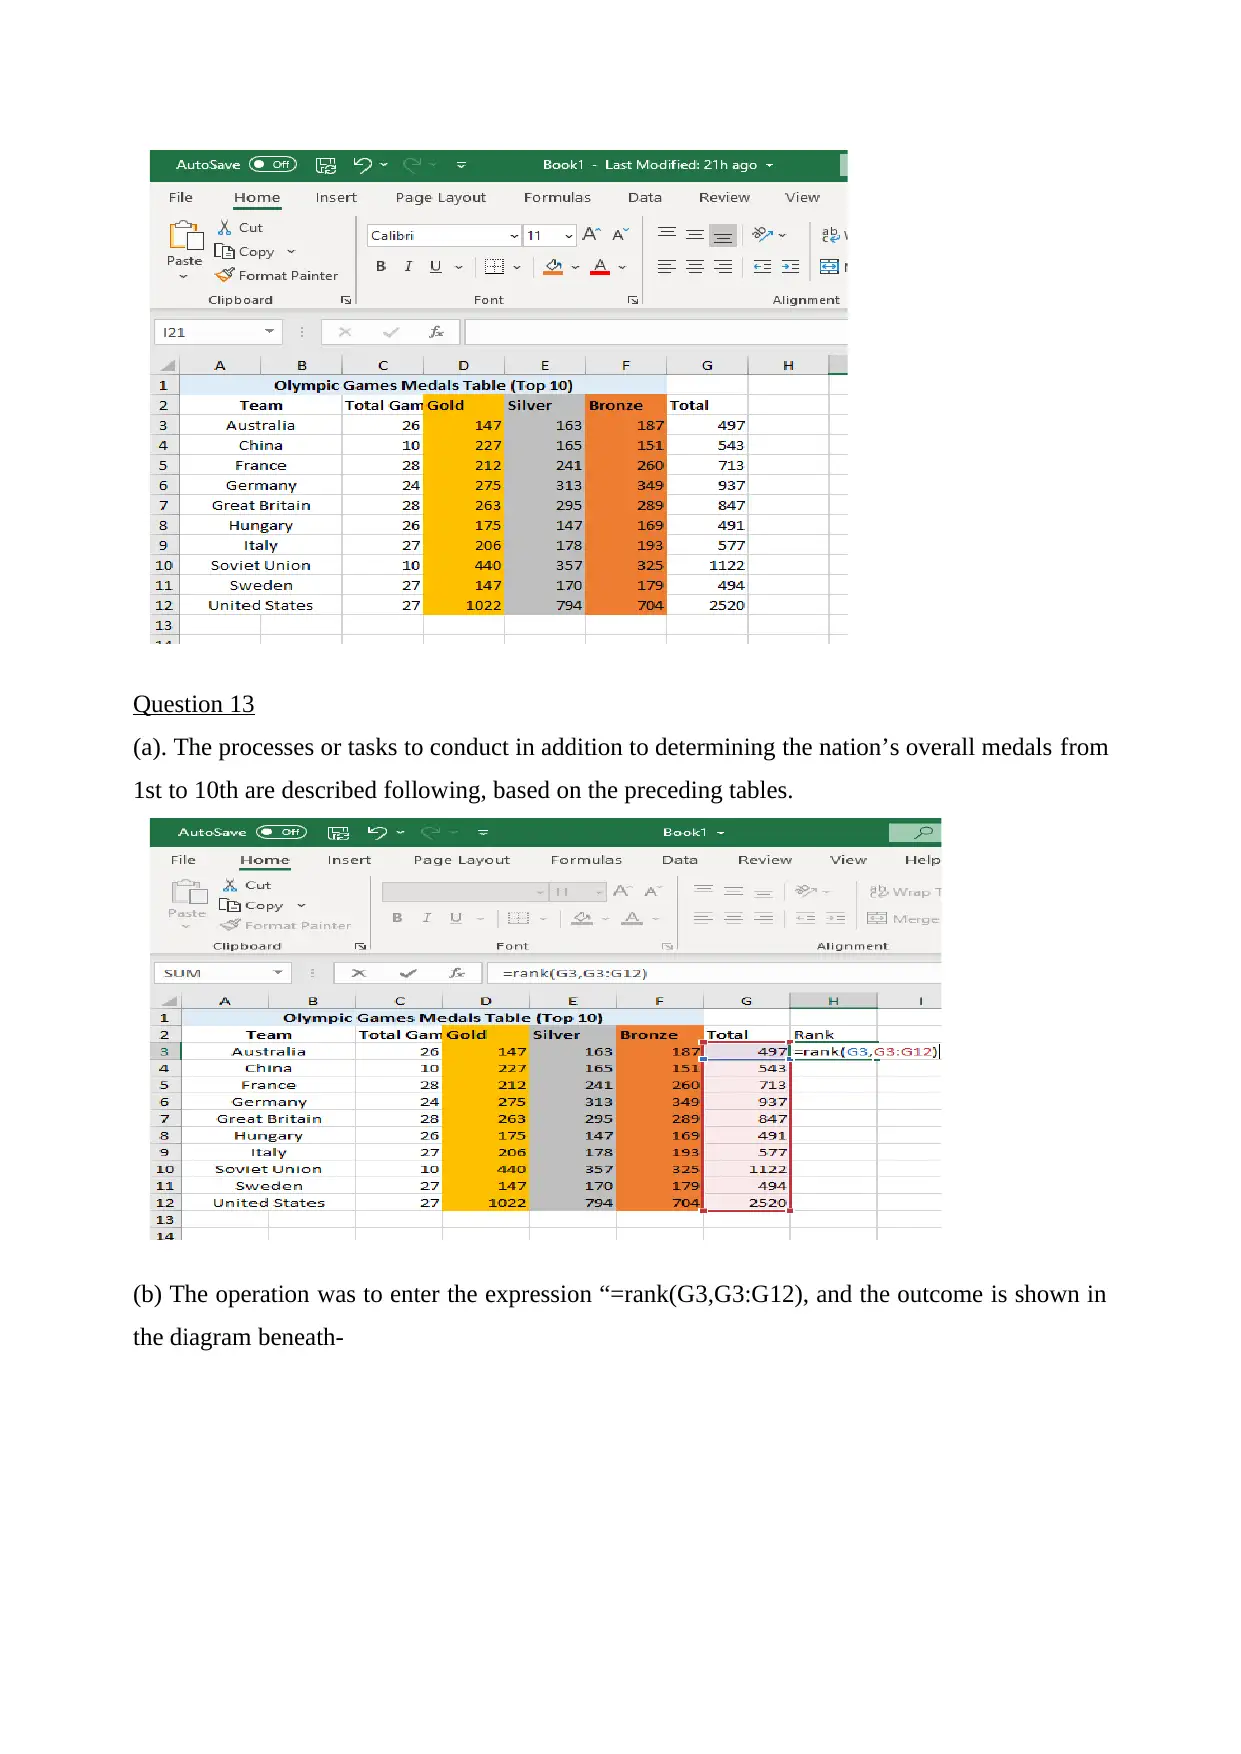
Question 13
(a). The processes or tasks to conduct in addition to determining the nation’s overall medals from
1st to 10th are described following, based on the preceding tables.
(b) The operation was to enter the expression “=rank(G3,G3:G12), and the outcome is shown in
the diagram beneath-
(a). The processes or tasks to conduct in addition to determining the nation’s overall medals from
1st to 10th are described following, based on the preceding tables.
(b) The operation was to enter the expression “=rank(G3,G3:G12), and the outcome is shown in
the diagram beneath-
⊘ This is a preview!⊘
Do you want full access?
Subscribe today to unlock all pages.
Trusted by 1+ million students worldwide
1 out of 22
Related Documents


Your All-in-One AI-Powered Toolkit for Academic Success.
+13062052269
info@desklib.com
Available 24*7 on WhatsApp / Email
![[object Object]](/_next/static/media/star-bottom.7253800d.svg)
Unlock your academic potential
Copyright © 2020–2026 A2Z Services. All Rights Reserved. Developed and managed by ZUCOL.