Data Analysis Techniques: Leeds Wind Speed Analysis Report, June 2019

Verified

Added on  2021/02/20

|11
|1611
|54
Report
AI Summary
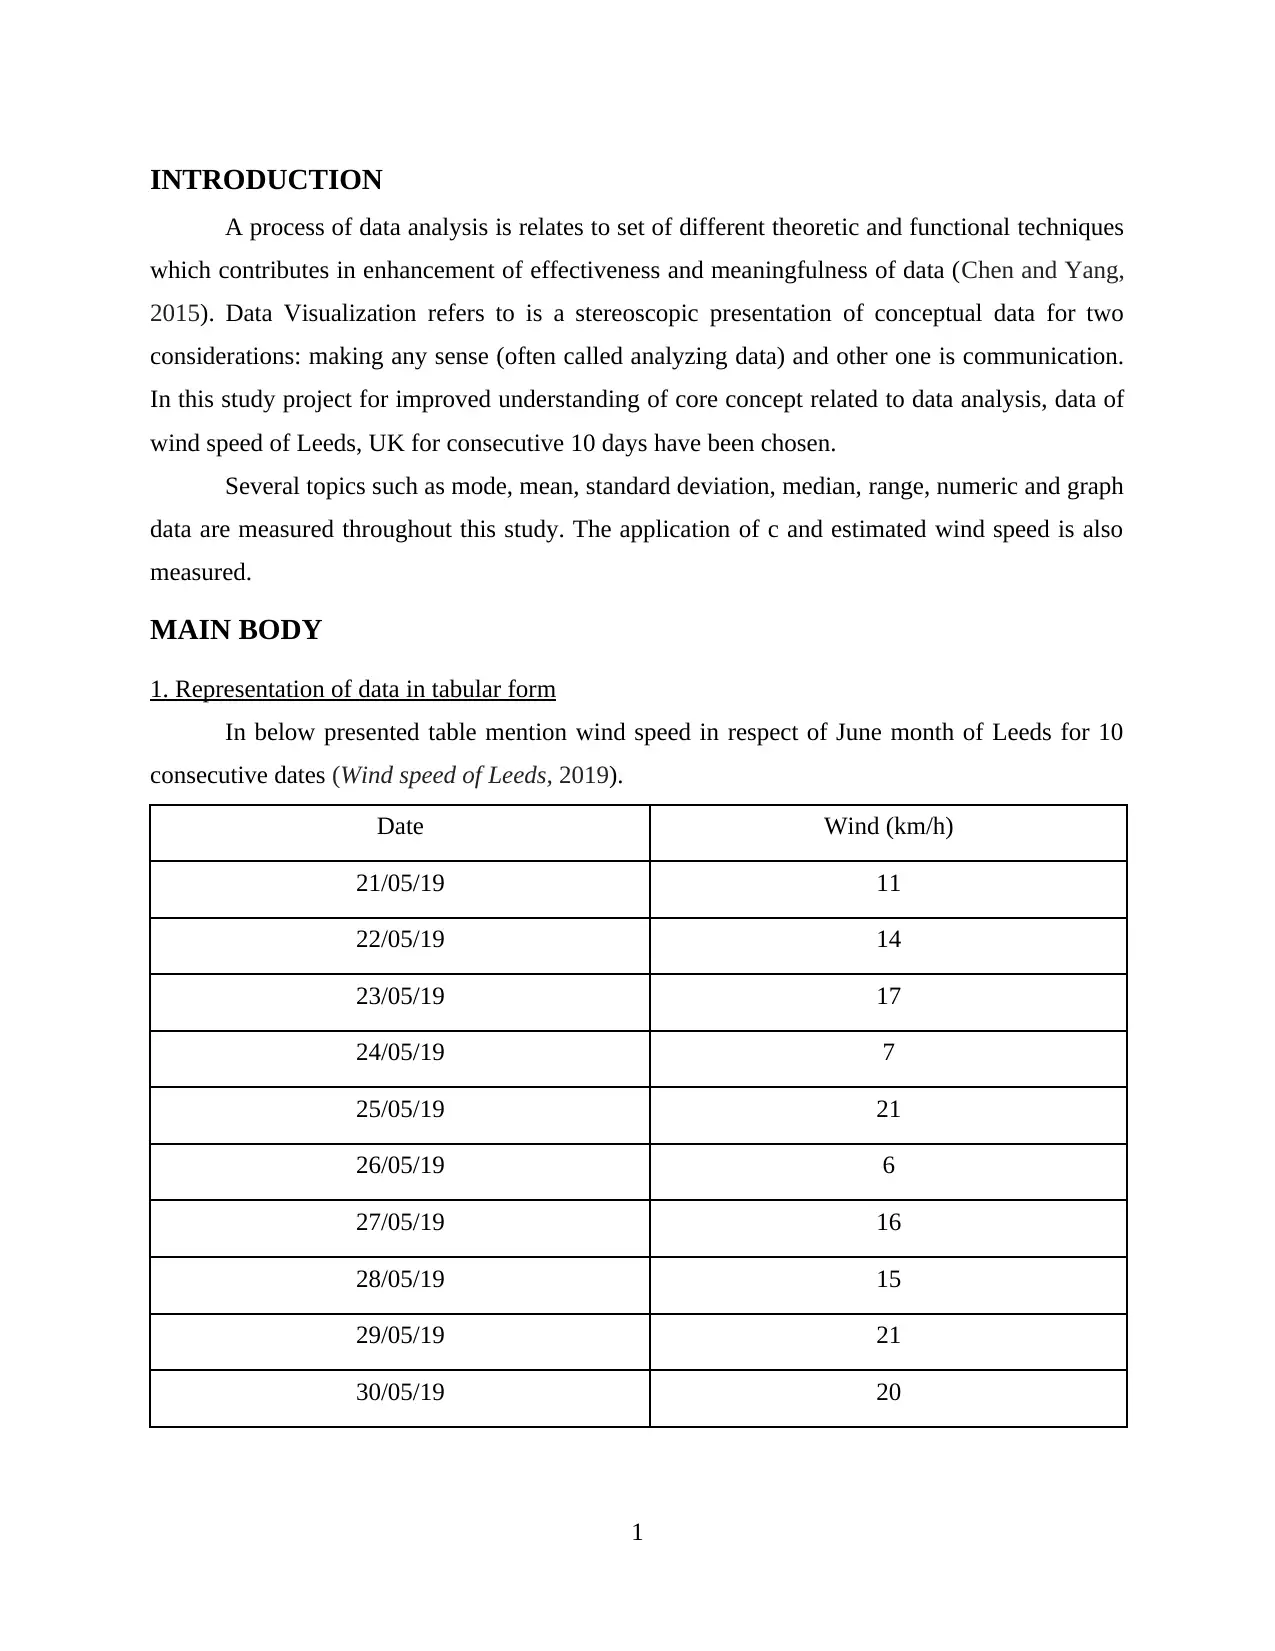
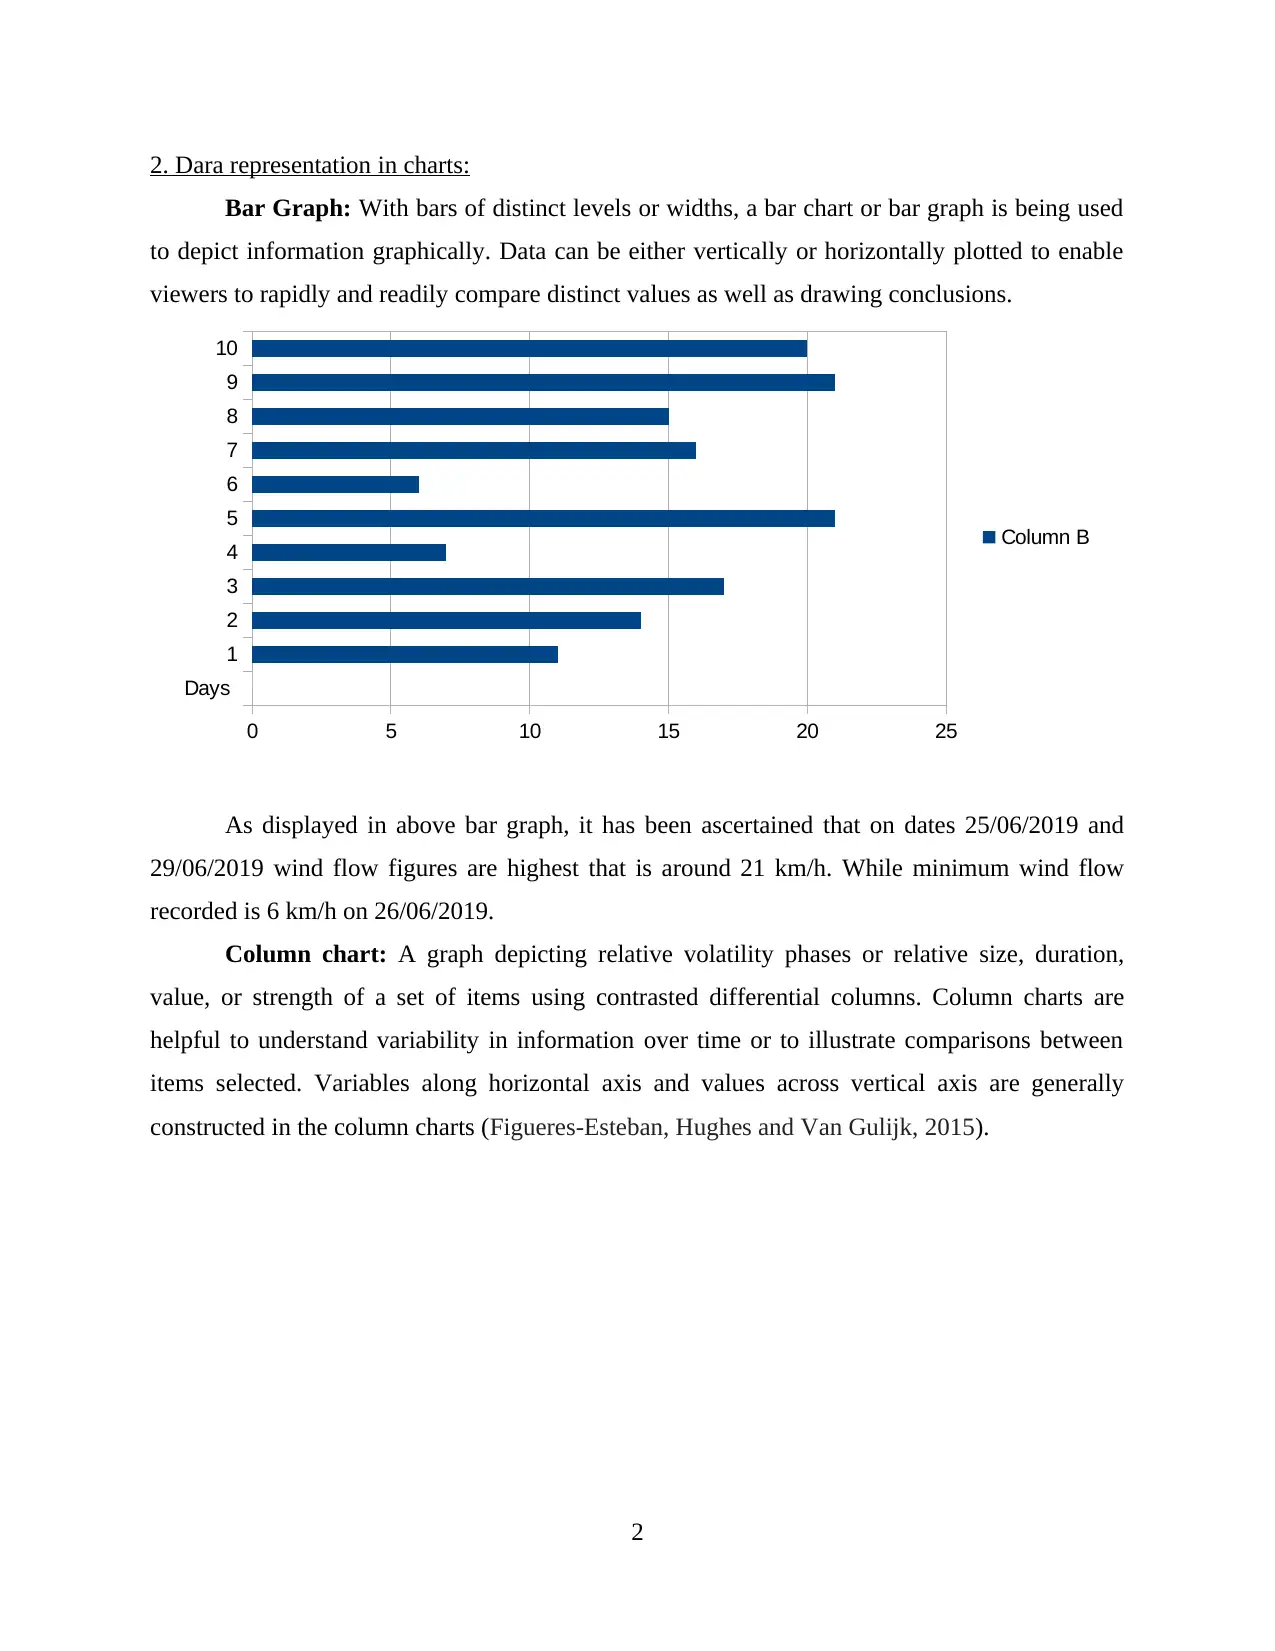
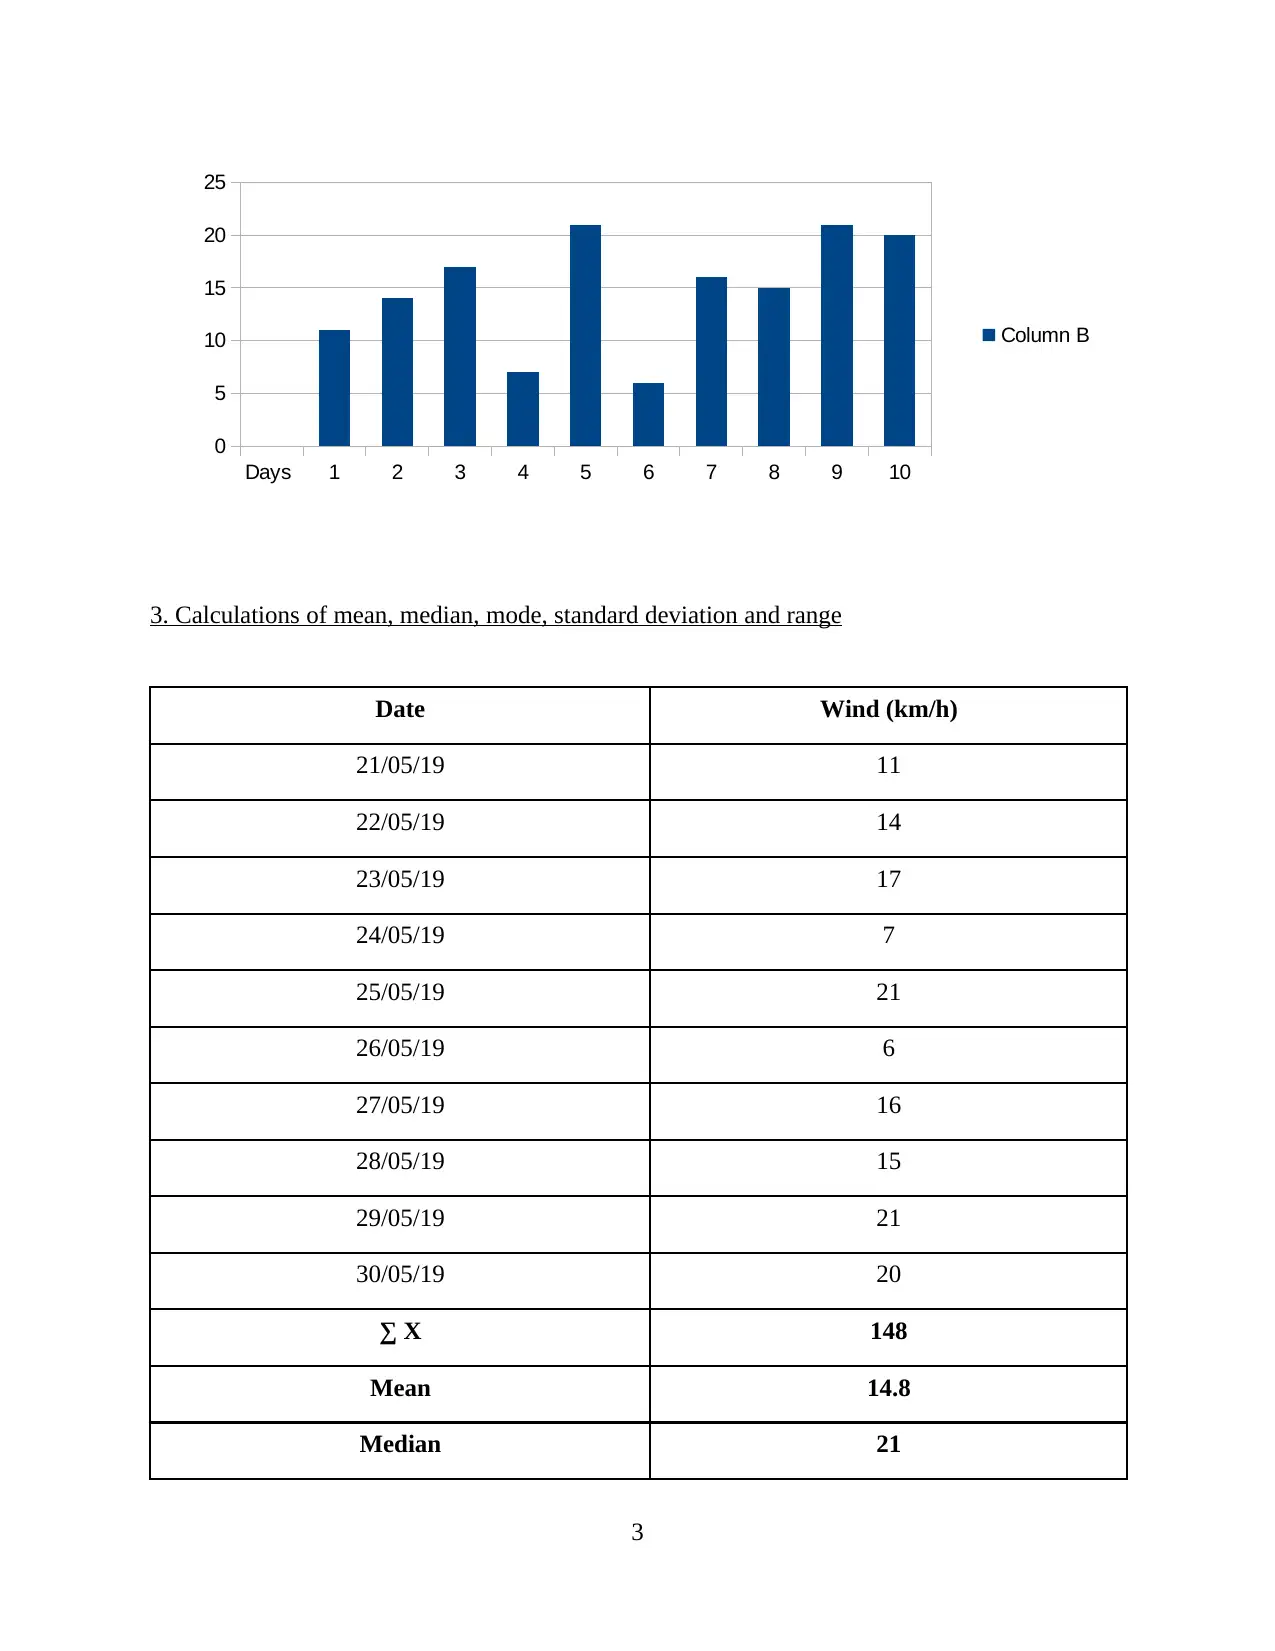
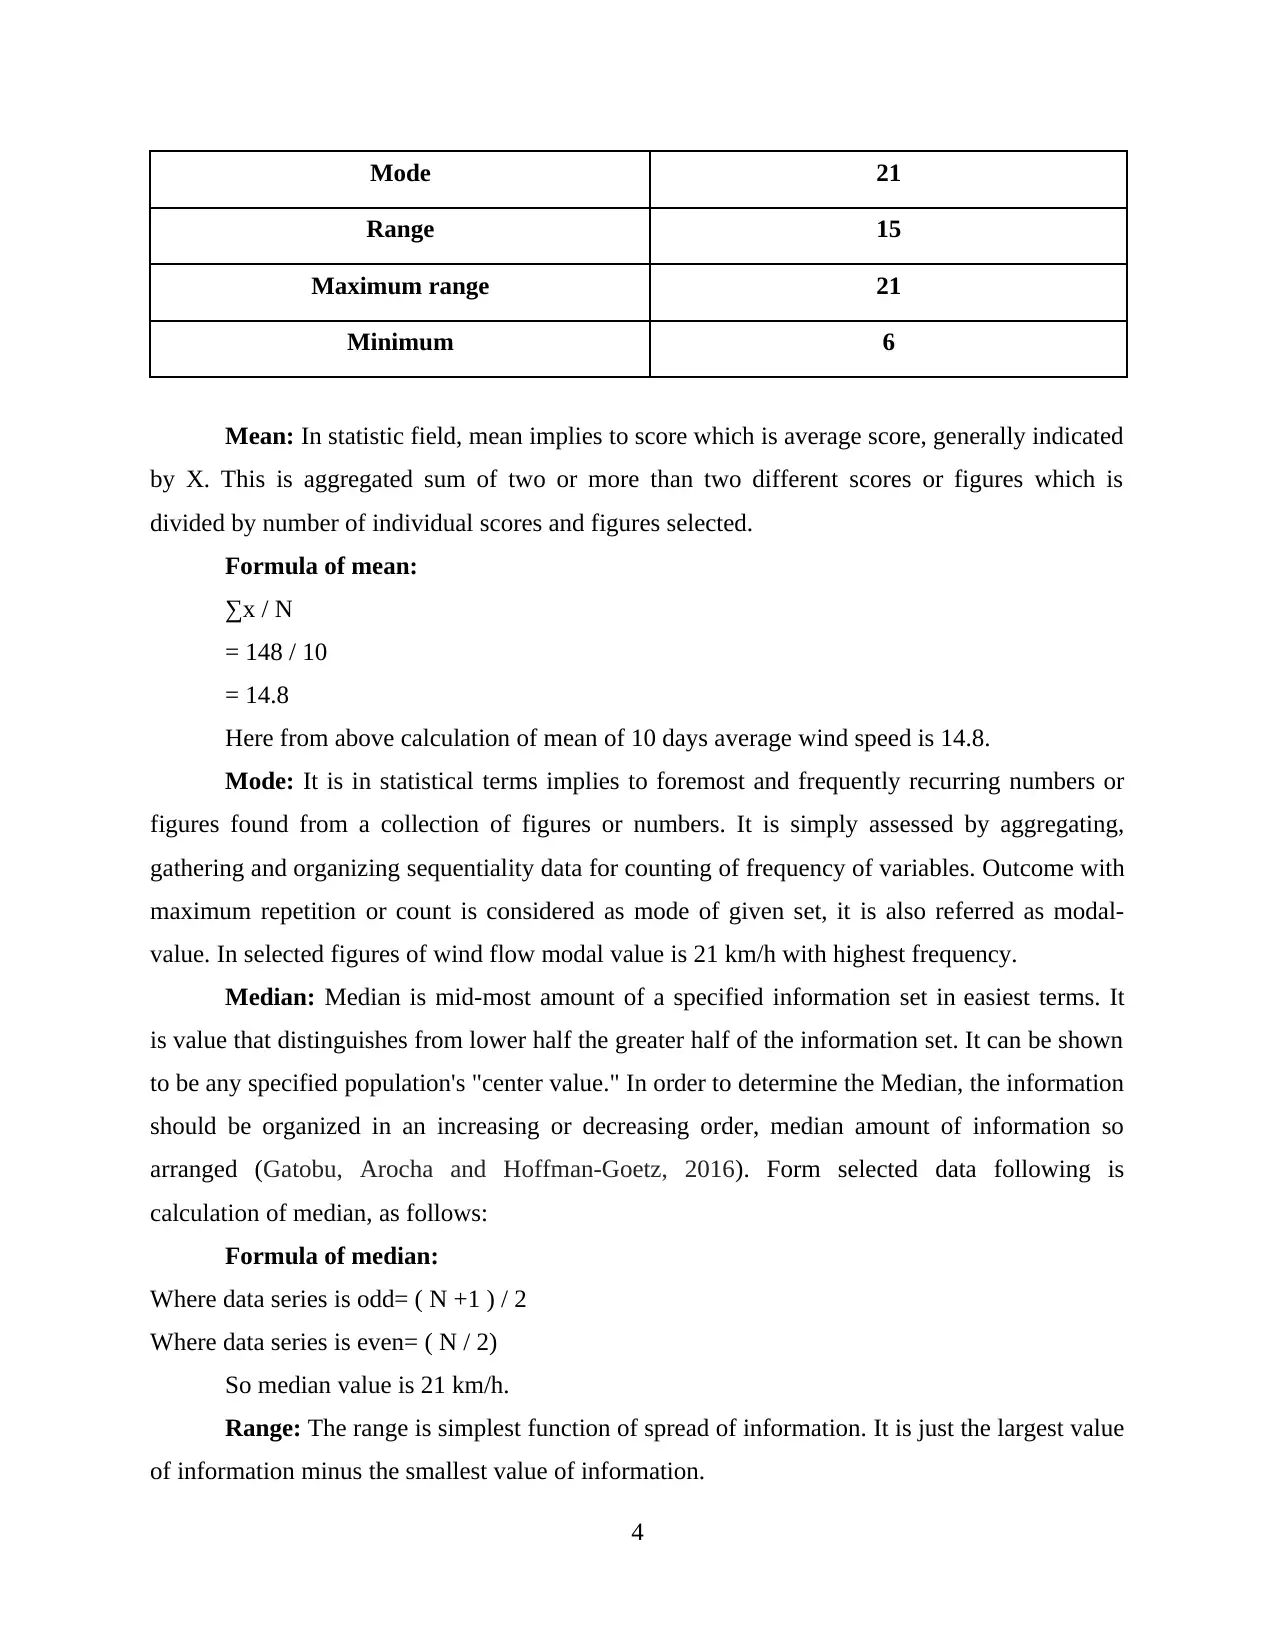
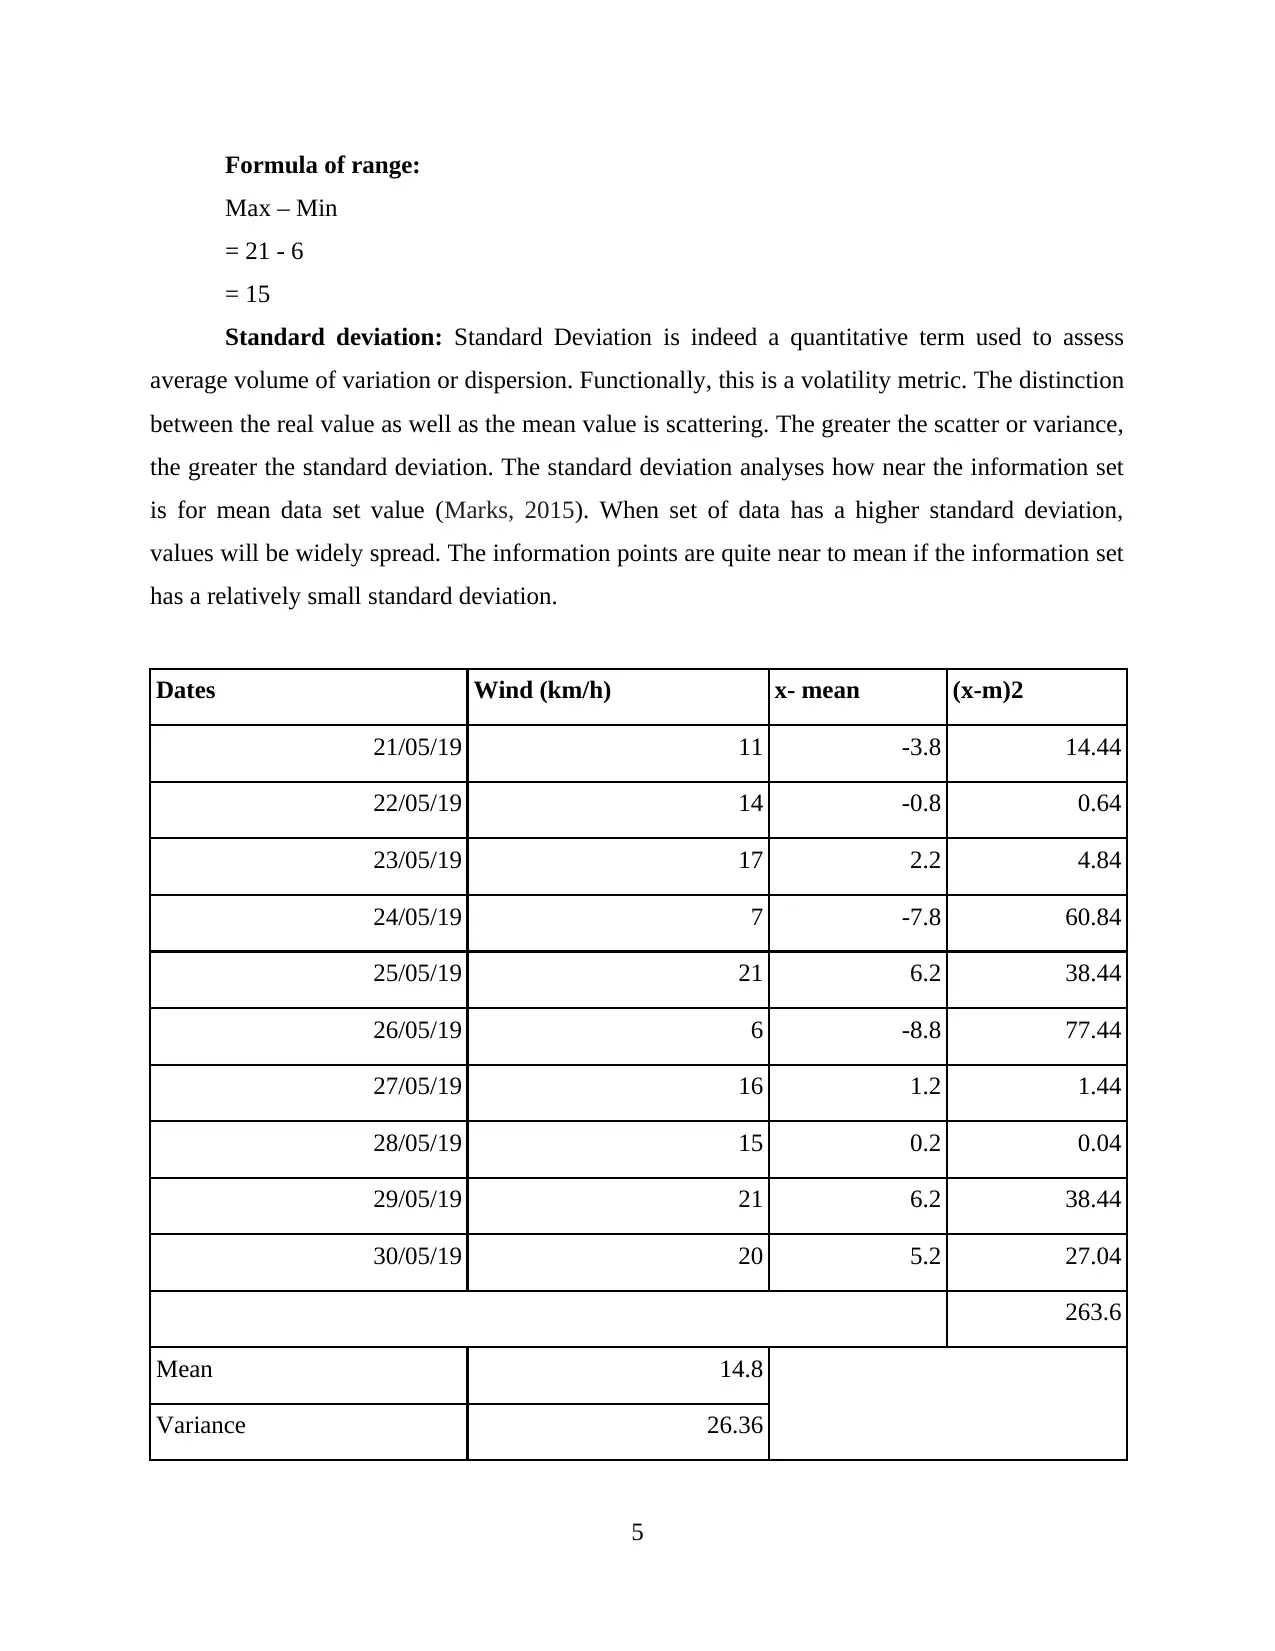
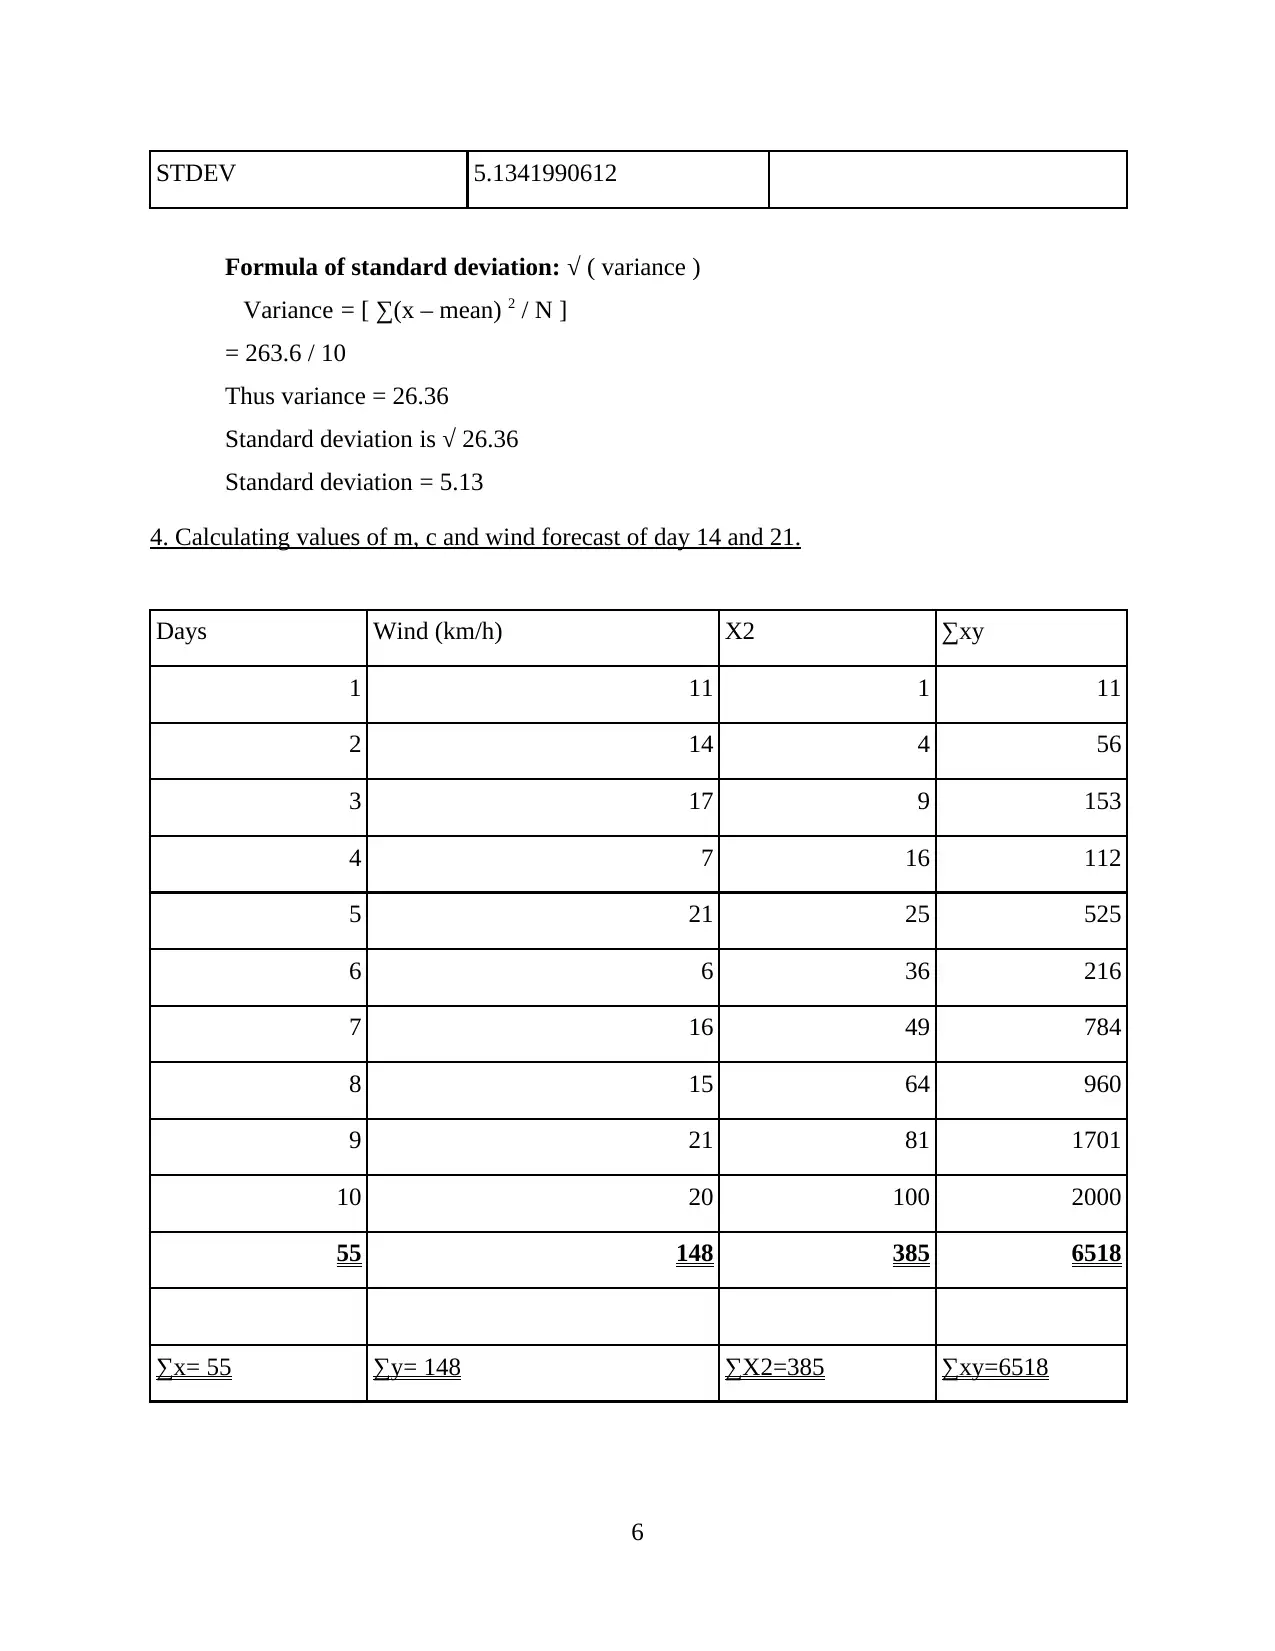
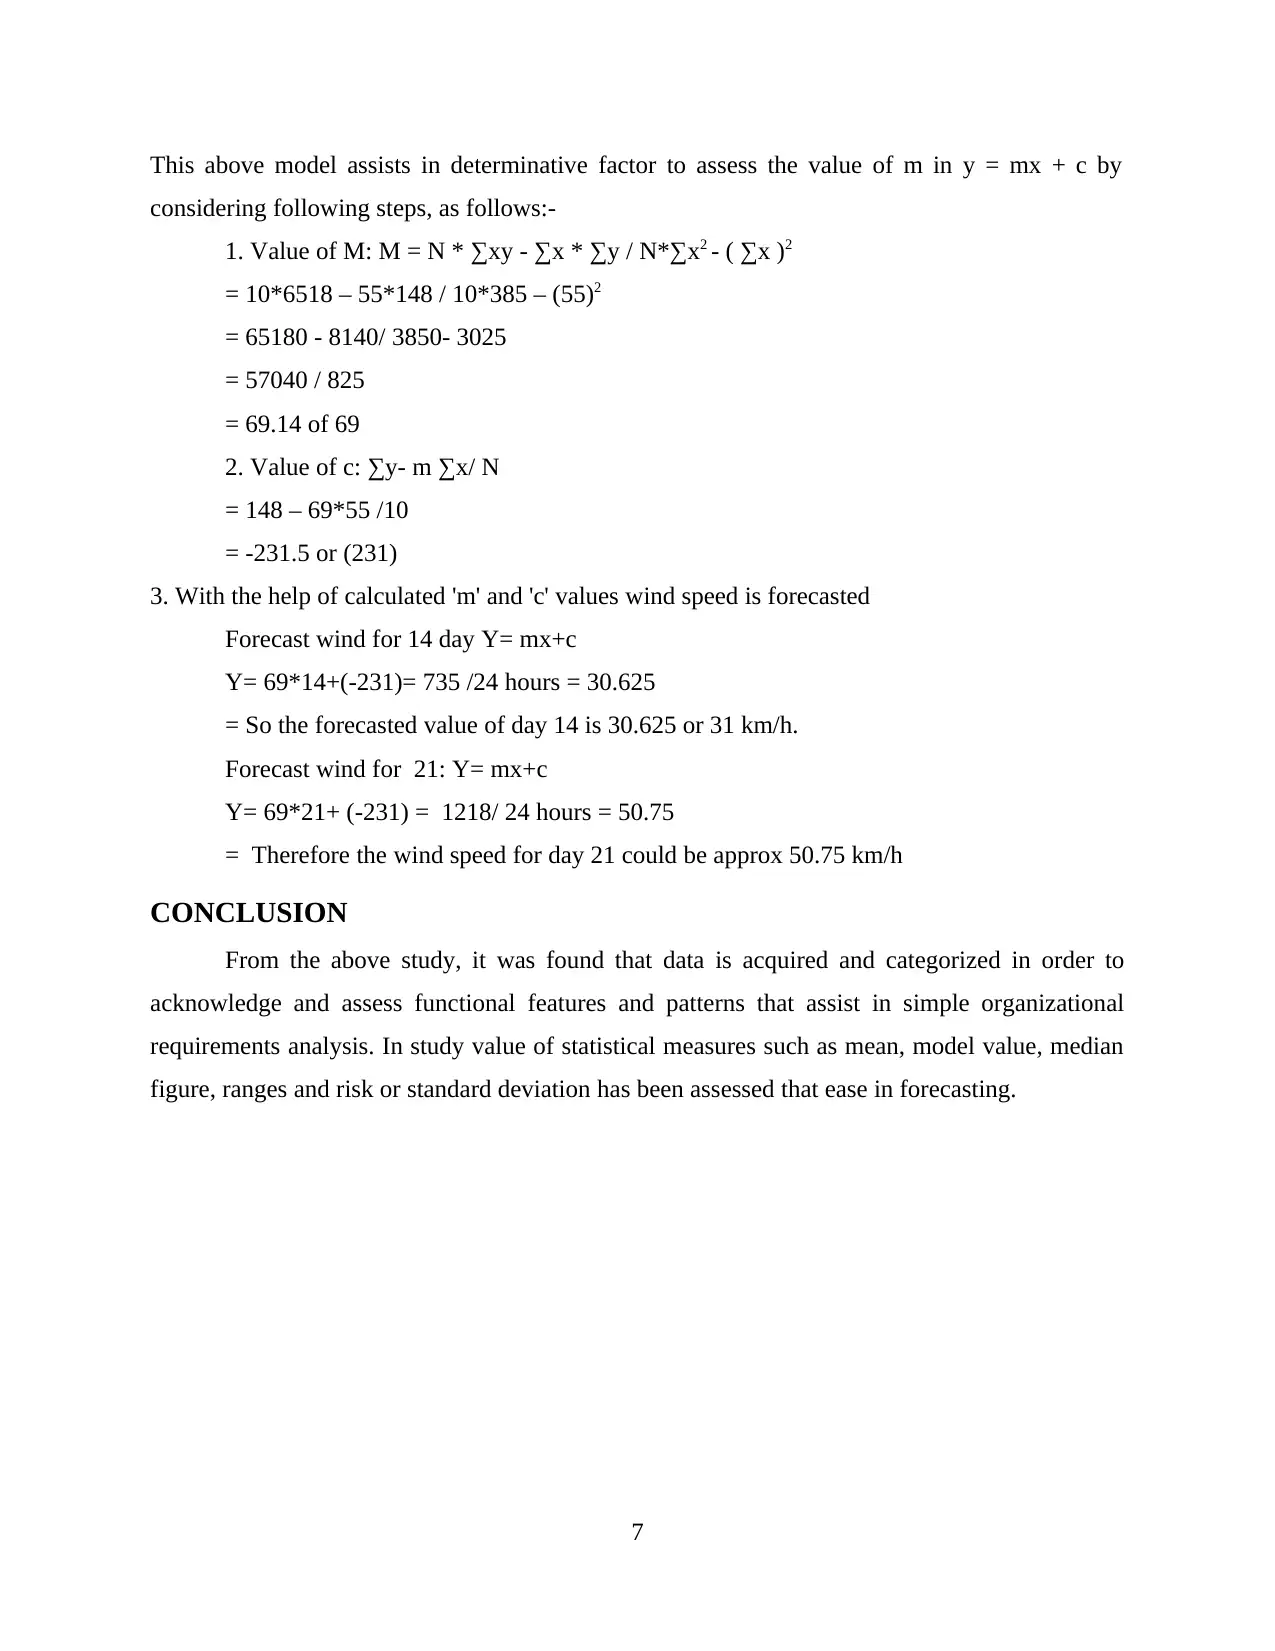
This report presents an analysis of wind speed data collected in Leeds, UK, over a 10-day period in June 2019. The analysis encompasses several data analysis techniques, including the representation of data in tabular and graphical formats (bar and column charts). Key statistical measures such as mean, median, mode, standard deviation, and range are calculated to provide a comprehensive understanding of the wind speed patterns. Furthermore, the report demonstrates the application of linear regression to forecast wind speed for specific days, including the 14th and 21st days, by calculating the values of 'm' and 'c'. The conclusion highlights the effectiveness of these techniques in data interpretation and forecasting, offering valuable insights for students studying data science and related fields. The report is contributed to Desklib, a platform providing AI-based study tools for students.
Document Page
DATA ANALYSIS
TECHNIQUES
tabler-icon-diamond-filled.svg

Paraphrase This Document

Need a fresh take? Get an instant paraphrase of this document with our AI Paraphraser
Document Page
Document Page
Table of Contents
INTRODUCTION...........................................................................................................................1
MAIN BODY...................................................................................................................................1
1. Representation of data in tabular form...............................................................................1
3. Calculations of mean, median, mode, standard deviation and range.................................3
4. Calculating values of m, c and wind forecast of day 14 and 21.........................................5
CONCLUSION ...............................................................................................................................6
REFERENCES................................................................................................................................7
Document Page
tabler-icon-diamond-filled.svg

Paraphrase This Document

Need a fresh take? Get an instant paraphrase of this document with our AI Paraphraser
Document Page
INTRODUCTION
A process of data analysis is relates to set of different theoretic and functional techniques
which contributes in enhancement of effectiveness and meaningfulness of data (Chen and Yang,
2015). Data Visualization refers to is a stereoscopic presentation of conceptual data for two
considerations: making any sense (often called analyzing data) and other one is communication.
In this study project for improved understanding of core concept related to data analysis, data of
wind speed of Leeds, UK for consecutive 10 days have been chosen.
Several topics such as mode, mean, standard deviation, median, range, numeric and graph
data are measured throughout this study. The application of c and estimated wind speed is also
measured.
MAIN BODY
1. Representation of data in tabular form
In below presented table mention wind speed in respect of June month of Leeds for 10
consecutive dates (Wind speed of Leeds, 2019).
Date Wind (km/h)
21/05/19 11
22/05/19 14
23/05/19 17
24/05/19 7
25/05/19 21
26/05/19 6
27/05/19 16
28/05/19 15
29/05/19 21
30/05/19 20
1
Document Page
2. Dara representation in charts:
Bar Graph: With bars of distinct levels or widths, a bar chart or bar graph is being used
to depict information graphically. Data can be either vertically or horizontally plotted to enable
viewers to rapidly and readily compare distinct values as well as drawing conclusions.
As displayed in above bar graph, it has been ascertained that on dates 25/06/2019 and
29/06/2019 wind flow figures are highest that is around 21 km/h. While minimum wind flow
recorded is 6 km/h on 26/06/2019.
Column chart: A graph depicting relative volatility phases or relative size, duration,
value, or strength of a set of items using contrasted differential columns. Column charts are
helpful to understand variability in information over time or to illustrate comparisons between
items selected. Variables along horizontal axis and values across vertical axis are generally
constructed in the column charts (Figueres-Esteban, Hughes and Van Gulijk, 2015).
2
Days
1
2
3
4
5
6
7
8
9
10
0 5 10 15 20 25
Column B
Document Page
3. Calculations of mean, median, mode, standard deviation and range
Date Wind (km/h)
21/05/19 11
22/05/19 14
23/05/19 17
24/05/19 7
25/05/19 21
26/05/19 6
27/05/19 16
28/05/19 15
29/05/19 21
30/05/19 20
X 148
Mean 14.8
Median 21
3
Days 1 2 3 4 5 6 7 8 9 10
0
5
10
15
20
25
Column B
tabler-icon-diamond-filled.svg

Paraphrase This Document

Need a fresh take? Get an instant paraphrase of this document with our AI Paraphraser
Document Page
Mode 21
Range 15
Maximum range 21
Minimum 6
Mean: In statistic field, mean implies to score which is average score, generally indicated
by X. This is aggregated sum of two or more than two different scores or figures which is
divided by number of individual scores and figures selected.
Formula of mean:
∑x / N
= 148 / 10
= 14.8
Here from above calculation of mean of 10 days average wind speed is 14.8.
Mode: It is in statistical terms implies to foremost and frequently recurring numbers or
figures found from a collection of figures or numbers. It is simply assessed by aggregating,
gathering and organizing sequentiality data for counting of frequency of variables. Outcome with
maximum repetition or count is considered as mode of given set, it is also referred as modal-
value. In selected figures of wind flow modal value is 21 km/h with highest frequency.
Median: Median is mid-most amount of a specified information set in easiest terms. It
is value that distinguishes from lower half the greater half of the information set. It can be shown
to be any specified population's "center value." In order to determine the Median, the information
should be organized in an increasing or decreasing order, median amount of information so
arranged (Gatobu, Arocha and Hoffman-Goetz, 2016). Form selected data following is
calculation of median, as follows:
Formula of median:
Where data series is odd= ( N +1 ) / 2
Where data series is even= ( N / 2)
So median value is 21 km/h.
Range: The range is simplest function of spread of information. It is just the largest value
of information minus the smallest value of information.
4
Document Page
Formula of range:
Max – Min
= 21 - 6
= 15
Standard deviation: Standard Deviation is indeed a quantitative term used to assess
average volume of variation or dispersion. Functionally, this is a volatility metric. The distinction
between the real value as well as the mean value is scattering. The greater the scatter or variance,
the greater the standard deviation. The standard deviation analyses how near the information set
is for mean data set value (Marks, 2015). When set of data has a higher standard deviation,
values will be widely spread. The information points are quite near to mean if the information set
has a relatively small standard deviation.
Dates Wind (km/h) x- mean (x-m)2
21/05/19 11 -3.8 14.44
22/05/19 14 -0.8 0.64
23/05/19 17 2.2 4.84
24/05/19 7 -7.8 60.84
25/05/19 21 6.2 38.44
26/05/19 6 -8.8 77.44
27/05/19 16 1.2 1.44
28/05/19 15 0.2 0.04
29/05/19 21 6.2 38.44
30/05/19 20 5.2 27.04
263.6
Mean 14.8
Variance 26.36
5
Document Page
STDEV 5.1341990612
Formula of standard deviation: √ ( variance )
Variance = [ ∑(x – mean) 2 / N ]
= 263.6 / 10
Thus variance = 26.36
Standard deviation is √ 26.36
Standard deviation = 5.13
4. Calculating values of m, c and wind forecast of day 14 and 21.
Days Wind (km/h) X2 ∑xy
1 11 1 11
2 14 4 56
3 17 9 153
4 7 16 112
5 21 25 525
6 6 36 216
7 16 49 784
8 15 64 960
9 21 81 1701
10 20 100 2000
55 148 385 6518
∑x= 55 ∑y= 148 ∑X2=385 ∑xy=6518
6
tabler-icon-diamond-filled.svg

Paraphrase This Document

Need a fresh take? Get an instant paraphrase of this document with our AI Paraphraser
Document Page
This above model assists in determinative factor to assess the value of m in y = mx + c by
considering following steps, as follows:-
1. Value of M: M = N * ∑xy - ∑x * ∑y / N*∑x2 - ( ∑x )2
= 10*6518 – 55*148 / 10*385 – (55)2
= 65180 - 8140/ 3850- 3025
= 57040 / 825
= 69.14 of 69
2. Value of c: ∑y- m ∑x/ N
= 148 – 69*55 /10
= -231.5 or (231)
3. With the help of calculated 'm' and 'c' values wind speed is forecasted
Forecast wind for 14 day Y= mx+c
Y= 69*14+(-231)= 735 /24 hours = 30.625
= So the forecasted value of day 14 is 30.625 or 31 km/h.
Forecast wind for 21: Y= mx+c
Y= 69*21+ (-231) = 1218/ 24 hours = 50.75
= Therefore the wind speed for day 21 could be approx 50.75 km/h
CONCLUSION
From the above study, it was found that data is acquired and categorized in order to
acknowledge and assess functional features and patterns that assist in simple organizational
requirements analysis. In study value of statistical measures such as mean, model value, median
figure, ranges and risk or standard deviation has been assessed that ease in forecasting.
7
chevron_up_icon
1 out of 11
circle_padding
hide_on_mobile
zoom_out_icon
[object Object]