Numeracy and Data Analysis: Humidity Forecasting using Linear Model
VerifiedAdded on 2023/06/04
|12
|1336
|223
Homework Assignment
AI Summary
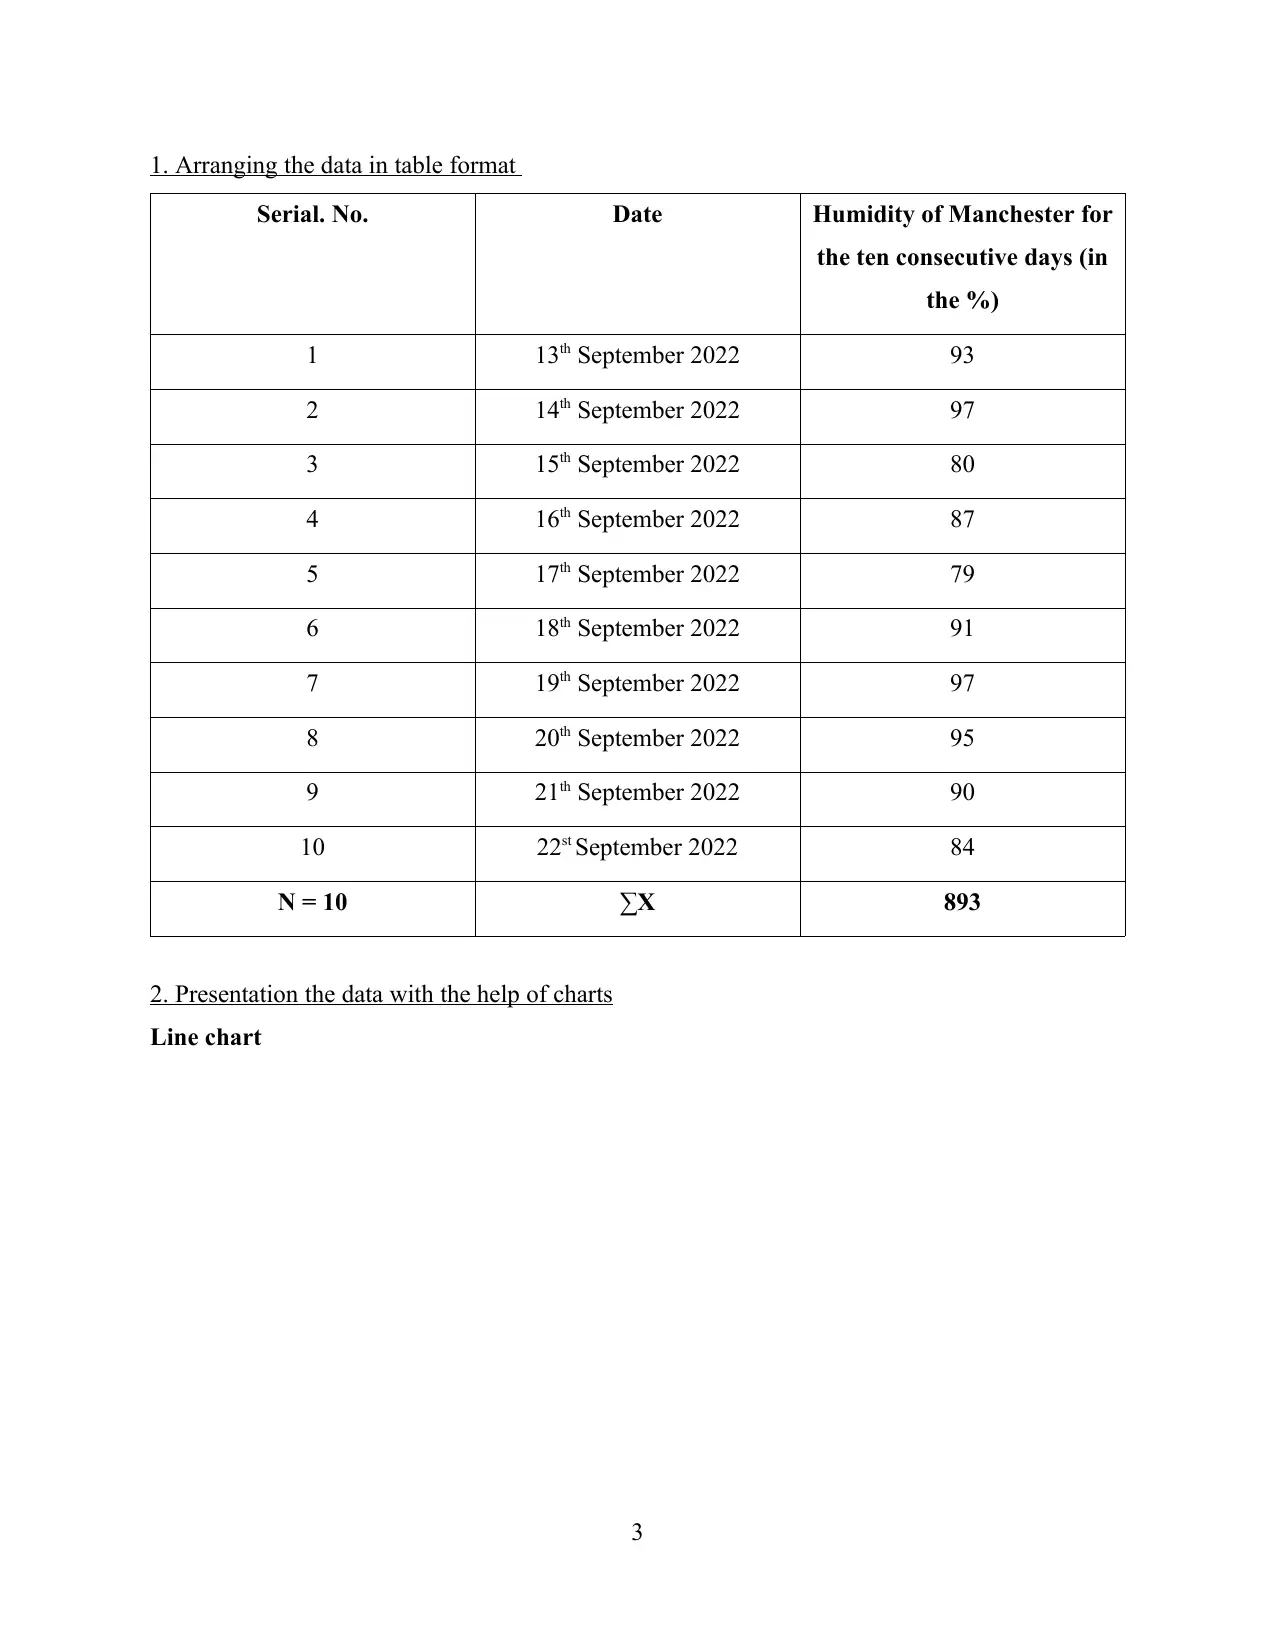
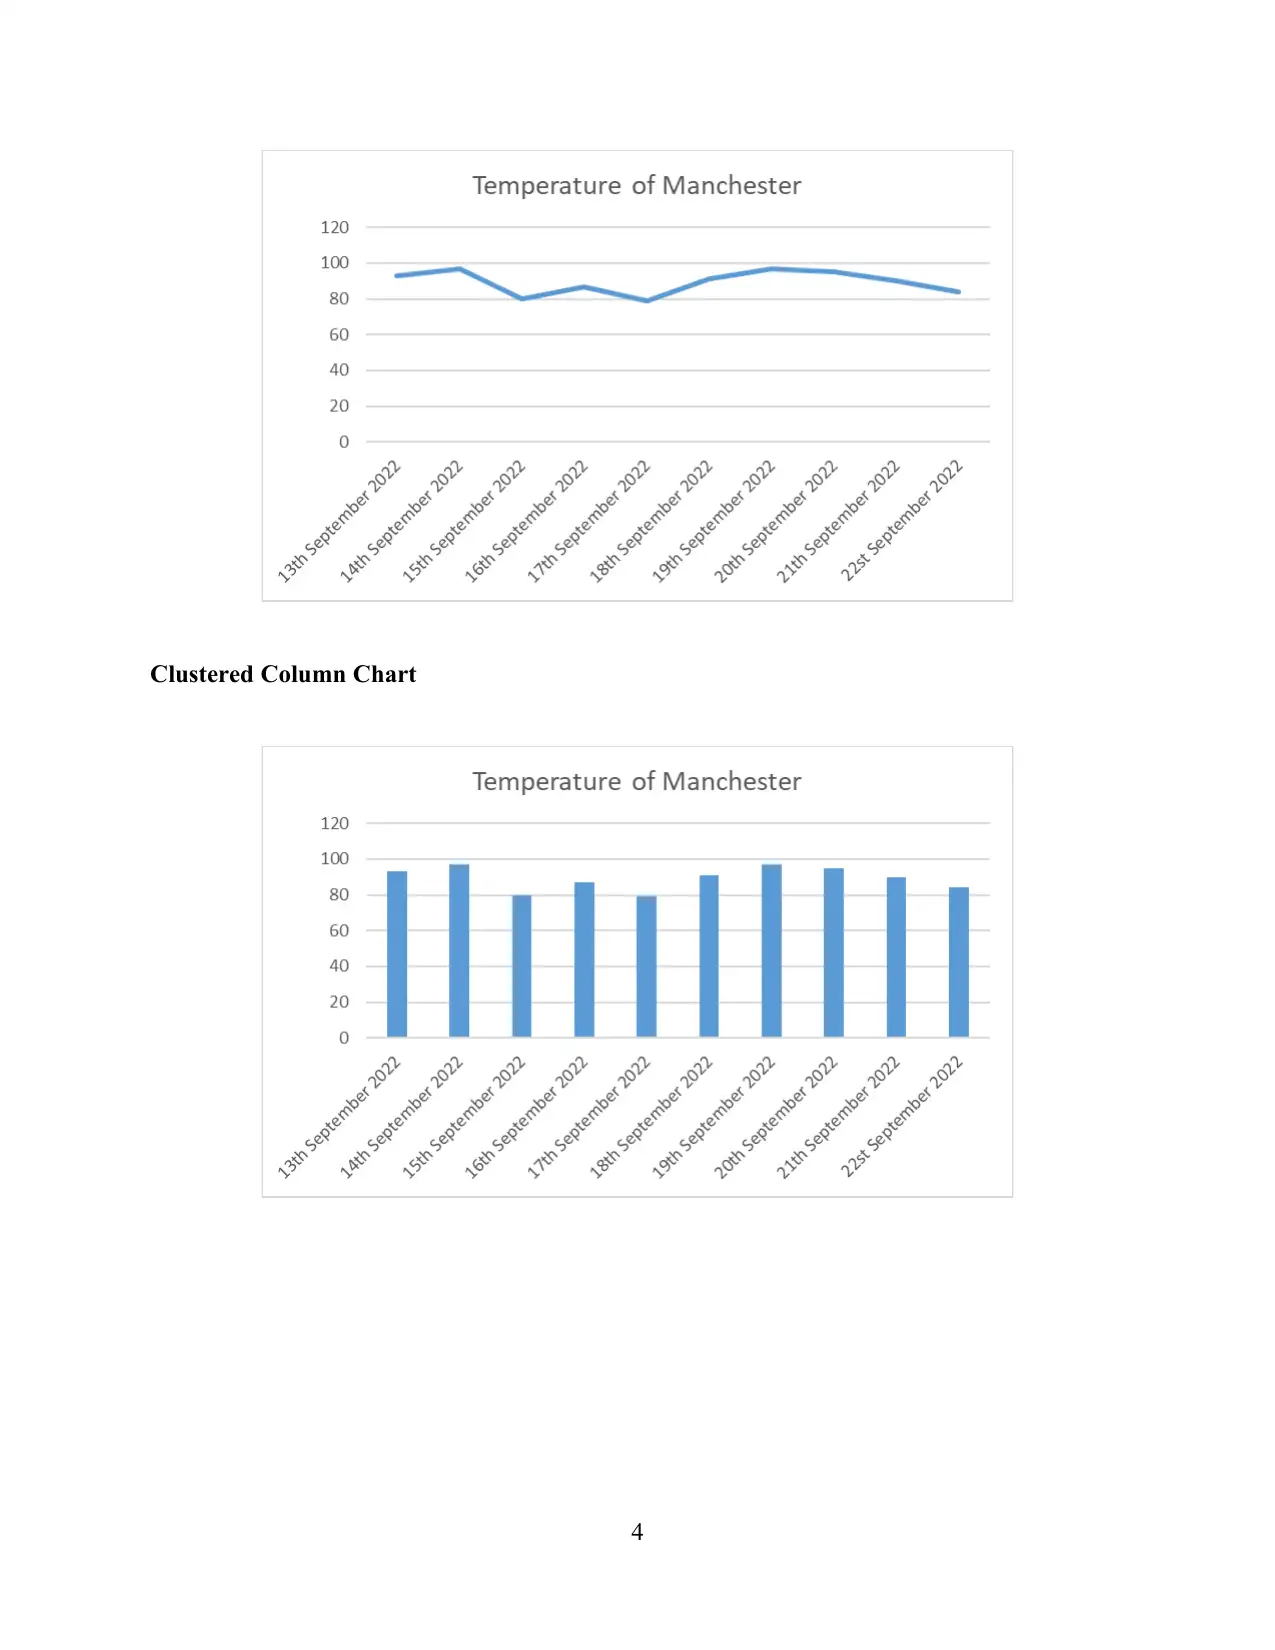
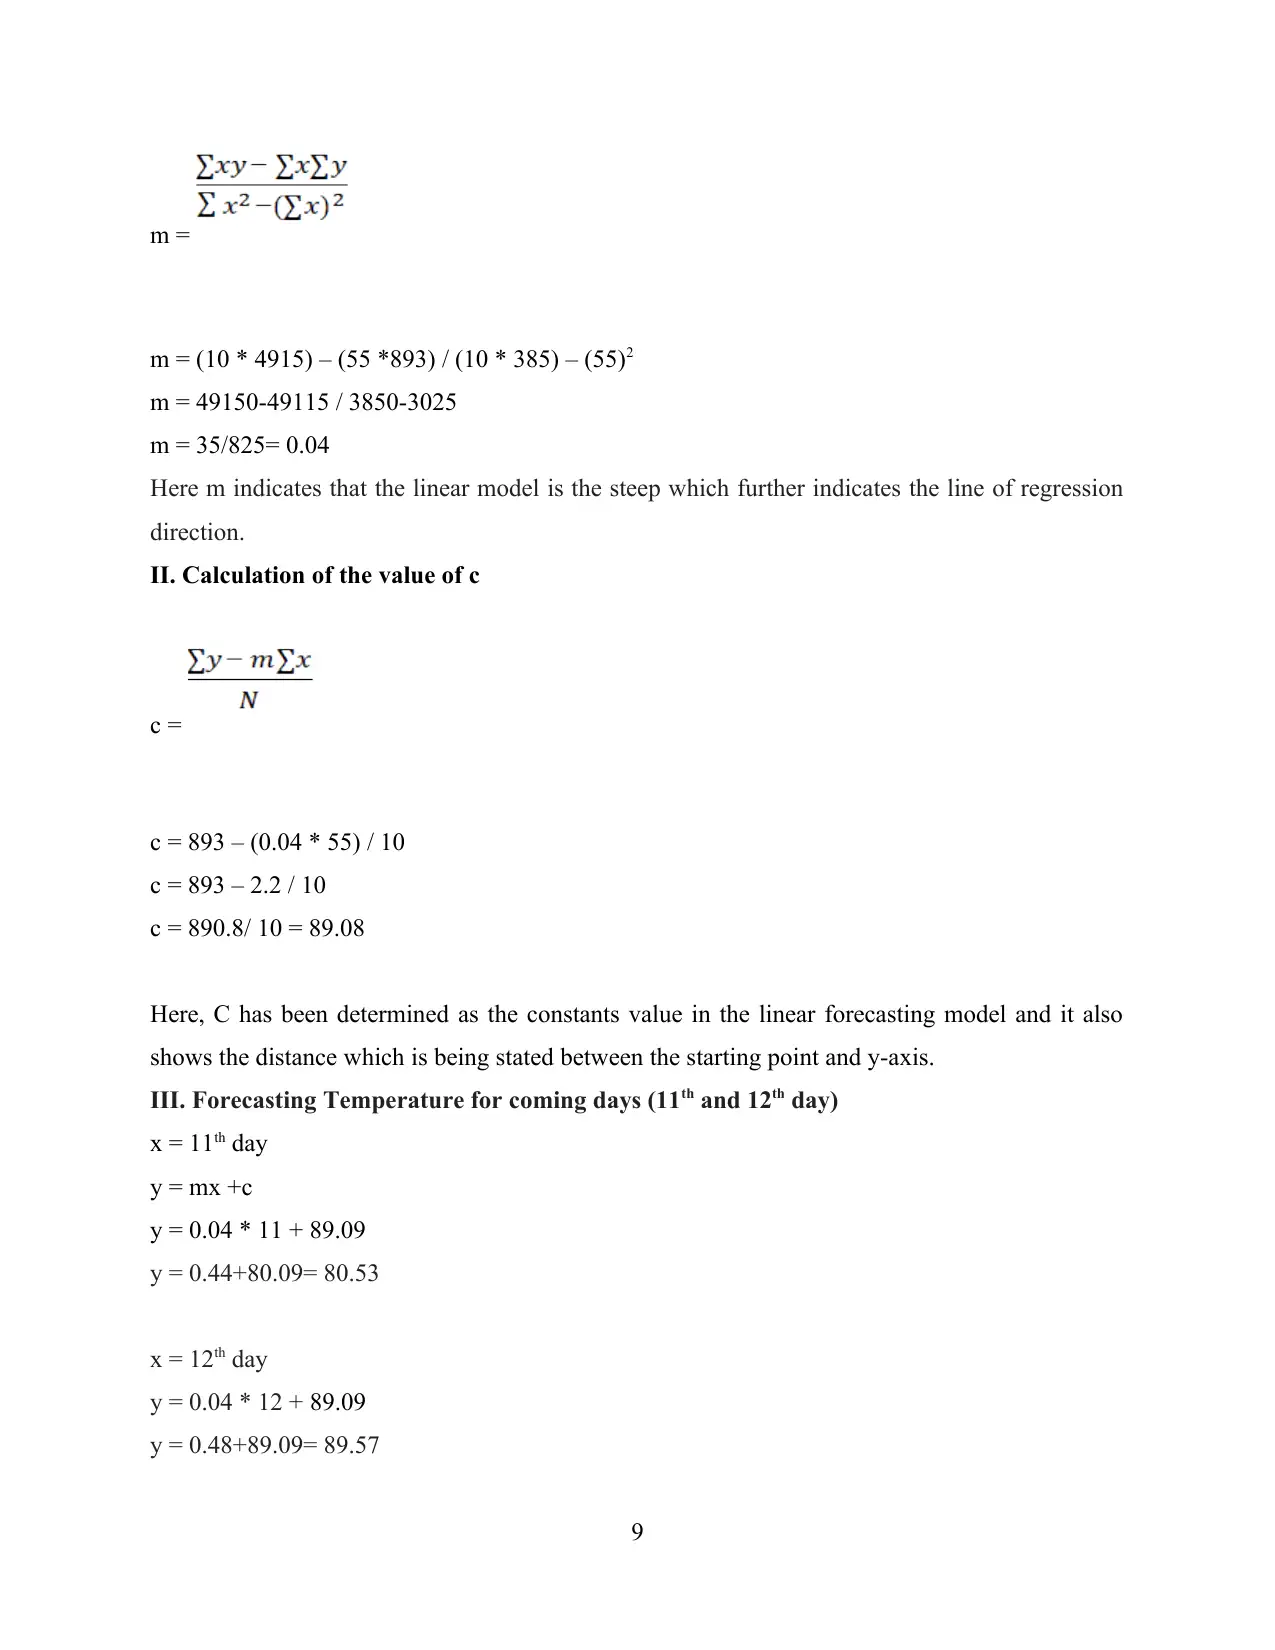
This assignment focuses on the analysis of humidity data collected in Manchester over ten consecutive days. The data is presented in a table and visualized using line and clustered column charts. Key statistical measures such as mean, median, mode, range, and standard deviation are calculated to understand the central tendency and dispersion of the data. Furthermore, a linear forecasting model is applied to predict humidity levels for the subsequent two days, demonstrating the application of statistical techniques in forecasting. The assignment concludes with a statement of the forecasted humidity values for the 11th and 12th days, providing a practical application of the analysis.

Numeracy and Data Analysis
1
1
Paraphrase This Document
Need a fresh take? Get an instant paraphrase of this document with our AI Paraphraser

TABLE OF CONTENTS
Numeracy and Data Analysis.....................................................................................................1
MAIN BODY..................................................................................................................................2
1. Arranging the data in table format...........................................................................................2
2. Presentation the data with the help of charts...........................................................................3
3. Steps for calculating and highlighting the final value.............................................................5
4. Using the linear forecasting model and forecasting the humidity of the future days..............8
REFERENCES..............................................................................................................................10
MAIN BODY
Collecting humidity of the Manchester for ten consecutive days
Temperature in the Manchester from 13th September to 22th September are as follows-
93, 97, 80, 87, 79, 91, 97, 95,90, 84.
2

1. Arranging the data in table format
Serial. No. Date Humidity of Manchester for
the ten consecutive days (in
the %)
1 13th September 2022 93
2 14th September 2022 97
3 15th September 2022 80
4 16th September 2022 87
5 17th September 2022 79
6 18th September 2022 91
7 19th September 2022 97
8 20th September 2022 95
9 21th September 2022 90
10 22st September 2022 84
N = 10 ∑X 893
2. Presentation the data with the help of charts
Line chart
3
⊘ This is a preview!⊘
Do you want full access?
Subscribe today to unlock all pages.

Trusted by 1+ million students worldwide

Clustered Column Chart
4
4
Paraphrase This Document
Need a fresh take? Get an instant paraphrase of this document with our AI Paraphraser

3. Steps for calculating and highlighting the final value
Mean- It has been defined as the average set of the values. The means is being calculated within
performing total of all the values and then the total value has been divided with the number of
the observation in the data set (Cao, 2021). Mean is the single value which presents the entire
data set. The symbol of mean is the x which depicted as x̄.
The Formula for mean is = x̄ = ∑X / n
∑X = 93+97+80+87+79+91+ 97+95+90+84= 893
n = 10
x̄ = 893 / 10 = 89.3
Median- It has been referred as the middle value which is being represented in the data set and
this can be obtained within arranging the data in the ascending and descending order. The
median value is where the value is 50% both the above and below it. The data set includes the
even number of the observations and within this, median can be analysed within totalling the two
numbers that are lying in the middle and which can be divided by the same number which is 2.
The median for the data set of temperature in Manchester for ten consecutive days is-
Serial No. Data in ascending order
1 79
2 80
3 84
4 87
5 90
6 91
7 93
8 95
9 97
10 97
5

The above table is representing the data set which is consist of the even numbers and the
observations that is 10. Also, there are two numbers which has been identified under the middle
which are 90 and 91. Thus, these values will be added and it will be divided by two and the
media of the data will be observed.
Median = 90 + 91 / 2 = 181 / 2 = 90.5
Mode- The mode is the value which appears mostly in the data set. The value is also determined
as the most visible value in the data set (Belan, 2020). The mode in the present data set is 97.
This is the frequent data series which is coming in the temperature of Manchester for 10
consecutive days.
Range- It has been determined as the measure of the dispersion which has been performed in the
data set. The range can be gathered within subtracting the lower data value from the higher data
value that can be identified in the data set. The highest value in the data set is 97 and the lowest
value is 79. Thus, the range of the data set will be
97-79 = 18.
Standard deviation- This has been determined as the statistics which measures the dispersion of
the data set at the time of calculating the mean. With the help of this, square root of the variance
can be calculated. The description of the small value in the standard deviation helps in indicating
the value of mean which is being represented in the data set in appropriate manner (McGrath and
et.al 2020). The steps which comes in determining the standard deviation are-
There must be the appropriate analysis and the calculation of the mean should be done for
the data set.
There should be the subtraction of the mean value from all the values that are individual
series and then the results should be squared.
There must be the summation of the square value and then, it should be divided with the
number of the observation made.
6
⊘ This is a preview!⊘
Do you want full access?
Subscribe today to unlock all pages.

Trusted by 1+ million students worldwide

There should be the placement of the results which has bene obtained under the third step
in the square root that helps in providing the standard deviation from the data set which
has been presented.
Formula - σ =
Serial.
No. Date
Temperature
of
Manchester
X- Mean (x- mean)^2
1 13th September 2022
93
3.7 13.69
2 14th September 2022
97
7.7 59.29
3 15th September 2022
80
-9.3 18.6
4 16th September 2022
87
-2.3 5.29
5 17th September 2022
79
-10.3 106.09
6 18th September 2022
91
1.7 2.89
7 19th September 2022
97
7.7 59.29
7
Paraphrase This Document
Need a fresh take? Get an instant paraphrase of this document with our AI Paraphraser

8 20th September 2022
95
5.7 32.49
9 21th September 2022
90
0.7 0.49
10 22st September 2022
84
-5.3 28.05
Mean 89.3 326.17
σ = √ 326.17 / 10 = 32.617
4. Using the linear forecasting model and forecasting the humidity of the future days
Serial. No.
X
Temperature of
Manchester Y
xy x2
1 93 93 1
2 97 194 4
3 80 240 9
4 87 348 16
5 79 395 25
6 91 546 36
7 97 679 49
8 95 760 64
9 90 810 81
10 84 840 100
55 893 4915 385
I- Calculating of the value of m
8

m =
m = (10 * 4915) – (55 *893) / (10 * 385) – (55)2
m = 49150-49115 / 3850-3025
m = 35/825= 0.04
Here m indicates that the linear model is the steep which further indicates the line of regression
direction.
II. Calculation of the value of c
c =
c = 893 – (0.04 * 55) / 10
c = 893 – 2.2 / 10
c = 890.8/ 10 = 89.08
Here, C has been determined as the constants value in the linear forecasting model and it also
shows the distance which is being stated between the starting point and y-axis.
III. Forecasting Temperature for coming days (11th and 12th day)
x = 11th day
y = mx +c
y = 0.04 * 11 + 89.09
y = 0.44+80.09= 80.53
x = 12th day
y = 0.04 * 12 + 89.09
y = 0.48+89.09= 89.57
9
⊘ This is a preview!⊘
Do you want full access?
Subscribe today to unlock all pages.

Trusted by 1+ million students worldwide

The final result Statement- The temperature in the Manchester on 11th and 12th day will be
80.53 and 89.57 respectively.
10
80.53 and 89.57 respectively.
10
Paraphrase This Document
Need a fresh take? Get an instant paraphrase of this document with our AI Paraphraser

REFERENCES
Books and journals
Belan, S., 2020. Median and mode in first passage under restart. Physical Review Research. 2(1).
p.013243.
Cao, W., 2021. Discussion on Mean, Median, Mode and its Validity and Table Number. Journal
of Contemporary Educational Research. 5(3).
McGrath and et.al 2020. Estimating the sample mean and standard deviation from commonly
reported quantiles in meta-analysis. Statistical methods in medical research. 29(9).
pp.2520-2537.
11

12
⊘ This is a preview!⊘
Do you want full access?
Subscribe today to unlock all pages.

Trusted by 1+ million students worldwide
1 out of 12
Related Documents

Your All-in-One AI-Powered Toolkit for Academic Success.
+13062052269
info@desklib.com
Available 24*7 on WhatsApp / Email
Unlock your academic potential
Copyright © 2020–2025 A2Z Services. All Rights Reserved. Developed and managed by ZUCOL.