Data Analysis and Linear Programming: A Comprehensive Assignment

Verified

Added on  2022/11/29

|12
|1171
|416
Homework Assignment
AI Summary
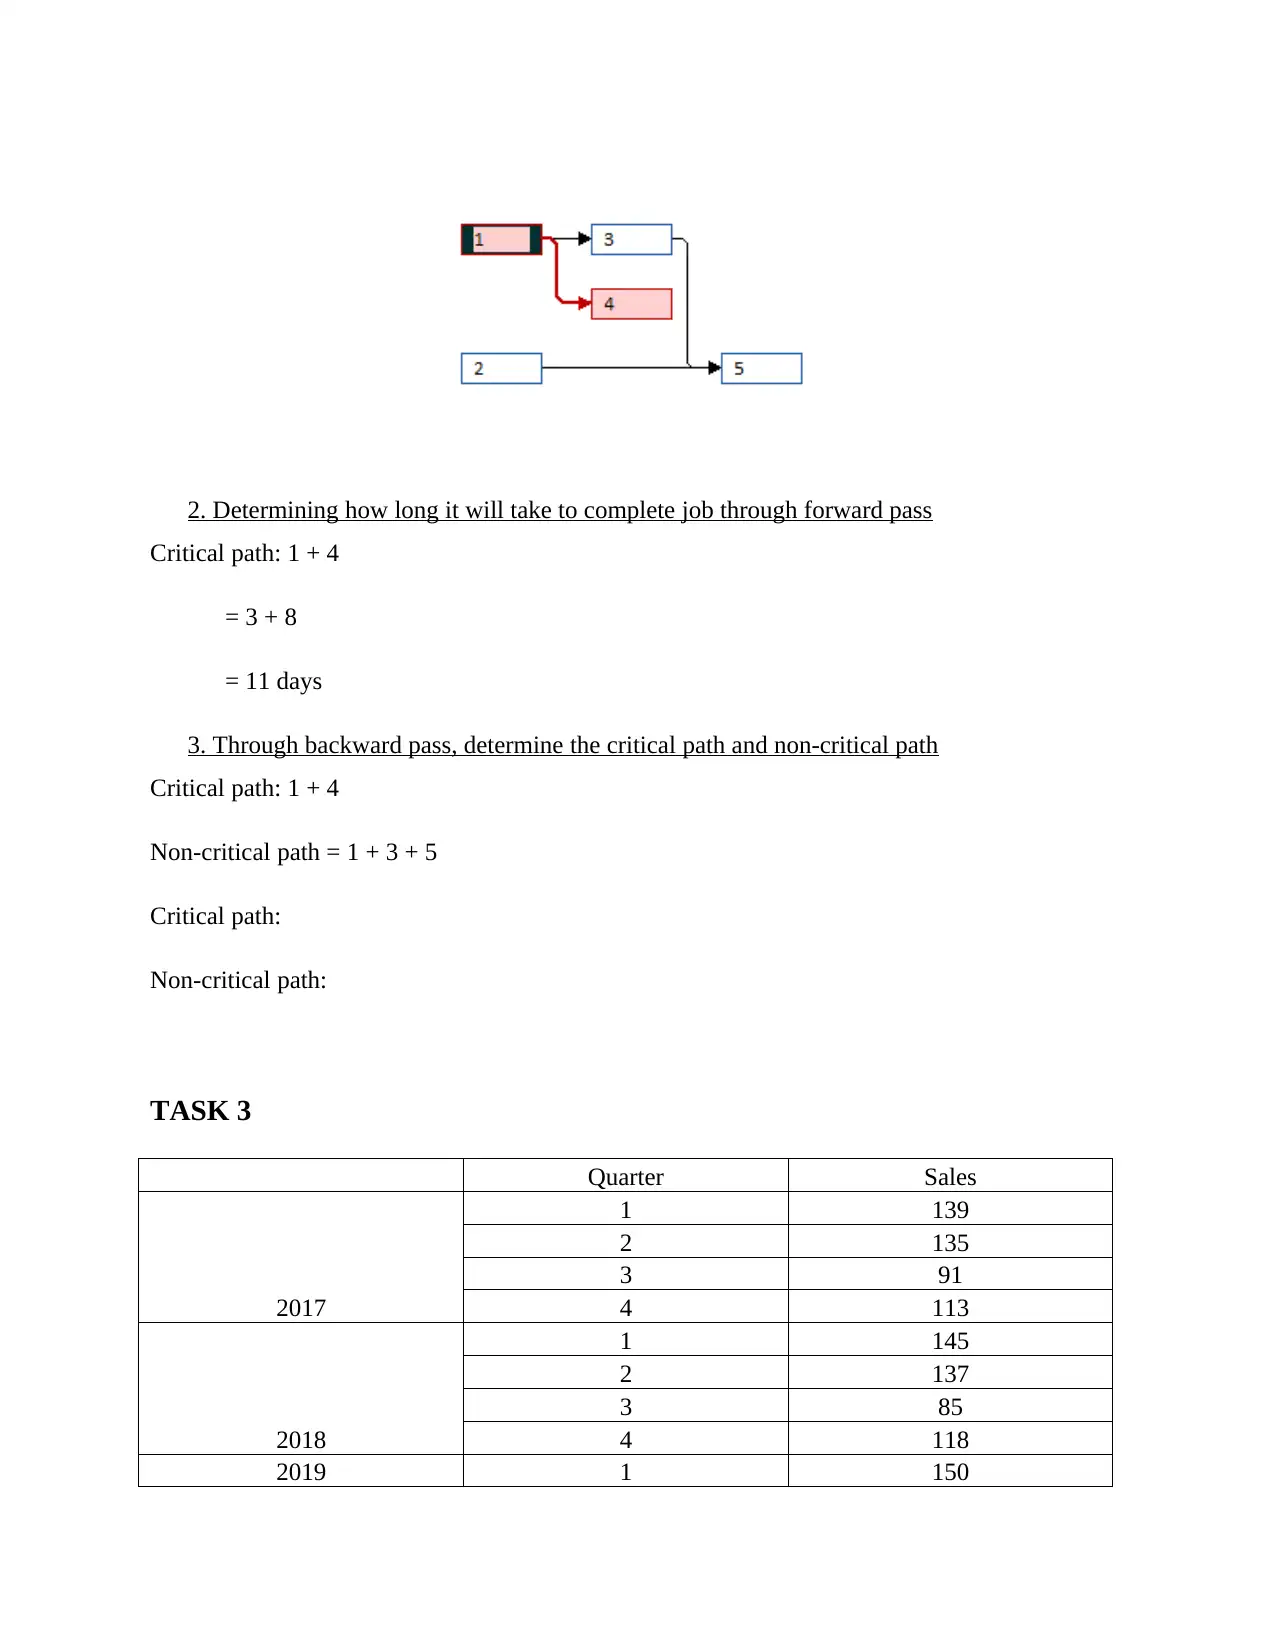
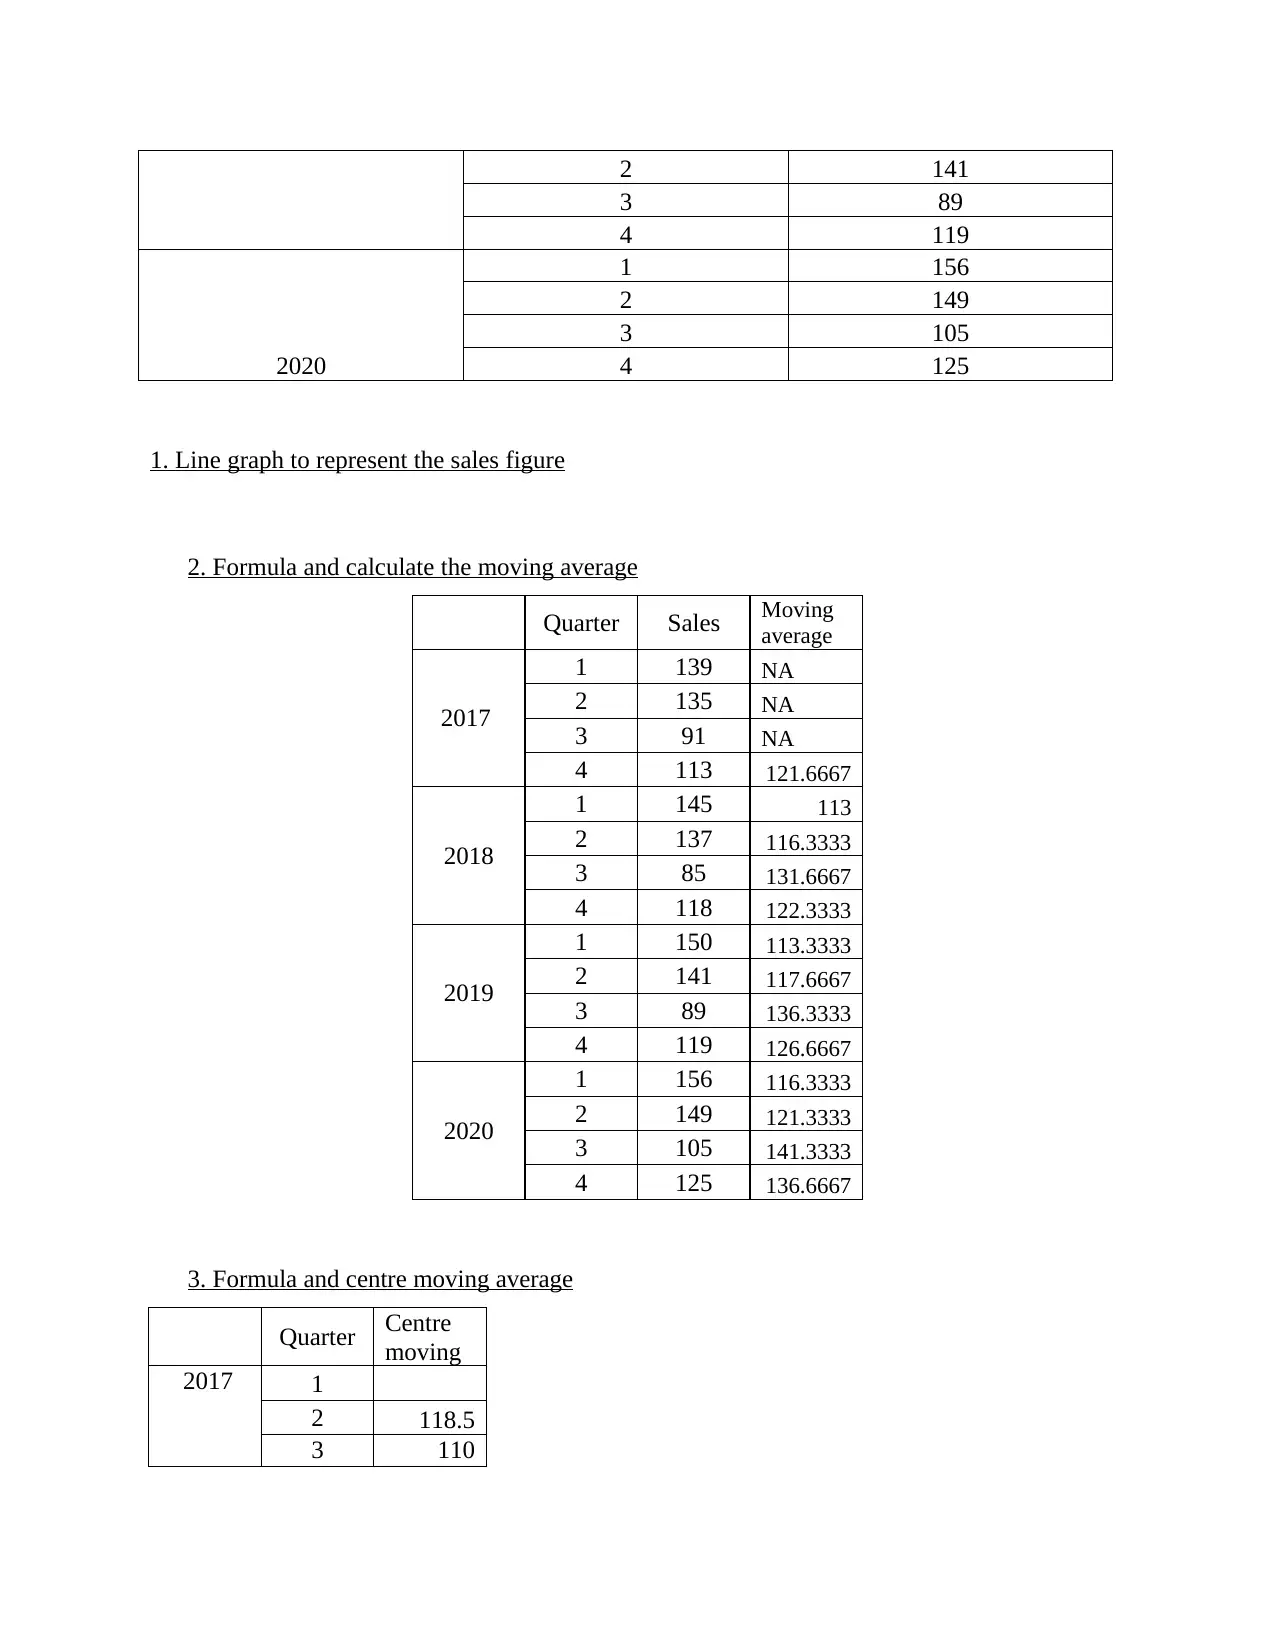
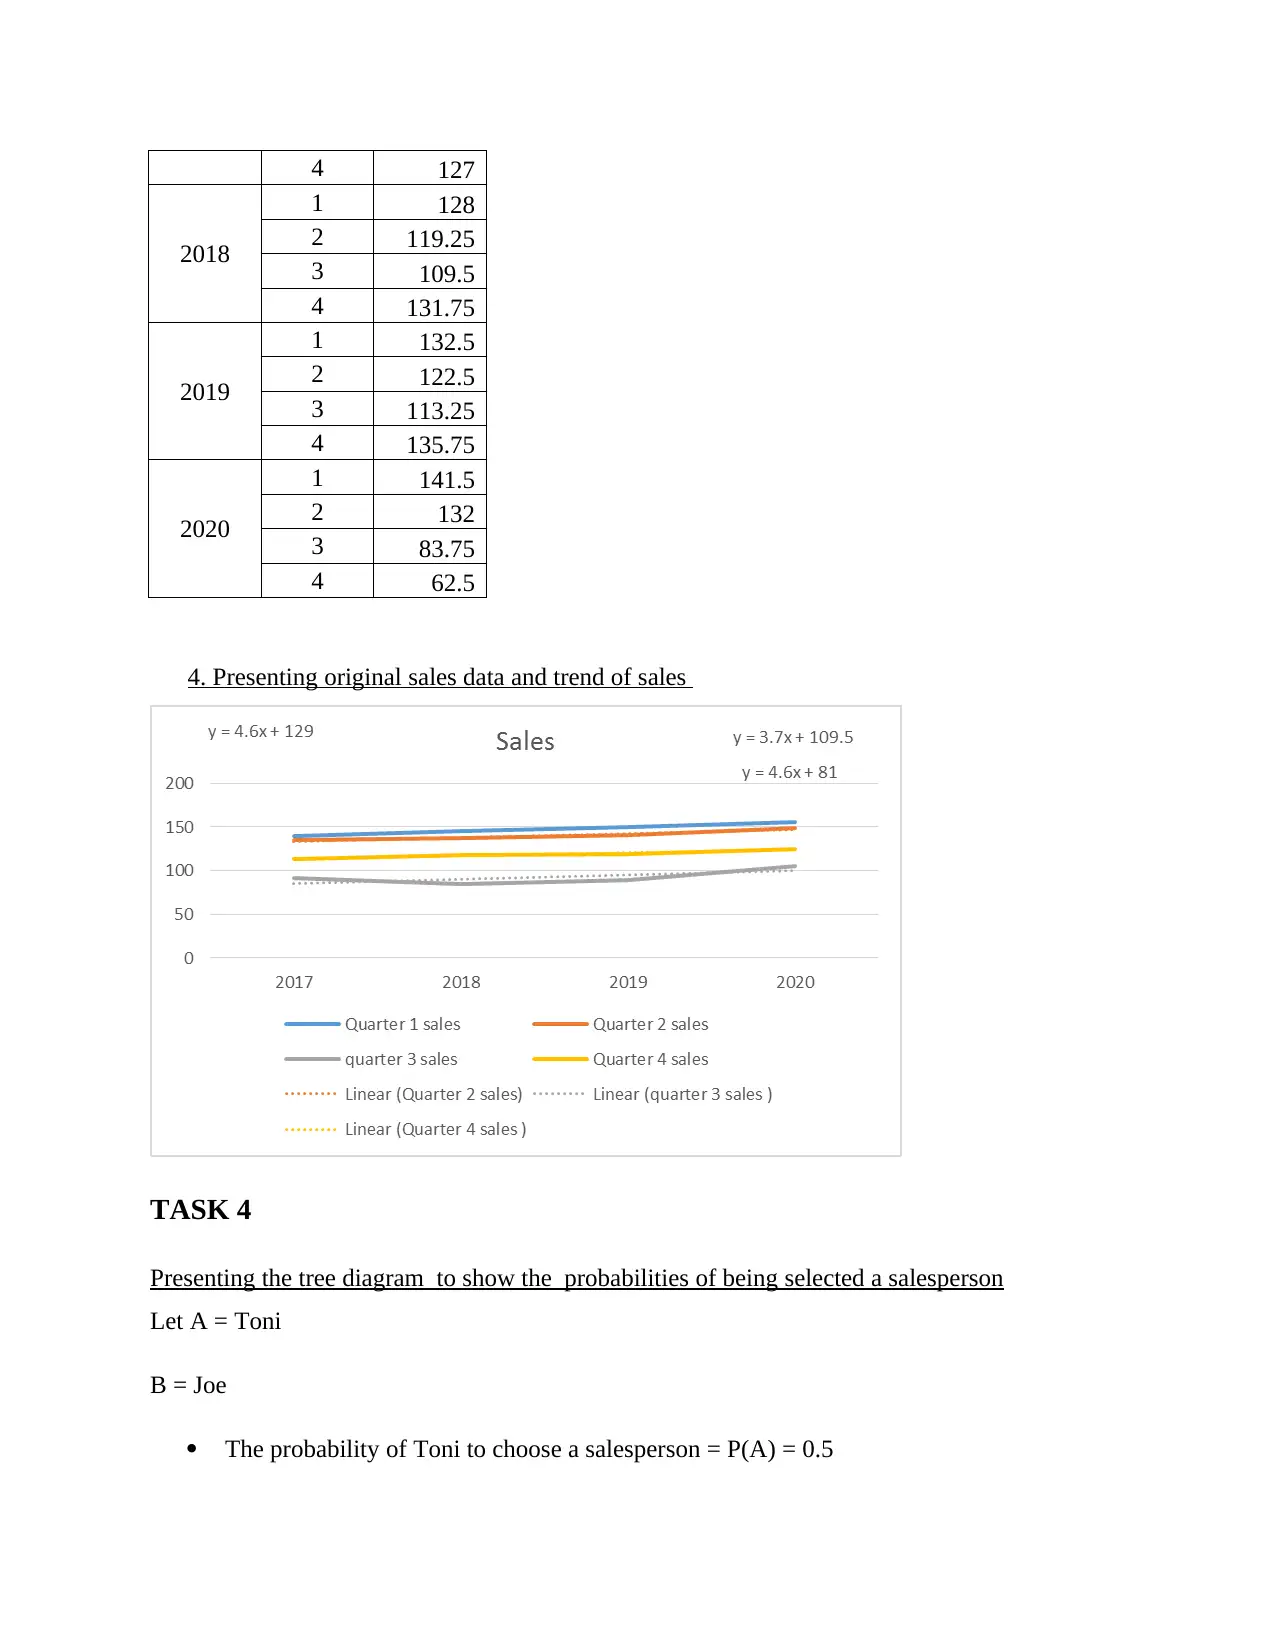
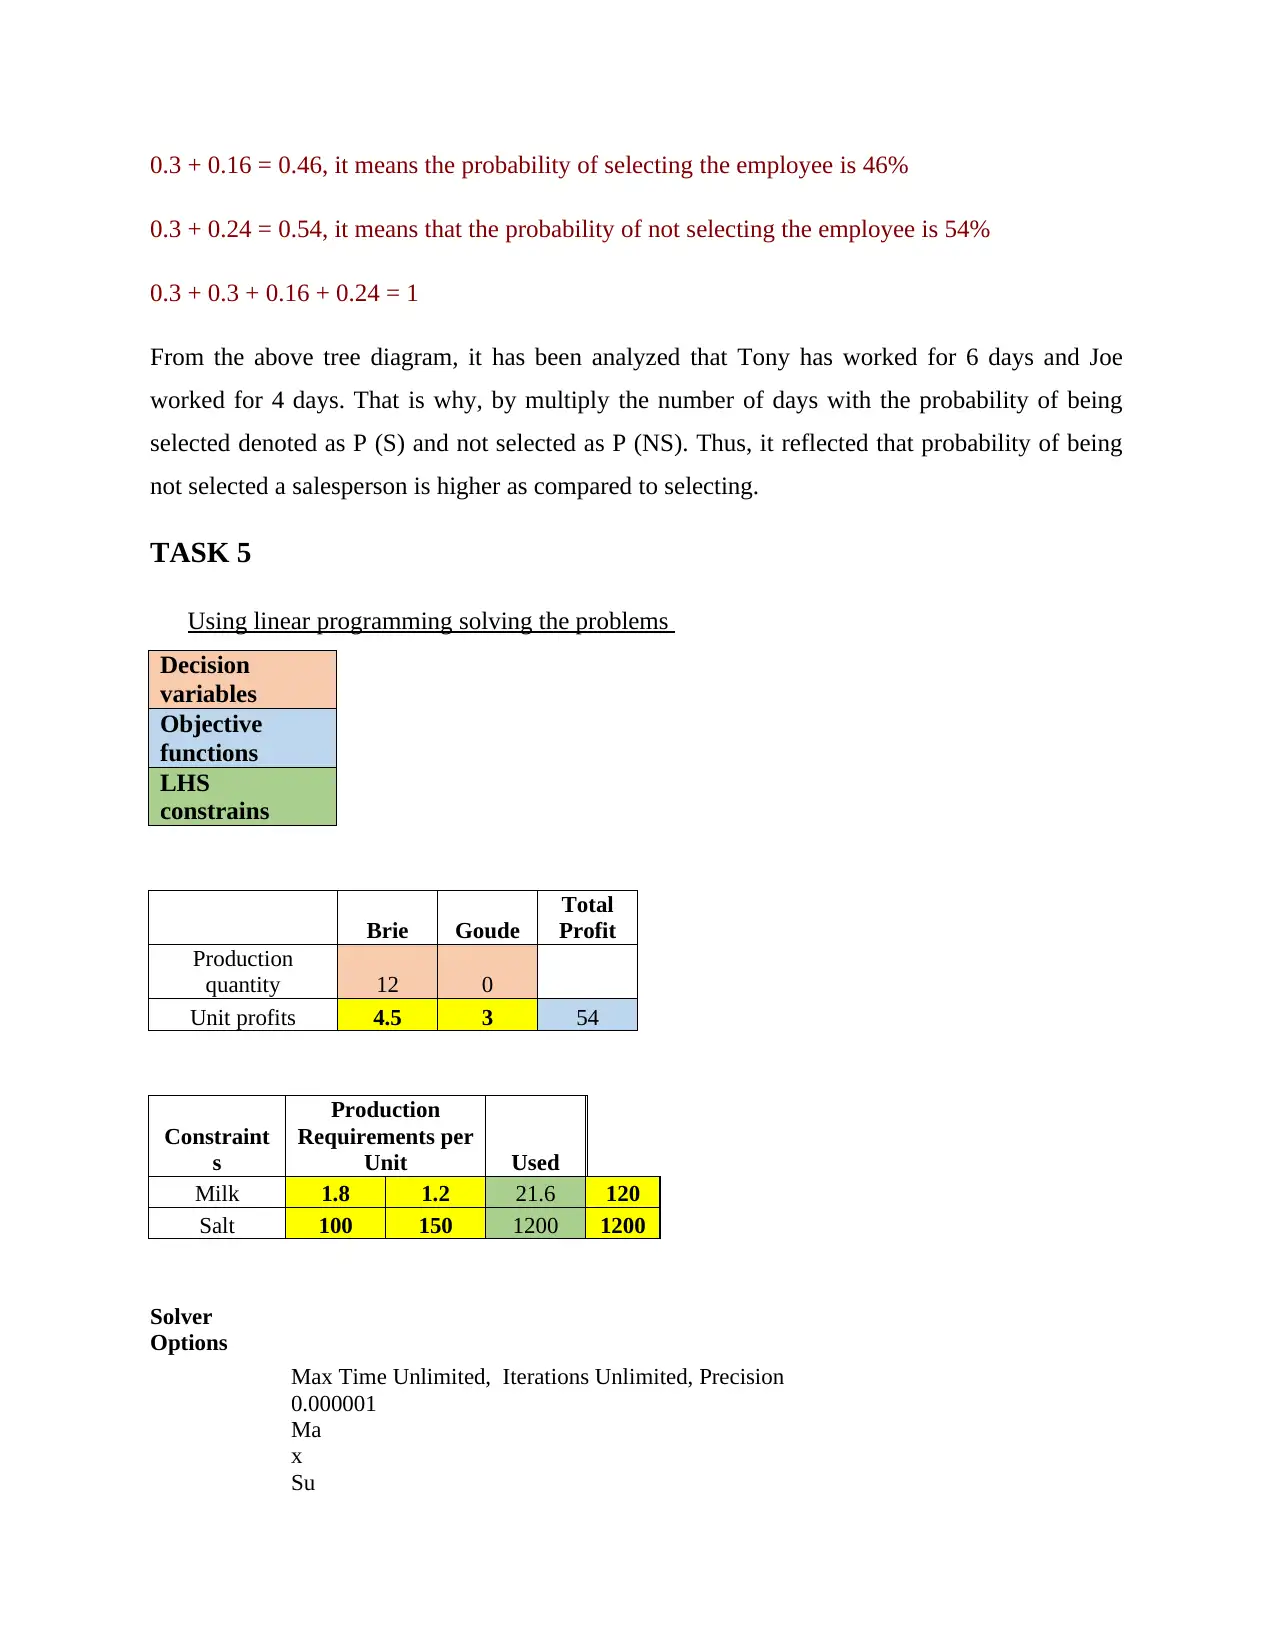
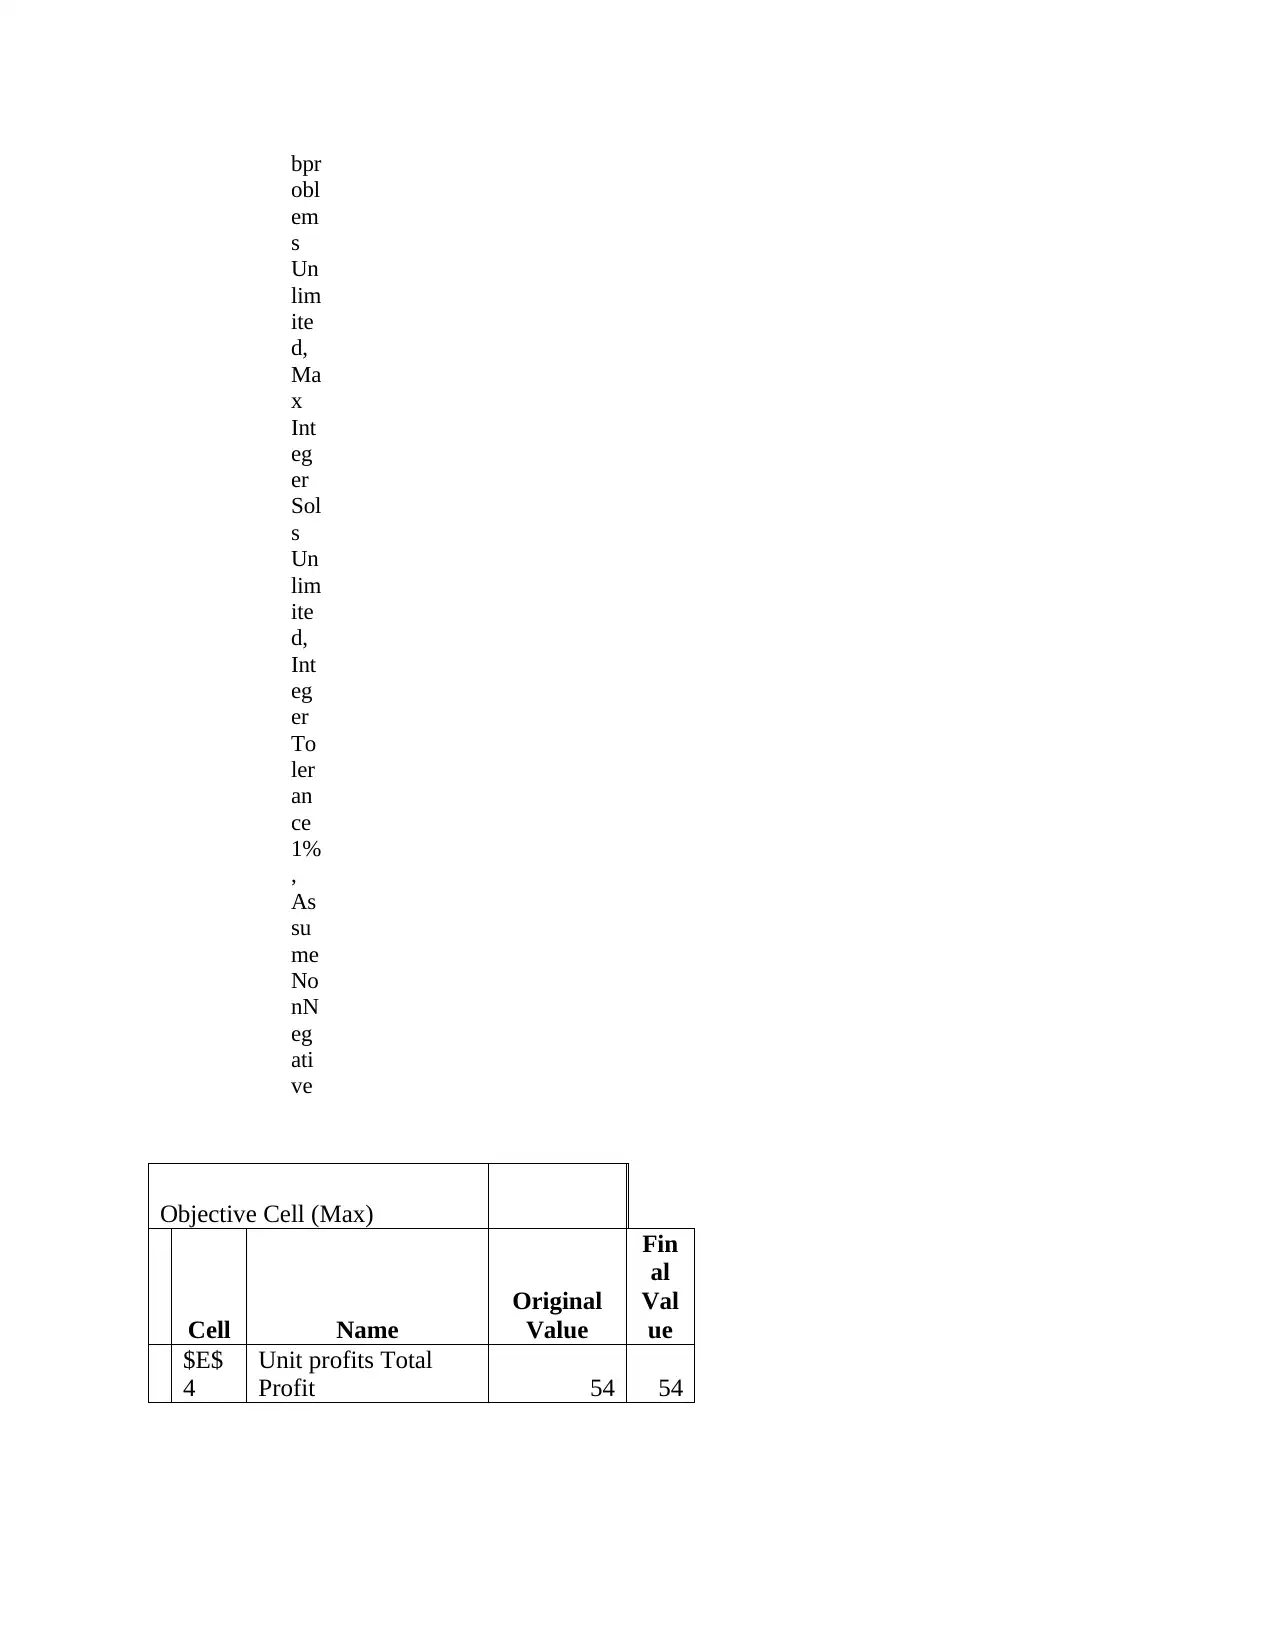
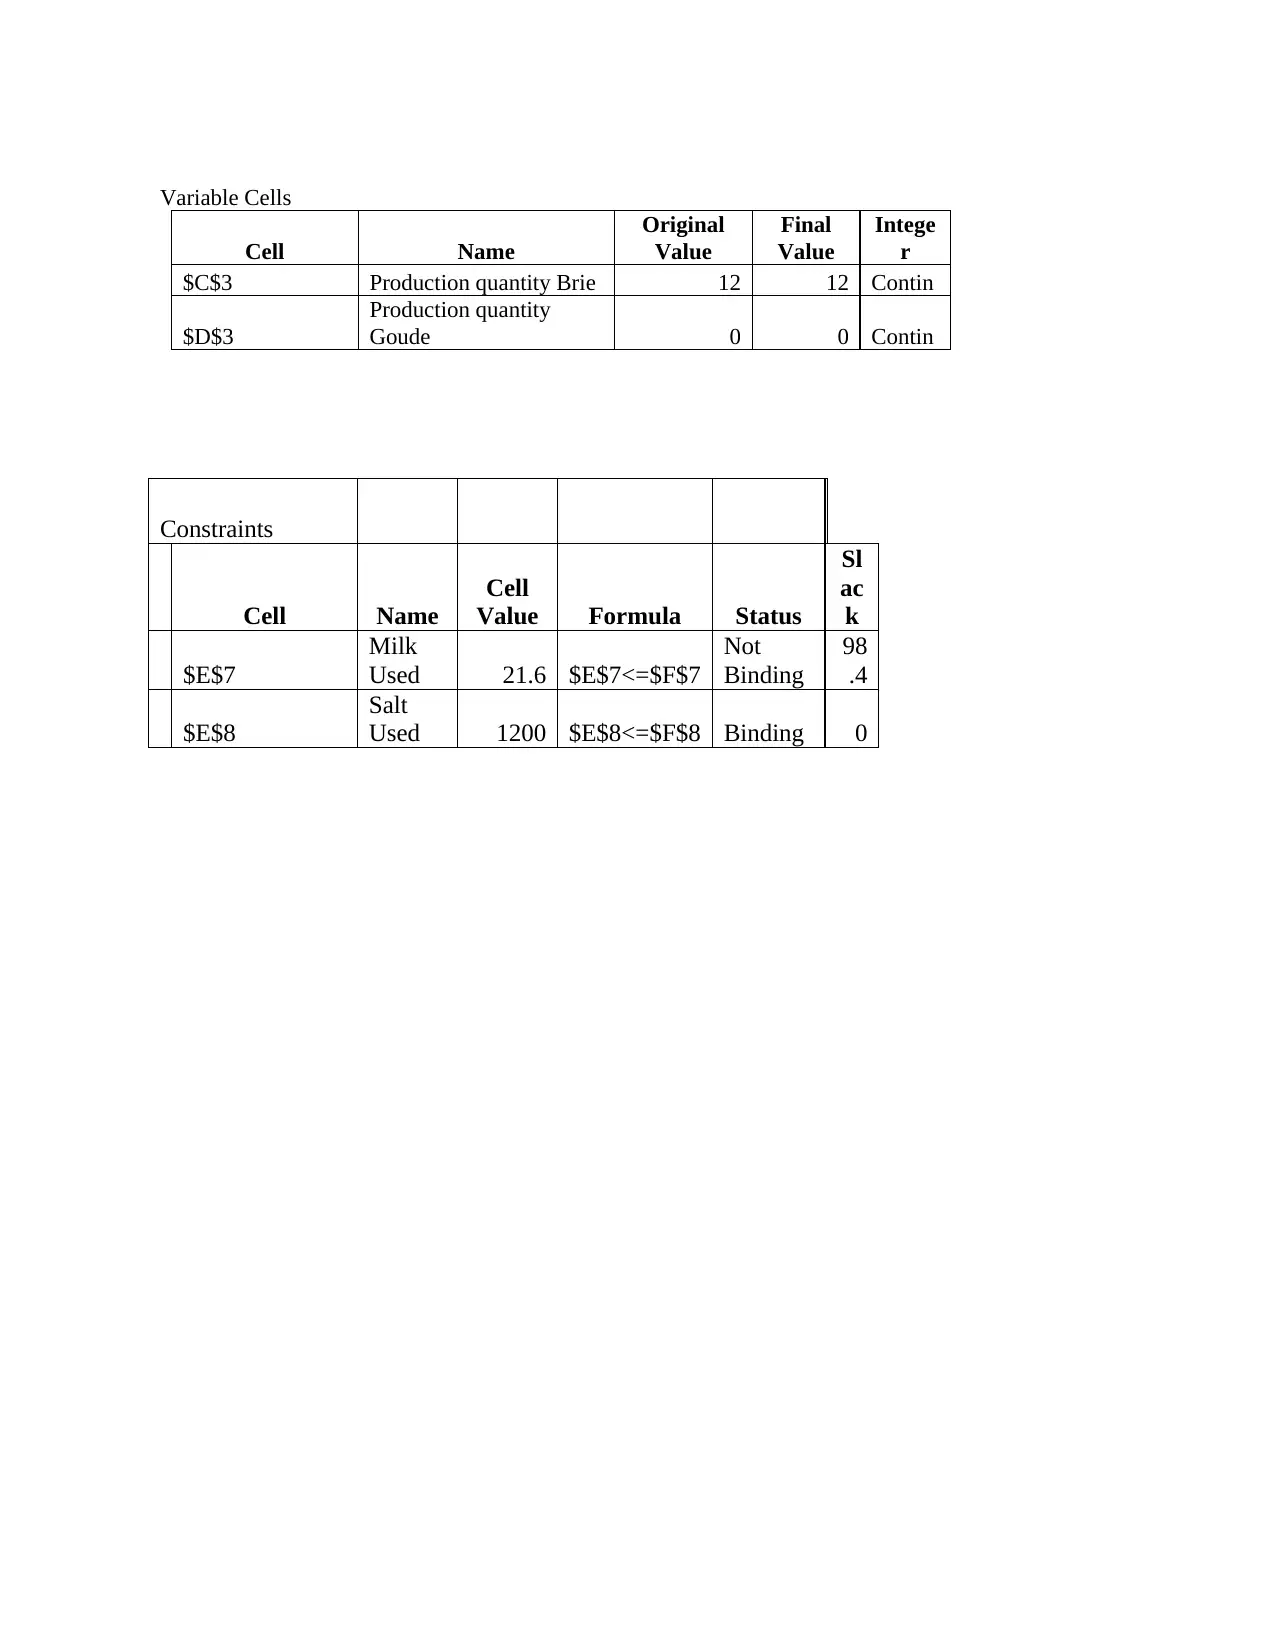
This assignment solution covers various aspects of data analysis and management. Task 1 focuses on labeling codes, generating frequency and percentage frequency tables using pivot tables, creating graphical representations, and calculating descriptive statistics. Task 2 involves presenting a network diagram, determining project completion time through forward pass, and identifying the critical and non-critical paths using backward pass. Task 3 centers on creating a line graph for sales figures, calculating moving averages, and presenting the original sales data with trends. Task 4 presents a tree diagram to show probabilities, and Task 5 utilizes linear programming to solve problems. The assignment demonstrates a comprehensive understanding of data analysis techniques and their practical applications.
tabler-icon-diamond-filled.svg

Contribute Materials

Your contribution can guide someone’s learning journey. Share your documents today.
Document Page
Using and managing Data and Information
tabler-icon-diamond-filled.svg

Secure Best Marks with AI Grader

Need help grading? Try our AI Grader for instant feedback on your assignments.
Document Page
TABLE OF CONTENTS
TASK 1............................................................................................................................................3
1. Label the codes for categories .................................................................................................3
2. Producing frequency and percentage frequency tables using Pivot tables..............................3
3. Graphical representation for each variable..............................................................................4
4. Descriptive statistic of Spending £..........................................................................................5
TASK 2............................................................................................................................................5
1.Presenting the network diagram of the sequence of activities..................................................5
2. Determining how long it will take to complete job through forward pass..............................6
3. Through backward pass, determine the critical path and non-critical path.............................6
TASK 3............................................................................................................................................6
1. Line graph to represent the sales figure...................................................................................7
2. Formula and calculate the moving average.............................................................................7
3. Formula and centre moving average........................................................................................7
4. Presenting original sales data and trend of sales .....................................................................8
TASK 4............................................................................................................................................8
Presenting the tree diagram to show the probabilities of being selected a salesperson.............8
TASK 5..........................................................................................................................................10
Using linear programming solving the problems ......................................................................10
Document Page
TASK 1
1. Label the codes for categories
Customer Gender Age Education SSC user
1 Male 35 to 47 A' level or
diploma
Yes
2 Female 61 and over Degree or further No
3 Female 35 to 47 GCSE or below Yes
4 Female 61 and over GCSE or below No
5 Female 48 to 60 Degree or further No
2. Producing frequency and percentage frequency tables using Pivot tables
Gender
Particulars Frequency
%
frequenc
y
Male 20 40%
Female 30 60%
Grand Total 50 100%
Education
Particulars Frequency
%
frequency
GCSE or
below 20 40%
A’ Level or
Diploma 16 32%
Degree or
further 14 28%
Document Page
Grand Total 50 100%
Age
Particulars Frequency
%
frequency
Less than 21 2 4%
21 to 34 5 10%
35 to 47 10 20%
48 to 60 26 52%
61 and over 7 14%
Grand Total 50 100%
SCC user
Particulars Frequency
%
frequenc
y
Yes 17 34%
No 33 66%
Grand Total 50 100%
Spending
Particulars Frequency
%
frequency
<100 1 10%
100-109 6 12%
110-119 23 46%
120-129 18 36%
130-140 2 4%
>140 0 0%
Grand Total 50 100%
3. Graphical representation for each variable
Education
tabler-icon-diamond-filled.svg

Secure Best Marks with AI Grader

Need help grading? Try our AI Grader for instant feedback on your assignments.
Document Page
Age
Spending
4. Descriptive statistic of Spending £
Particulars Spending (£)
Mean 117.5
Median 118.5
Minimum 92
Maximum 131
Quartile 1 112
Quartile 2 118.5
Quartile 3 122.25
TASK 2
1. Presenting the network diagram of the sequence of activities
Task
Mode
Task
Name Duration Start Finish Predecessors
1 A 3 days Thu 6/10/21 Mon 6/14/21
2 B 3 days Thu 6/10/21 Mon 6/14/21
3 C 4 days Tue 6/15/21 Fri 6/18/21 1
4 D 8 days Tue 6/15/21 Thu 6/24/21 1
5 E 2 days Mon 6/21/21 Tue 6/22/21 2,3
Document Page
2. Determining how long it will take to complete job through forward pass
Critical path: 1 + 4
= 3 + 8
= 11 days
3. Through backward pass, determine the critical path and non-critical path
Critical path: 1 + 4
Non-critical path = 1 + 3 + 5
Critical path:
Non-critical path:
TASK 3
Quarter Sales
2017
1 139
2 135
3 91
4 113
2018
1 145
2 137
3 85
4 118
2019 1 150
Document Page
2 141
3 89
4 119
2020
1 156
2 149
3 105
4 125
1. Line graph to represent the sales figure
2. Formula and calculate the moving average
Quarter Sales Moving
average
2017
1 139 NA
2 135 NA
3 91 NA
4 113 121.6667
2018
1 145 113
2 137 116.3333
3 85 131.6667
4 118 122.3333
2019
1 150 113.3333
2 141 117.6667
3 89 136.3333
4 119 126.6667
2020
1 156 116.3333
2 149 121.3333
3 105 141.3333
4 125 136.6667
3. Formula and centre moving average
Quarter Centre
moving
2017 1
2 118.5
3 110
tabler-icon-diamond-filled.svg

Paraphrase This Document

Need a fresh take? Get an instant paraphrase of this document with our AI Paraphraser
Document Page
4 127
2018
1 128
2 119.25
3 109.5
4 131.75
2019
1 132.5
2 122.5
3 113.25
4 135.75
2020
1 141.5
2 132
3 83.75
4 62.5
4. Presenting original sales data and trend of sales
TASK 4
Presenting the tree diagram to show the probabilities of being selected a salesperson
Let A = Toni
B = Joe
The probability of Toni to choose a salesperson = P(A) = 0.5
Document Page
The probability of Joe to choose a salesperson = P(B) = 0.4
P (Salesperson chosen by both) = P (A and B) = 0 (as only one manager works in a day)
P (A OR B) = P (A) + P (B) – P (A and B)
= 0.5 + 0.4 – 0 = 0.8
Hence, this reflected that probability of a salesperson selected by either manager Toni and
Joe is 0.8
Document Page
0.3 + 0.16 = 0.46, it means the probability of selecting the employee is 46%
0.3 + 0.24 = 0.54, it means that the probability of not selecting the employee is 54%
0.3 + 0.3 + 0.16 + 0.24 = 1
From the above tree diagram, it has been analyzed that Tony has worked for 6 days and Joe
worked for 4 days. That is why, by multiply the number of days with the probability of being
selected denoted as P (S) and not selected as P (NS). Thus, it reflected that probability of being
not selected a salesperson is higher as compared to selecting.
TASK 5
Using linear programming solving the problems
Decision
variables
Objective
functions
LHS
constrains
Brie Goude
Total
Profit
Production
quantity 12 0
Unit profits 4.5 3 54
Constraint
s
Production
Requirements per
Unit Used
Milk 1.8 1.2 21.6 120
Salt 100 150 1200 1200
Solver
Options
Max Time Unlimited, Iterations Unlimited, Precision
0.000001
Ma
x
Su
tabler-icon-diamond-filled.svg

Secure Best Marks with AI Grader

Need help grading? Try our AI Grader for instant feedback on your assignments.
Document Page
bpr
obl
em
s
Un
lim
ite
d,
Ma
x
Int
eg
er
Sol
s
Un
lim
ite
d,
Int
eg
er
To
ler
an
ce
1%
,
As
su
me
No
nN
eg
ati
ve
Objective Cell (Max)
Cell Name
Original
Value
Fin
al
Val
ue
$E$
4
Unit profits Total
Profit 54 54
Document Page
Variable Cells
Cell Name
Original
Value
Final
Value
Intege
r
$C$3 Production quantity Brie 12 12 Contin
$D$3
Production quantity
Goude 0 0 Contin
Constraints
Cell Name
Cell
Value Formula Status
Sl
ac
k
$E$7
Milk
Used 21.6 $E$7<=$F$7
Not
Binding
98
.4
$E$8
Salt
Used 1200 $E$8<=$F$8 Binding 0
chevron_up_icon
1 out of 12
circle_padding
hide_on_mobile
zoom_out_icon
logo.png

Your All-in-One AI-Powered Toolkit for Academic Success.

Available 24*7 on WhatsApp / Email

[object Object]