Analysis of London Humidity Data: A Numeracy and Data Analysis Report

Verified

Added on  2023/01/12

|9
|1267
|39
Report
AI Summary
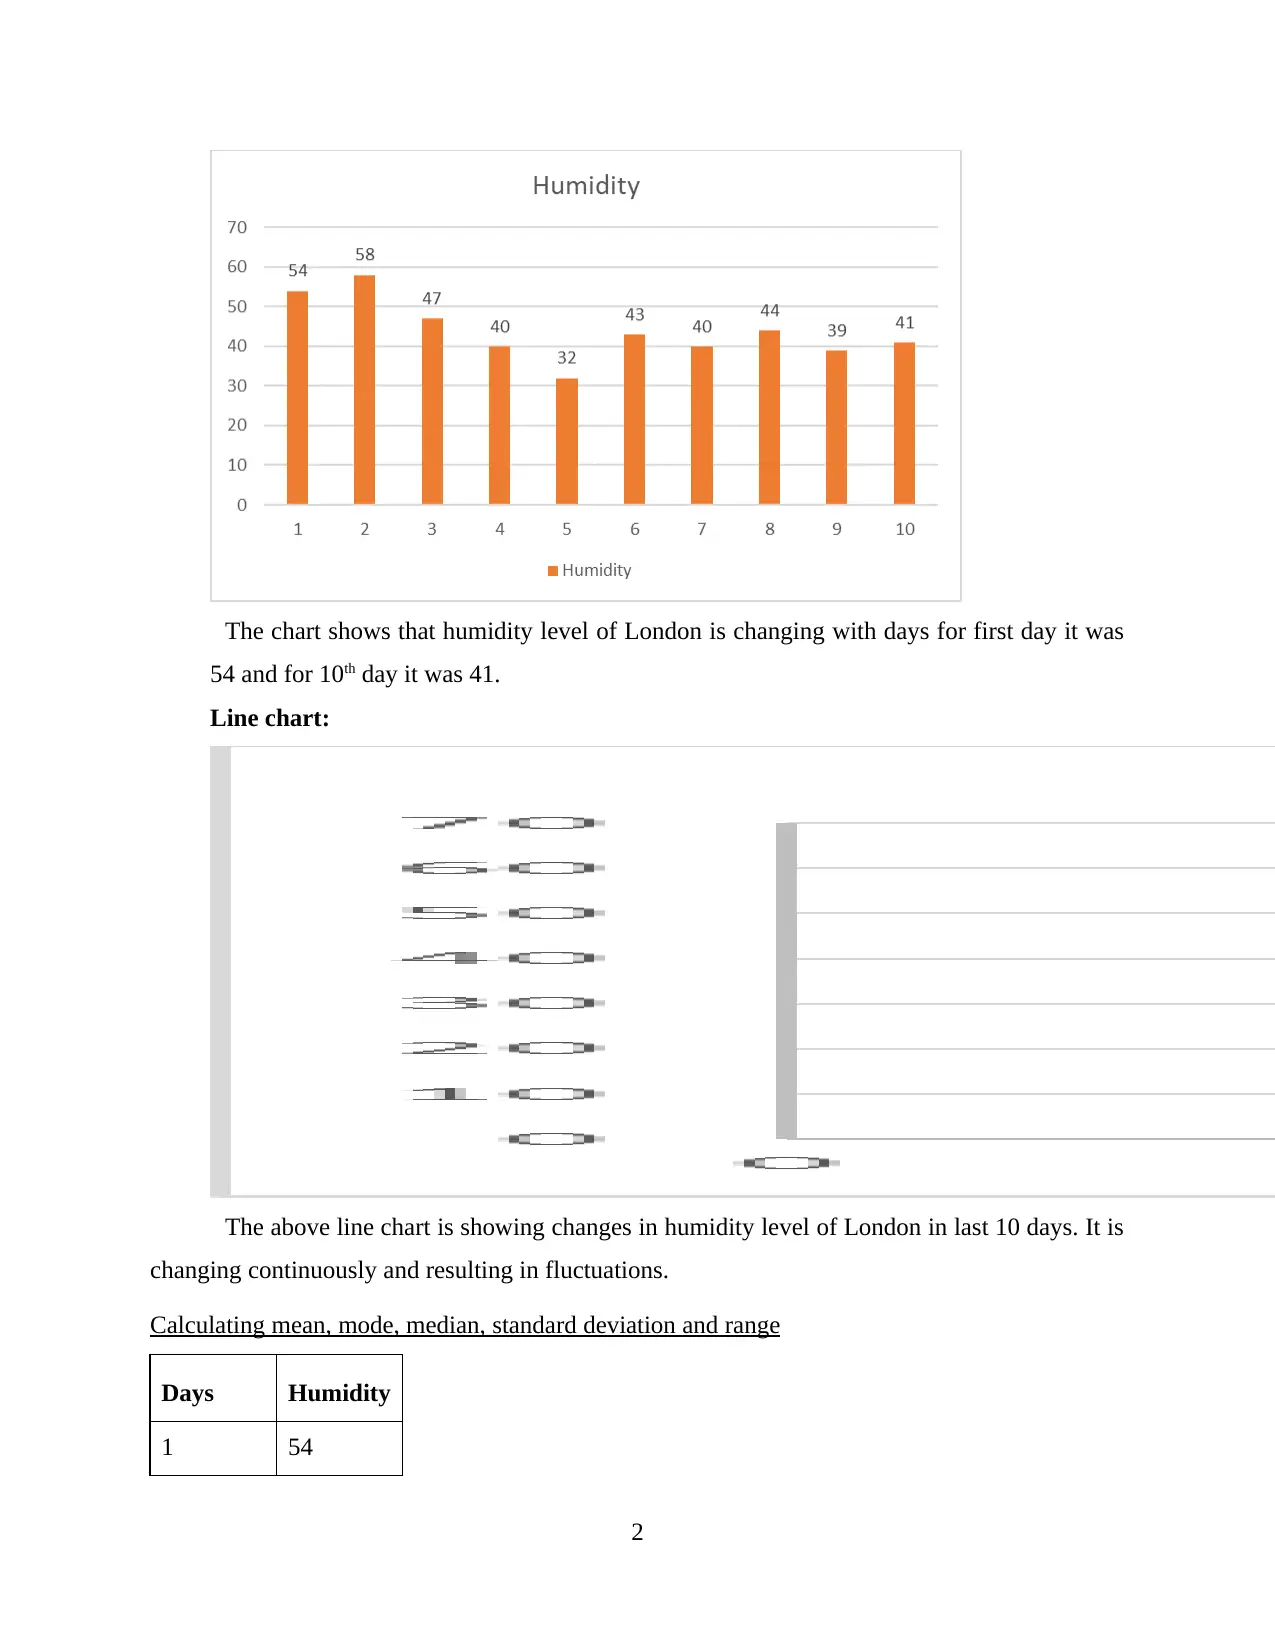
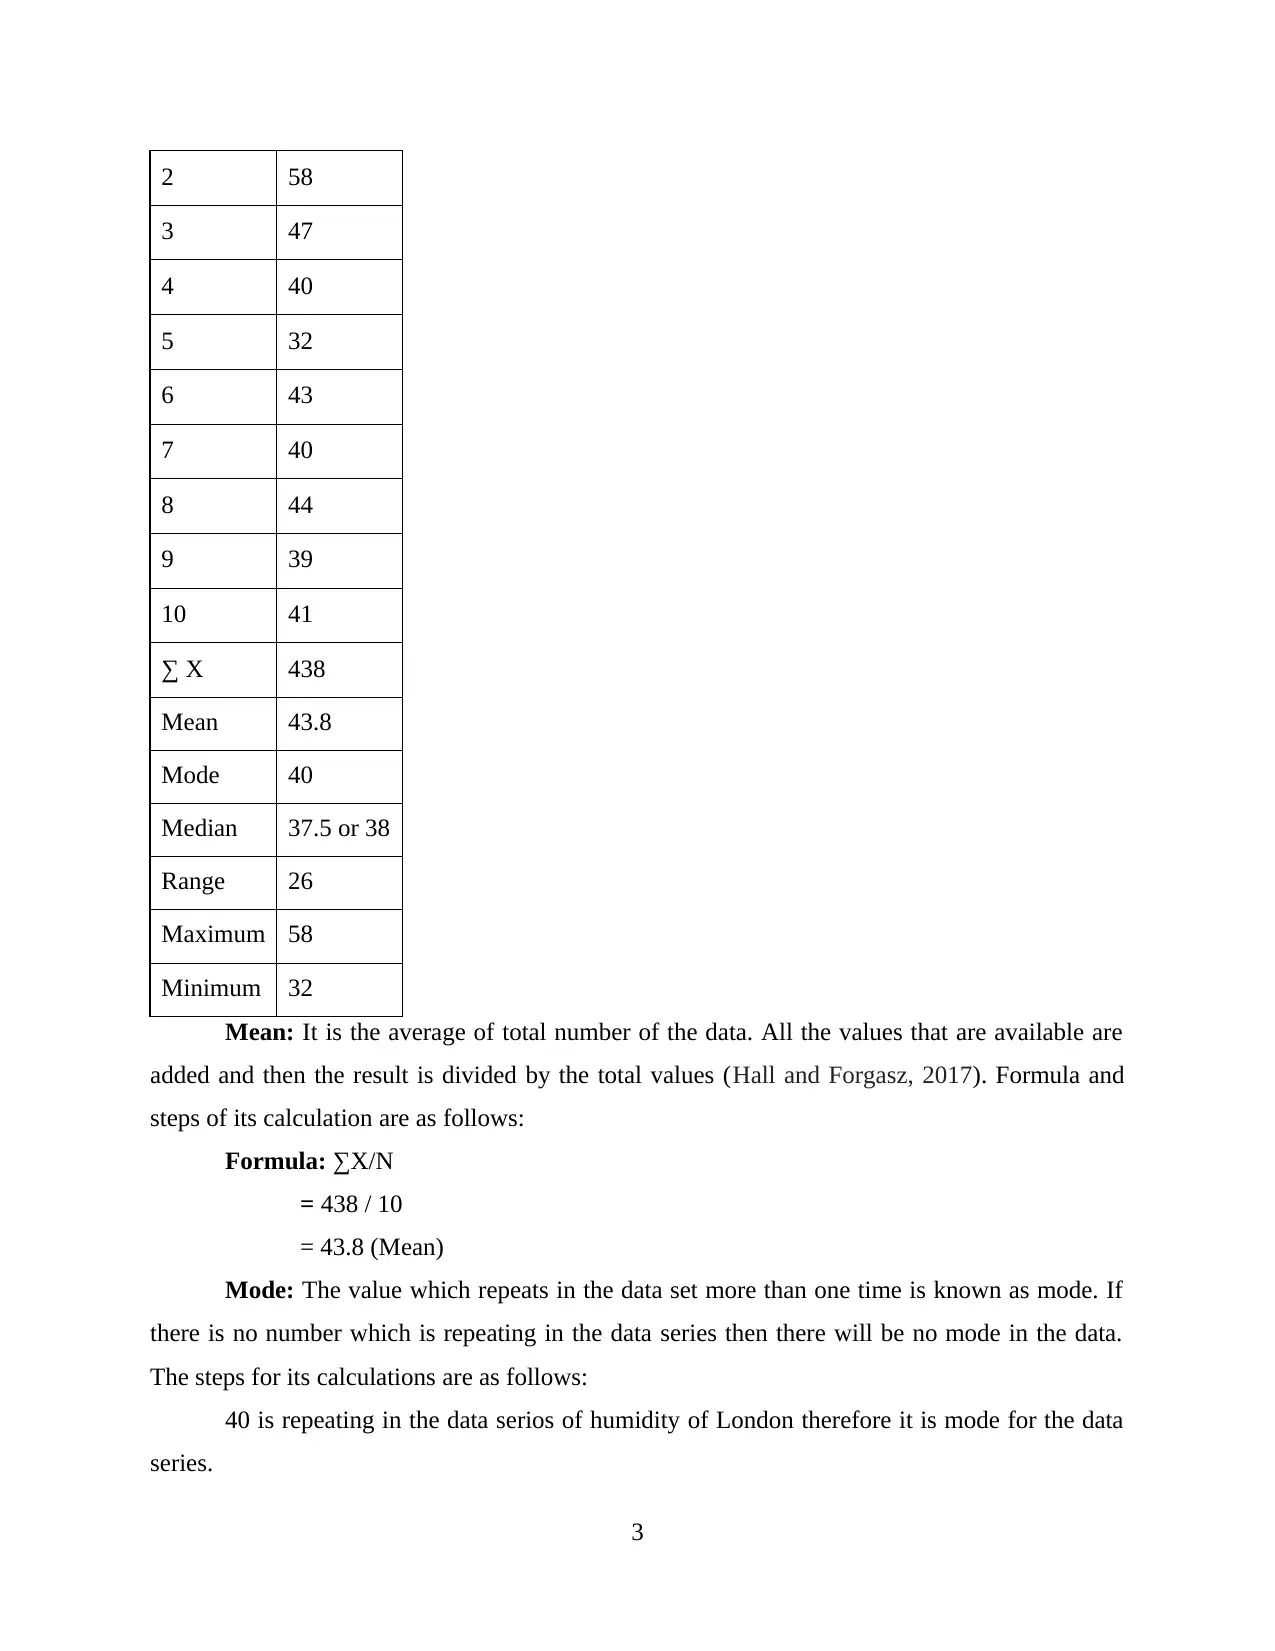
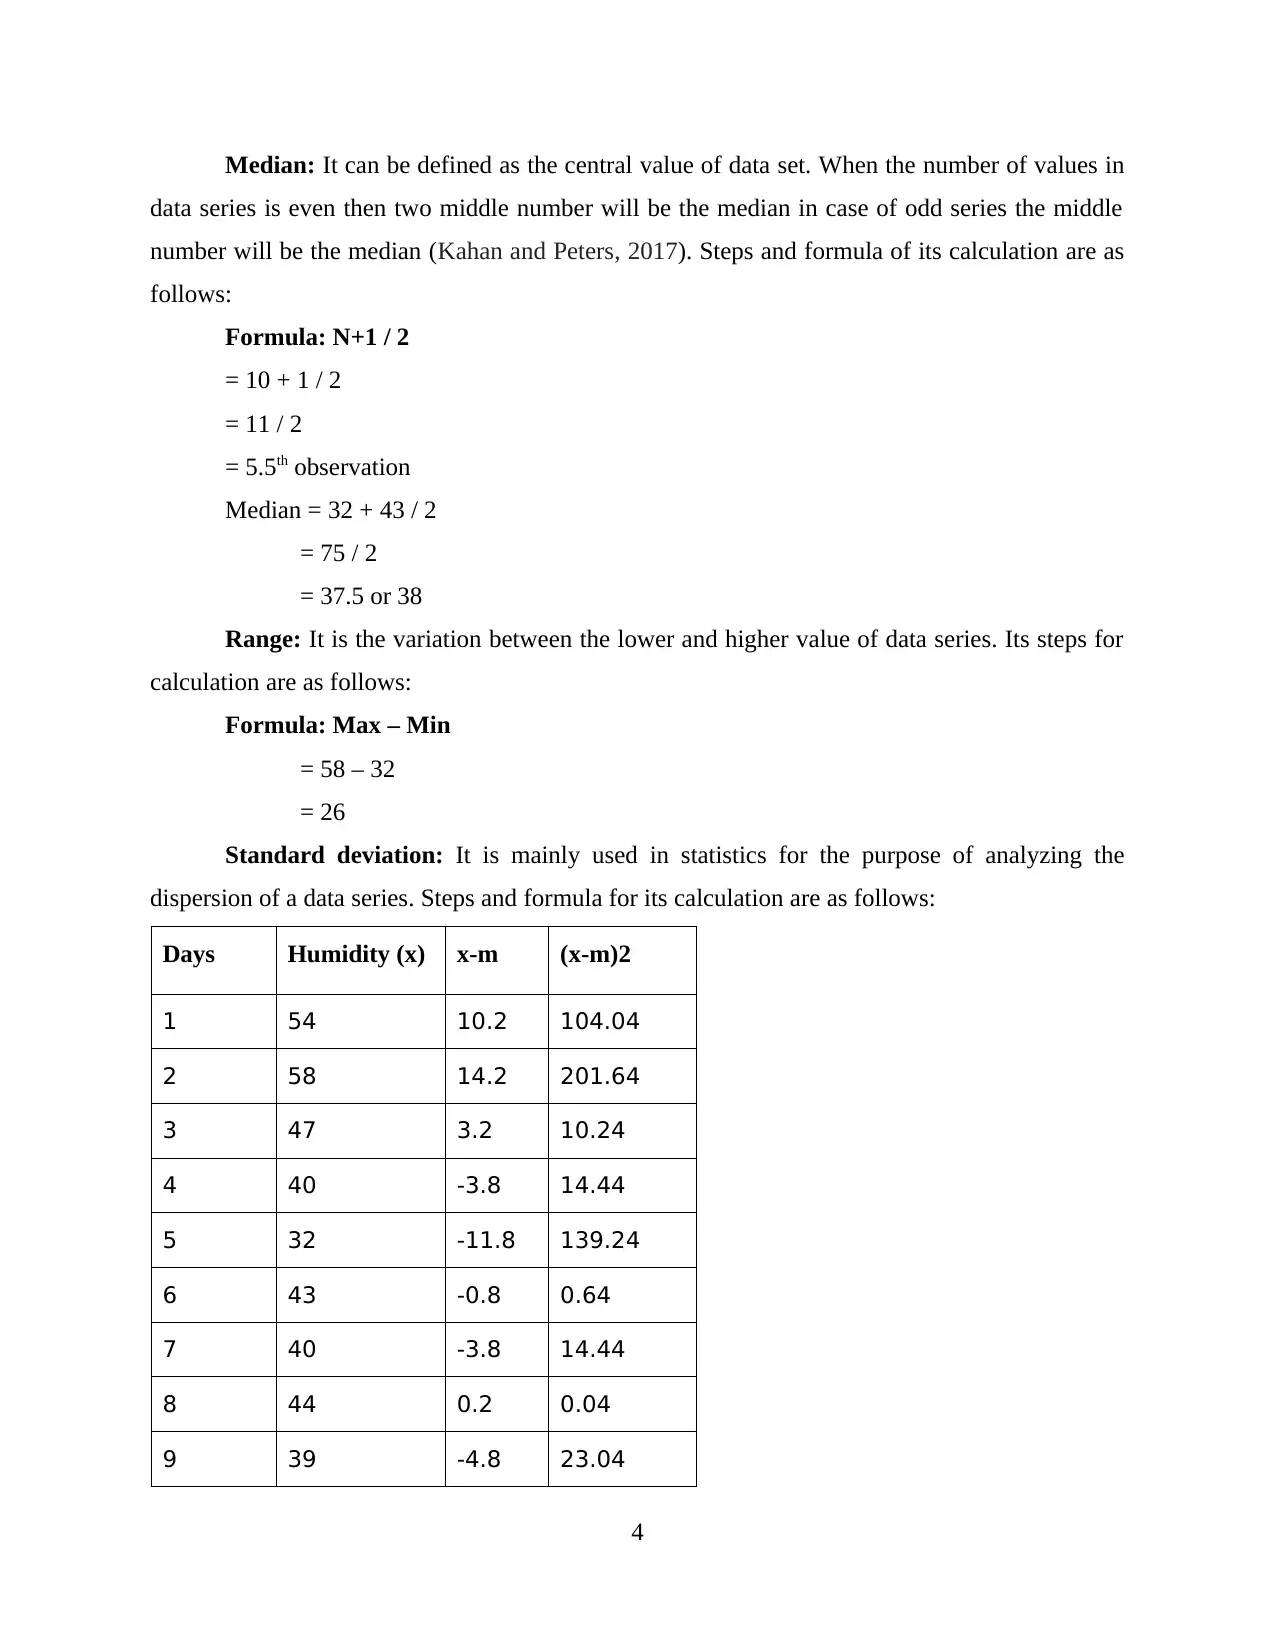
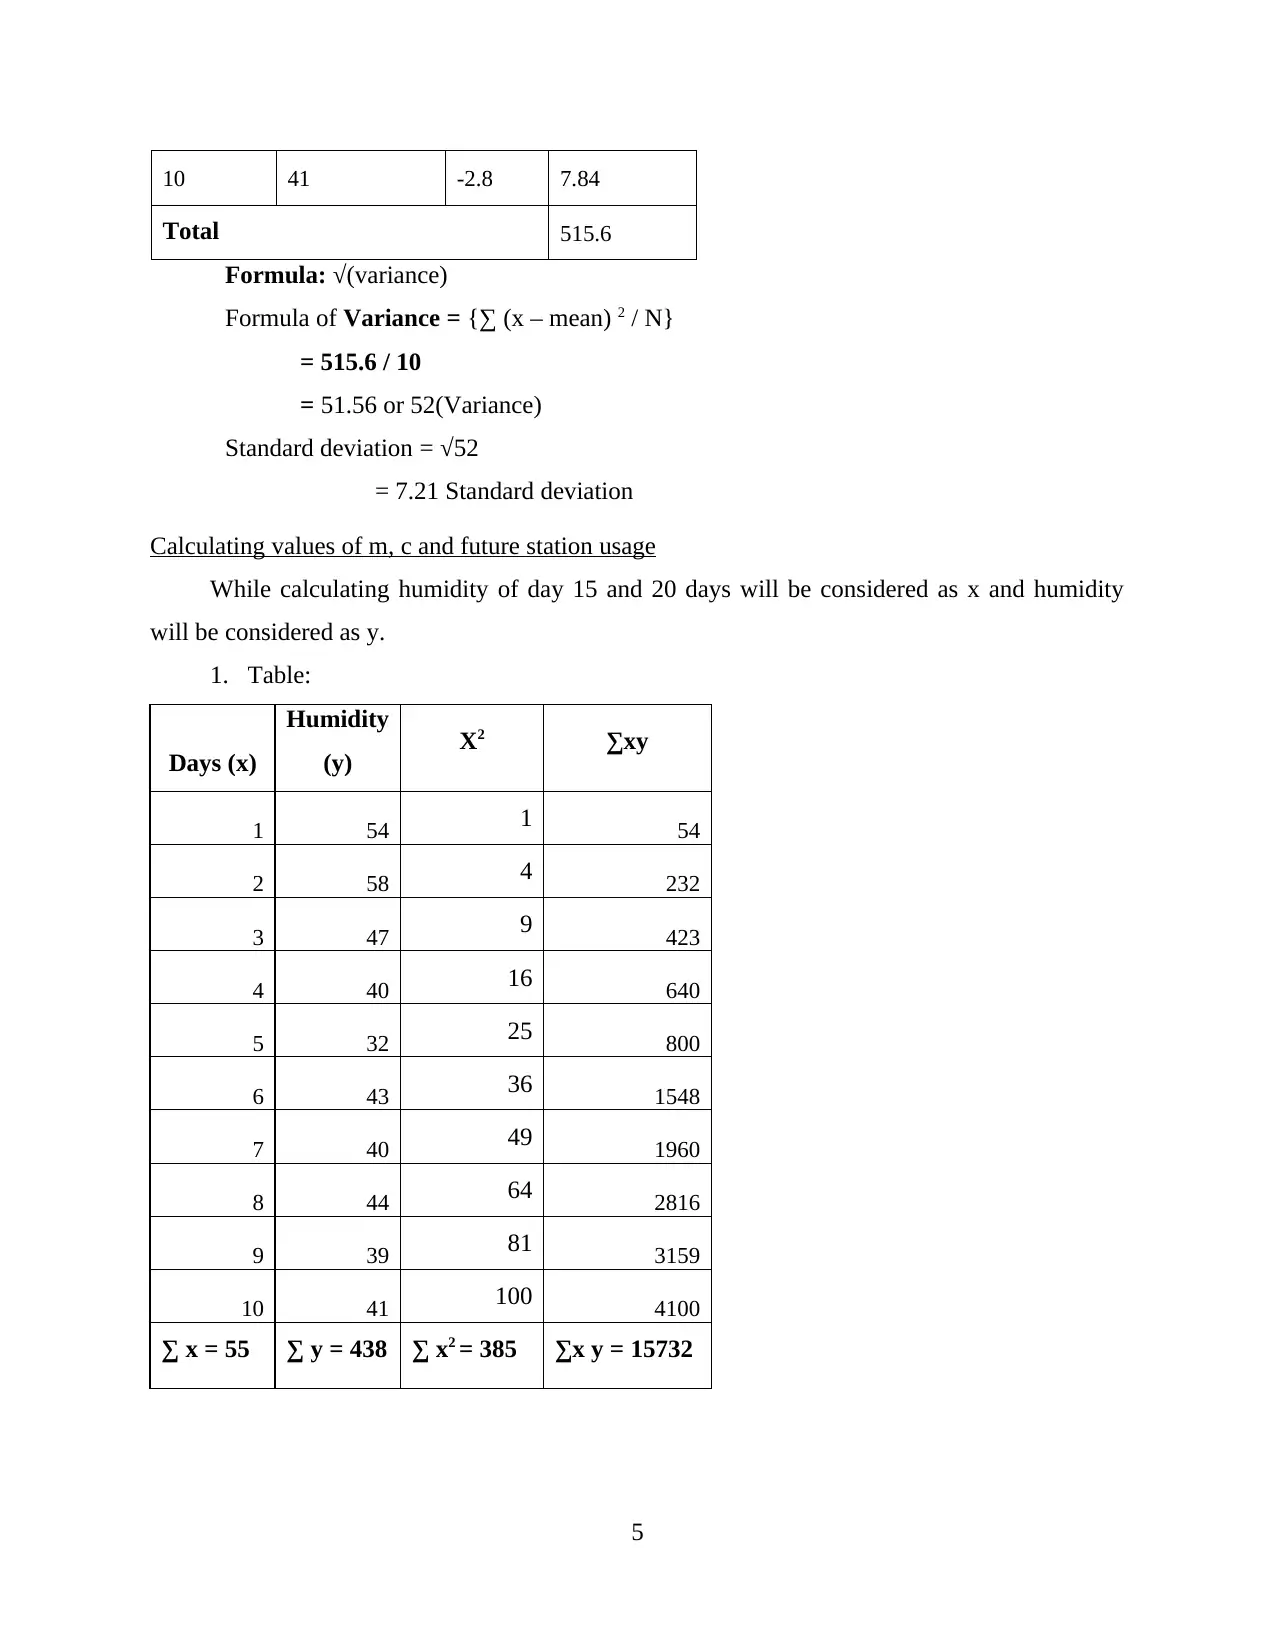
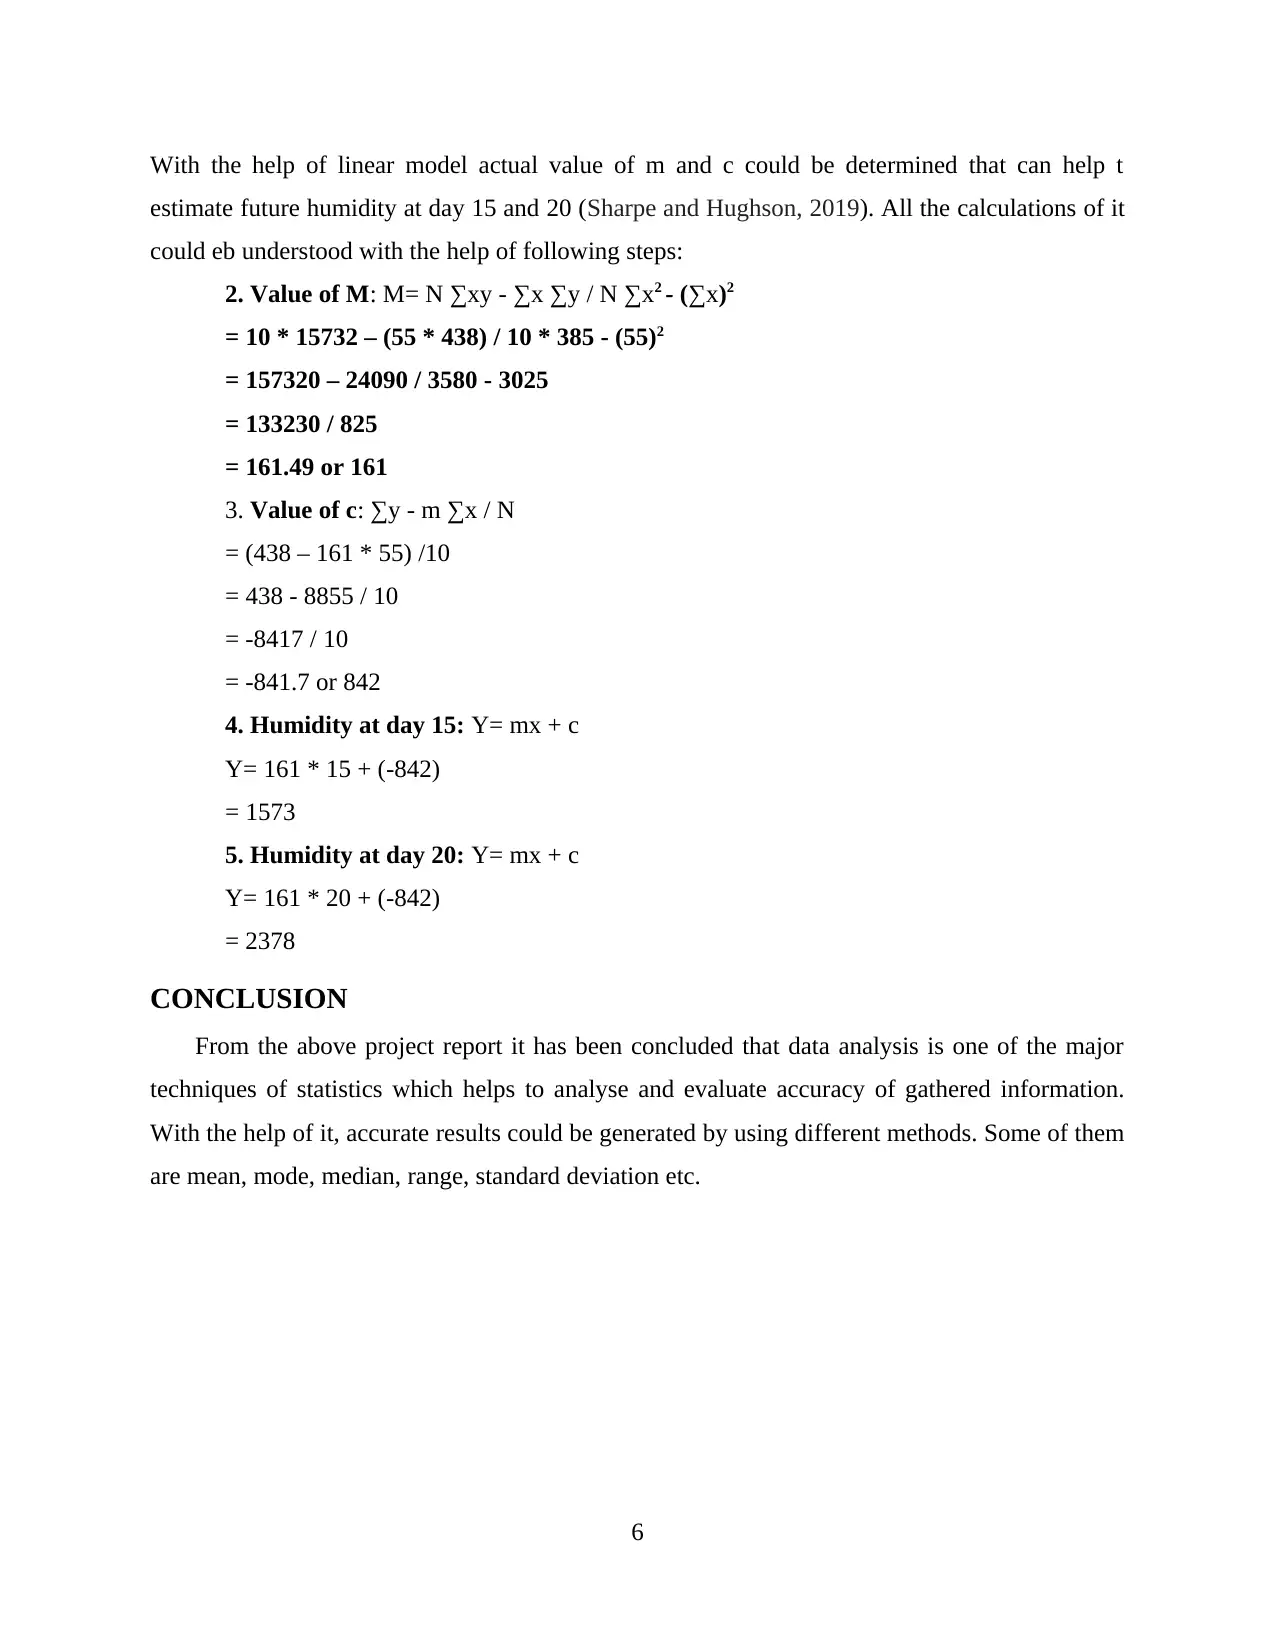
This report presents a comprehensive analysis of London's humidity data over a ten-day period. It begins with an introduction to data analysis and its importance in drawing accurate conclusions. The main body of the report presents the humidity data in both tabular and chart formats, providing a visual representation of the fluctuations. Furthermore, the report delves into the calculation of key statistical measures, including mean, mode, median, range, and standard deviation, offering a detailed explanation of each. The report also implements a linear model to determine the values of 'm' and 'c', enabling the estimation of future humidity levels. The report concludes with a summary of the findings and a list of references, providing a complete overview of the data analysis process and its applications.
tabler-icon-diamond-filled.svg

Contribute Materials

Your contribution can guide someone’s learning journey. Share your documents today.
Document Page
Numeracy and Data
Analysis
tabler-icon-diamond-filled.svg

Secure Best Marks with AI Grader

Need help grading? Try our AI Grader for instant feedback on your assignments.
Document Page
Table of Contents
Table of Contents.............................................................................................................................2
INTRODUCTION...........................................................................................................................1
MAIN BODY..................................................................................................................................1
Presenting humidity data in table format.....................................................................................1
Presenting data in chart format....................................................................................................1
Calculating mean, mode, median, standard deviation and range................................................2
Calculating values of m, c and future station usage....................................................................5
CONCLUSION................................................................................................................................6
REFERENCES................................................................................................................................7
Document Page
INTRODUCTION
Data analysis is a process which is related to statistics and used to identify, schedule, collect
and control information. Main purpose of it is to get accurate results to the questions that are
formulated previously (Grebitus and Davis, 2019). Main am of this report is to enhance
knowledge about numeracy and data analysis. For completion of this report 10 day’s data of
London’s Humidity is used. The elements that are covered in it are presentation of data in chart
and tabular form, calculation of different elements such as mean, median, mode, range and
standard deviation. Apart from this linear model is also being implemented to determine value of
m and c are also used in this report.
MAIN BODY
Presenting humidity data in table format
The information of Humidity which is used to formulate following table is related to
humidity of London of 10 consecutive days of London (Humidity of London, 2020).
Days Humidity
1 54
2 58
3 47
4 40
5 32
6 43
7 40
8 44
9 39
10 41
Presenting data in chart format
Column chart:
1
Document Page
The chart shows that humidity level of London is changing with days for first day it was
54 and for 10th day it was 41.
Line chart:
The above line chart is showing changes in humidity level of London in last 10 days. It is
changing continuously and resulting in fluctuations.
Calculating mean, mode, median, standard deviation and range
Days Humidity
1 54
2
tabler-icon-diamond-filled.svg

Secure Best Marks with AI Grader

Need help grading? Try our AI Grader for instant feedback on your assignments.
Document Page
2 58
3 47
4 40
5 32
6 43
7 40
8 44
9 39
10 41
X 438
Mean 43.8
Mode 40
Median 37.5 or 38
Range 26
Maximum 58
Minimum 32
Mean: It is the average of total number of the data. All the values that are available are
added and then the result is divided by the total values (Hall and Forgasz, 2017). Formula and
steps of its calculation are as follows:
Formula: ∑X/N
= 438 / 10
= 43.8 (Mean)
Mode: The value which repeats in the data set more than one time is known as mode. If
there is no number which is repeating in the data series then there will be no mode in the data.
The steps for its calculations are as follows:
40 is repeating in the data serios of humidity of London therefore it is mode for the data
series.
3
Document Page
Median: It can be defined as the central value of data set. When the number of values in
data series is even then two middle number will be the median in case of odd series the middle
number will be the median (Kahan and Peters, 2017). Steps and formula of its calculation are as
follows:
Formula: N+1 / 2
= 10 + 1 / 2
= 11 / 2
= 5.5th observation
Median = 32 + 43 / 2
= 75 / 2
= 37.5 or 38
Range: It is the variation between the lower and higher value of data series. Its steps for
calculation are as follows:
Formula: Max – Min
= 58 – 32
= 26
Standard deviation: It is mainly used in statistics for the purpose of analyzing the
dispersion of a data series. Steps and formula for its calculation are as follows:
Days Humidity (x) x-m (x-m)2
1 54 10.2 104.04
2 58 14.2 201.64
3 47 3.2 10.24
4 40 -3.8 14.44
5 32 -11.8 139.24
6 43 -0.8 0.64
7 40 -3.8 14.44
8 44 0.2 0.04
9 39 -4.8 23.04
4
Document Page
10 41 -2.8 7.84
Total 515.6
Formula: √(variance)
Formula of Variance = {∑ (x – mean) 2 / N}
= 515.6 / 10
= 51.56 or 52(Variance)
Standard deviation = 52
= 7.21 Standard deviation
Calculating values of m, c and future station usage
While calculating humidity of day 15 and 20 days will be considered as x and humidity
will be considered as y.
1. Table:
Days (x)
Humidity
(y) X2 ∑xy
1 54 1 54
2 58 4 232
3 47 9 423
4 40 16 640
5 32 25 800
6 43 36 1548
7 40 49 1960
8 44 64 2816
9 39 81 3159
10 41 100 4100
x = 55 y = 438 x2 = 385 ∑x y = 15732
5
tabler-icon-diamond-filled.svg

Paraphrase This Document

Need a fresh take? Get an instant paraphrase of this document with our AI Paraphraser
Document Page
With the help of linear model actual value of m and c could be determined that can help t
estimate future humidity at day 15 and 20 (Sharpe and Hughson, 2019). All the calculations of it
could eb understood with the help of following steps:
2. Value of M: M= N ∑xy - ∑x ∑y / N ∑x2 - (∑x)2
= 10 * 15732 – (55 * 438) / 10 * 385 - (55)2
= 157320 – 24090 / 3580 - 3025
= 133230 / 825
= 161.49 or 161
3. Value of c: ∑y - m ∑x / N
= (438 – 161 * 55) /10
= 438 - 8855 / 10
= -8417 / 10
= -841.7 or 842
4. Humidity at day 15: Y= mx + c
Y= 161 * 15 + (-842)
= 1573
5. Humidity at day 20: Y= mx + c
Y= 161 * 20 + (-842)
= 2378
CONCLUSION
From the above project report it has been concluded that data analysis is one of the major
techniques of statistics which helps to analyse and evaluate accuracy of gathered information.
With the help of it, accurate results could be generated by using different methods. Some of them
are mean, mode, median, range, standard deviation etc.
6
Document Page
REFERENCES
Books and Journals:
Grebitus, C. and Davis, G. C., 2019. Does the new nutrition facts panel help compensate for low
numeracy skills? An eye‐tracking analysis. Agricultural economics. 50(3). pp.249-258.
Hall, J. and Forgasz, H., 2017. Pre-service teachers’ numeracy capabilities and confidence.
In Annual Conference of the International Group for the Psychology of Mathematics
Education 2017.
Kahan, D. M. and Peters, E., 2017. Rumors of the'Nonreplication'of the'Motivated Numeracy
Effect'Are Greatly Exaggerated. Yale Law & Economics Research Paper. (584).
Sharpe, G. and Hughson, H., 2019. Using LNAAT data to improve the teaching, resources and
achievement in numeracy education.
Online
Humidity data of London. 2020. [Online]. Available through:
< https://www.timeanddate.com/weather/uk/london/historic>
7
chevron_up_icon
1 out of 9
circle_padding
hide_on_mobile
zoom_out_icon
logo.png

Your All-in-One AI-Powered Toolkit for Academic Success.

Available 24*7 on WhatsApp / Email

[object Object]