Data Analysis, Information Management, and Visualization Assignment

Verified

Added on  2023/01/03

|14
|615
|91
Homework Assignment
AI Summary
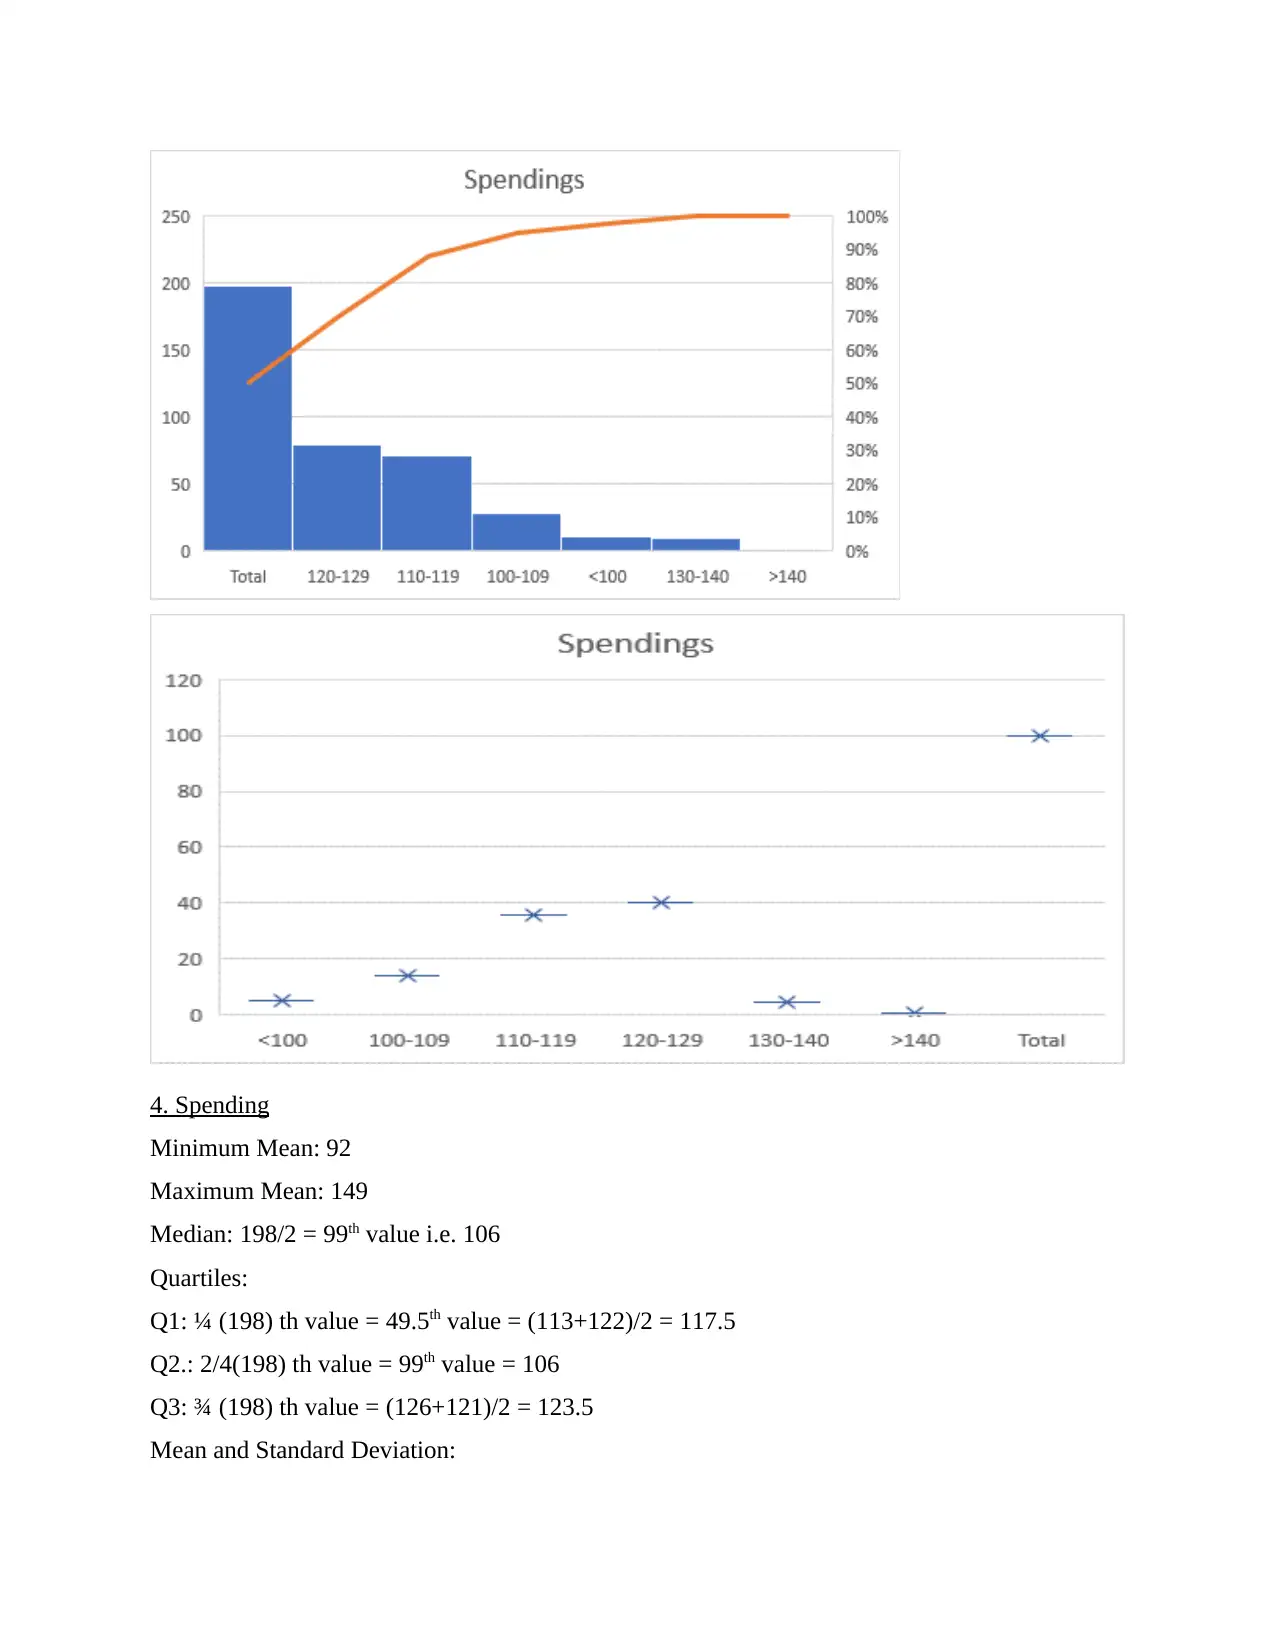
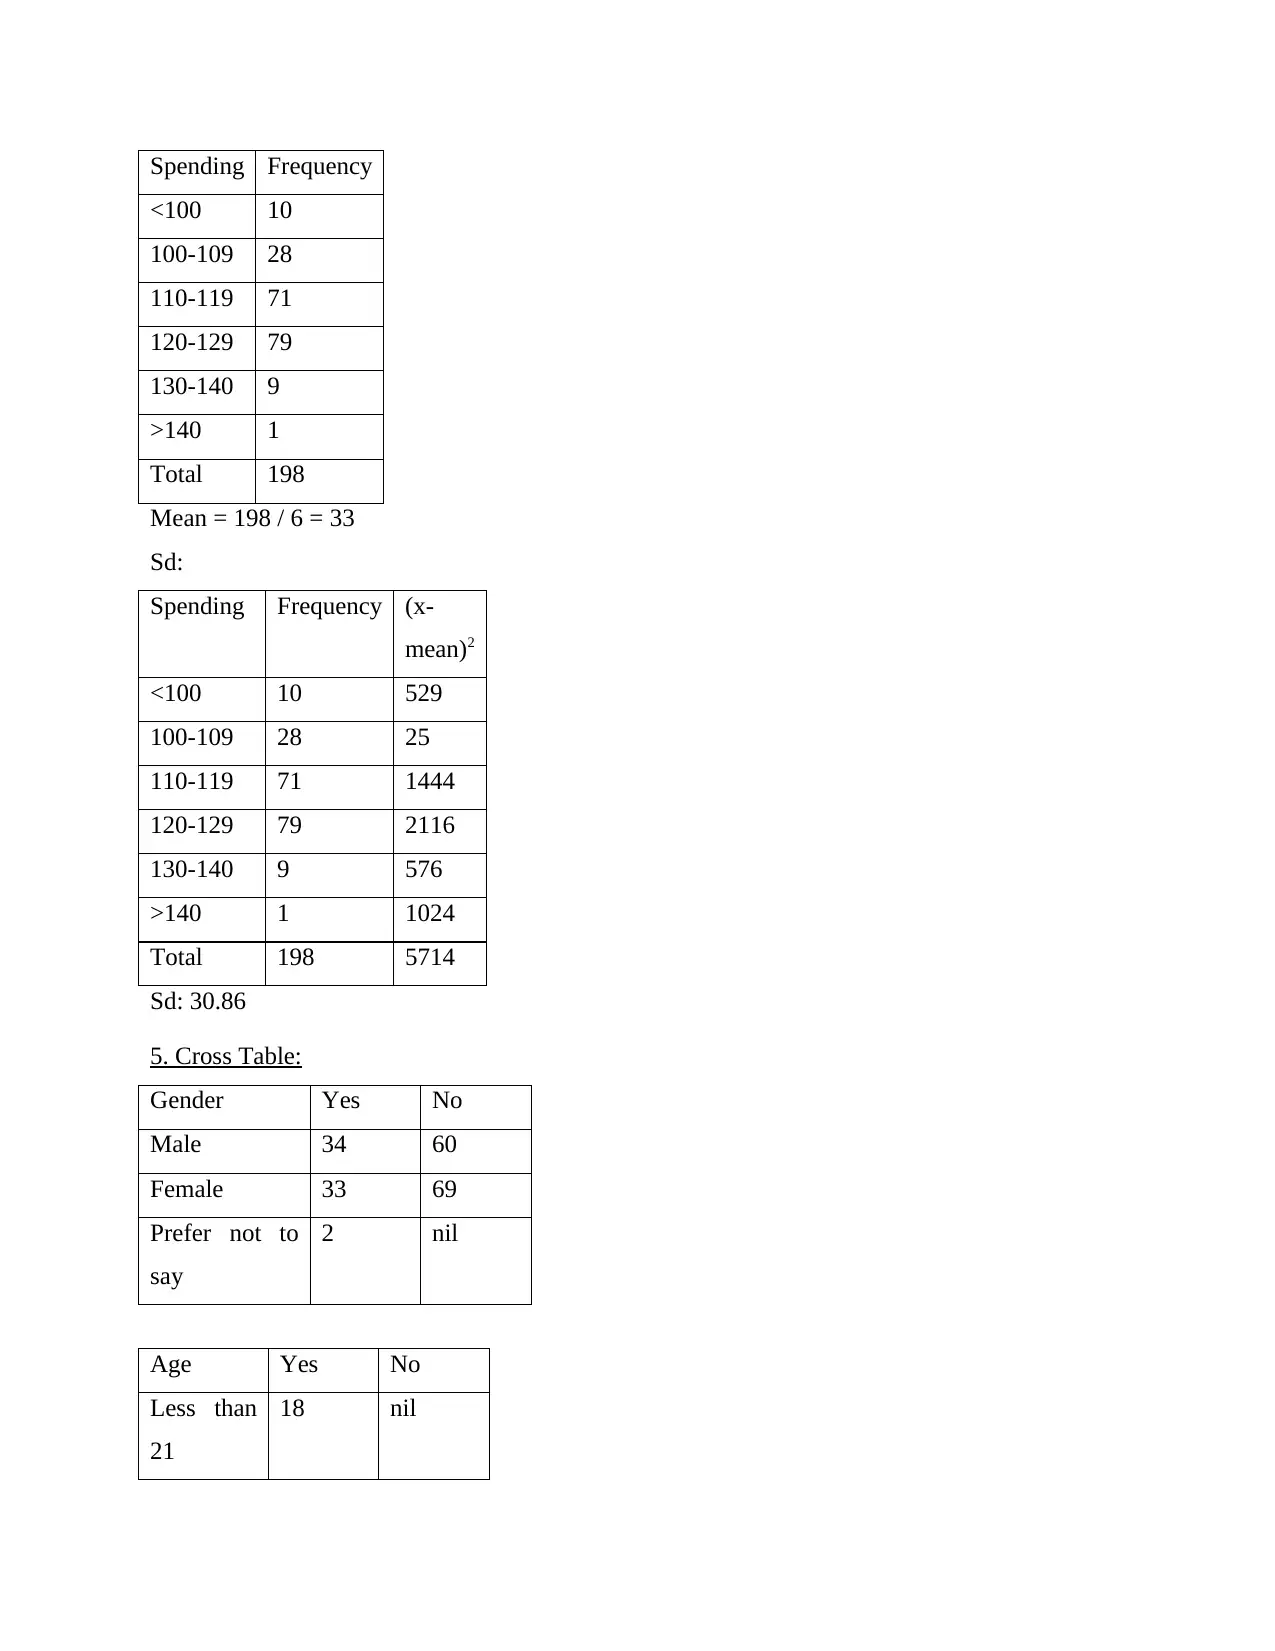
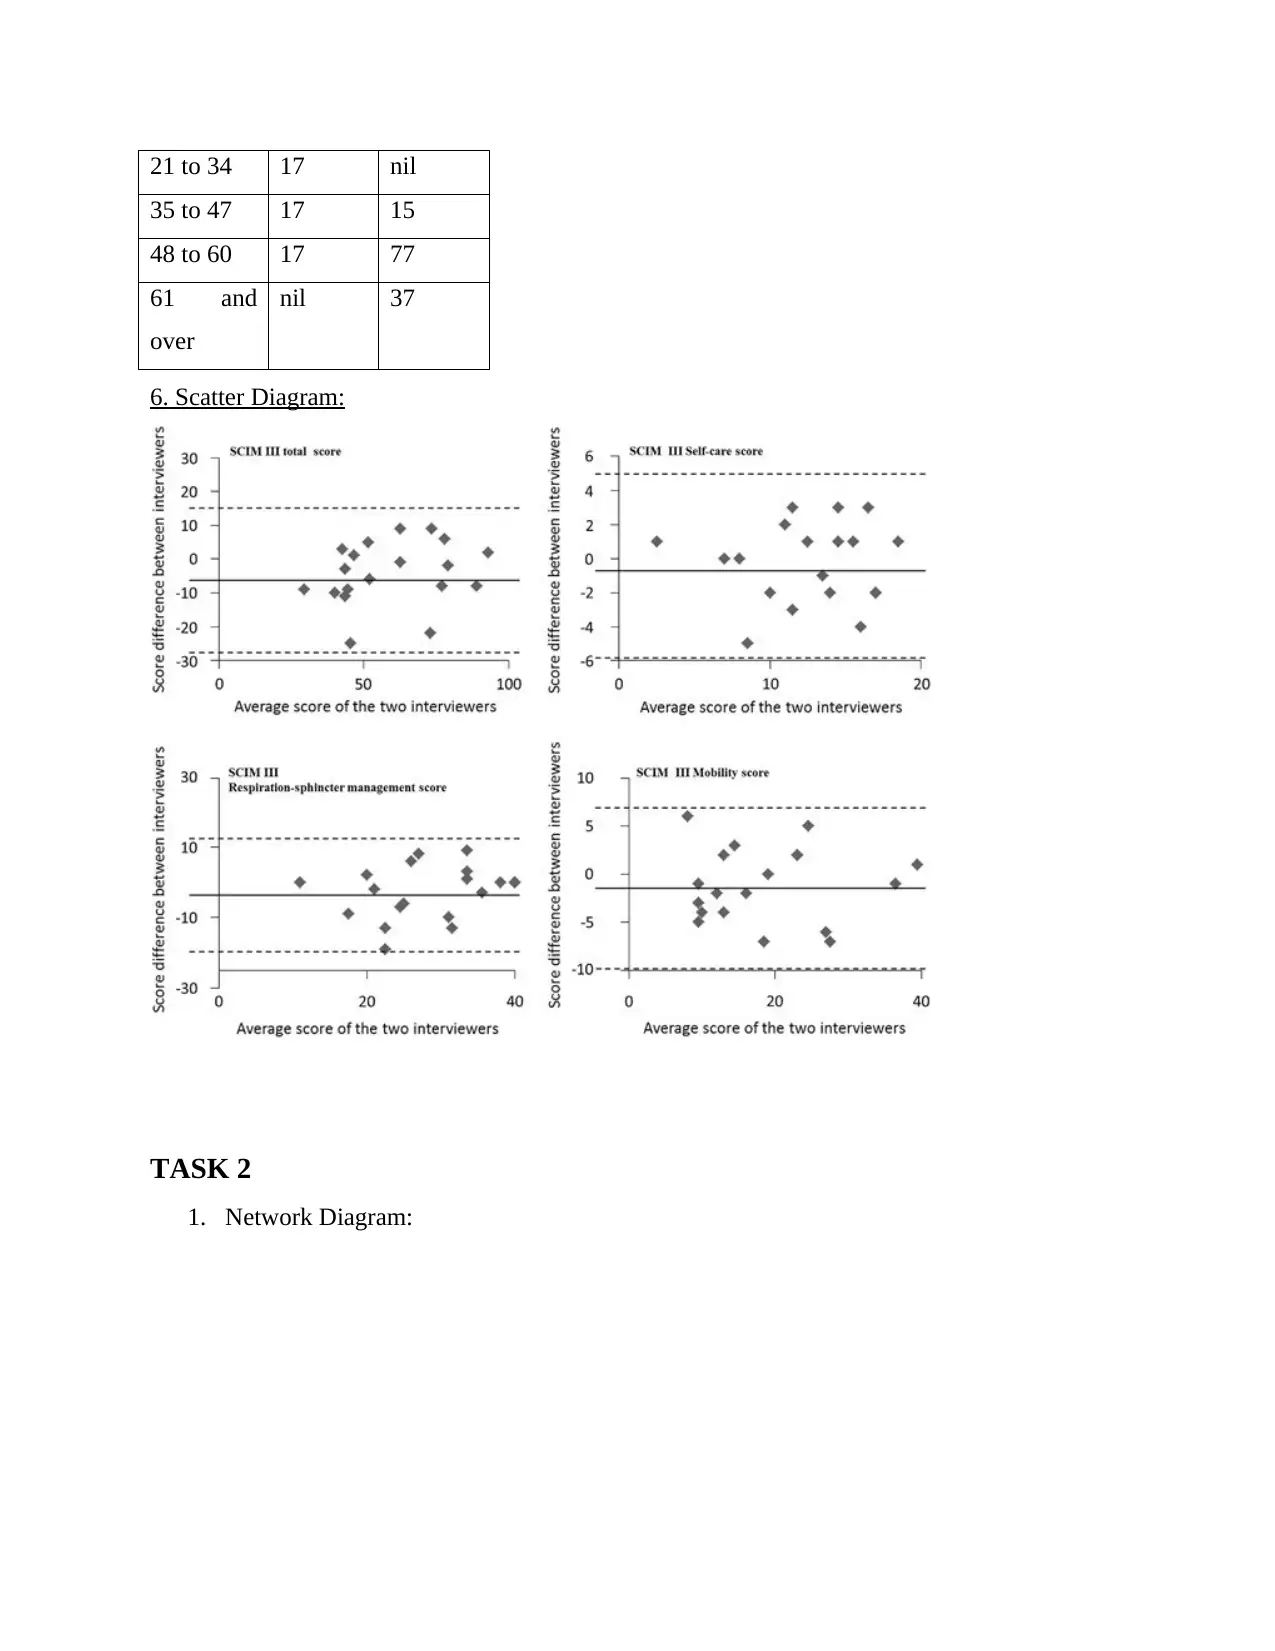
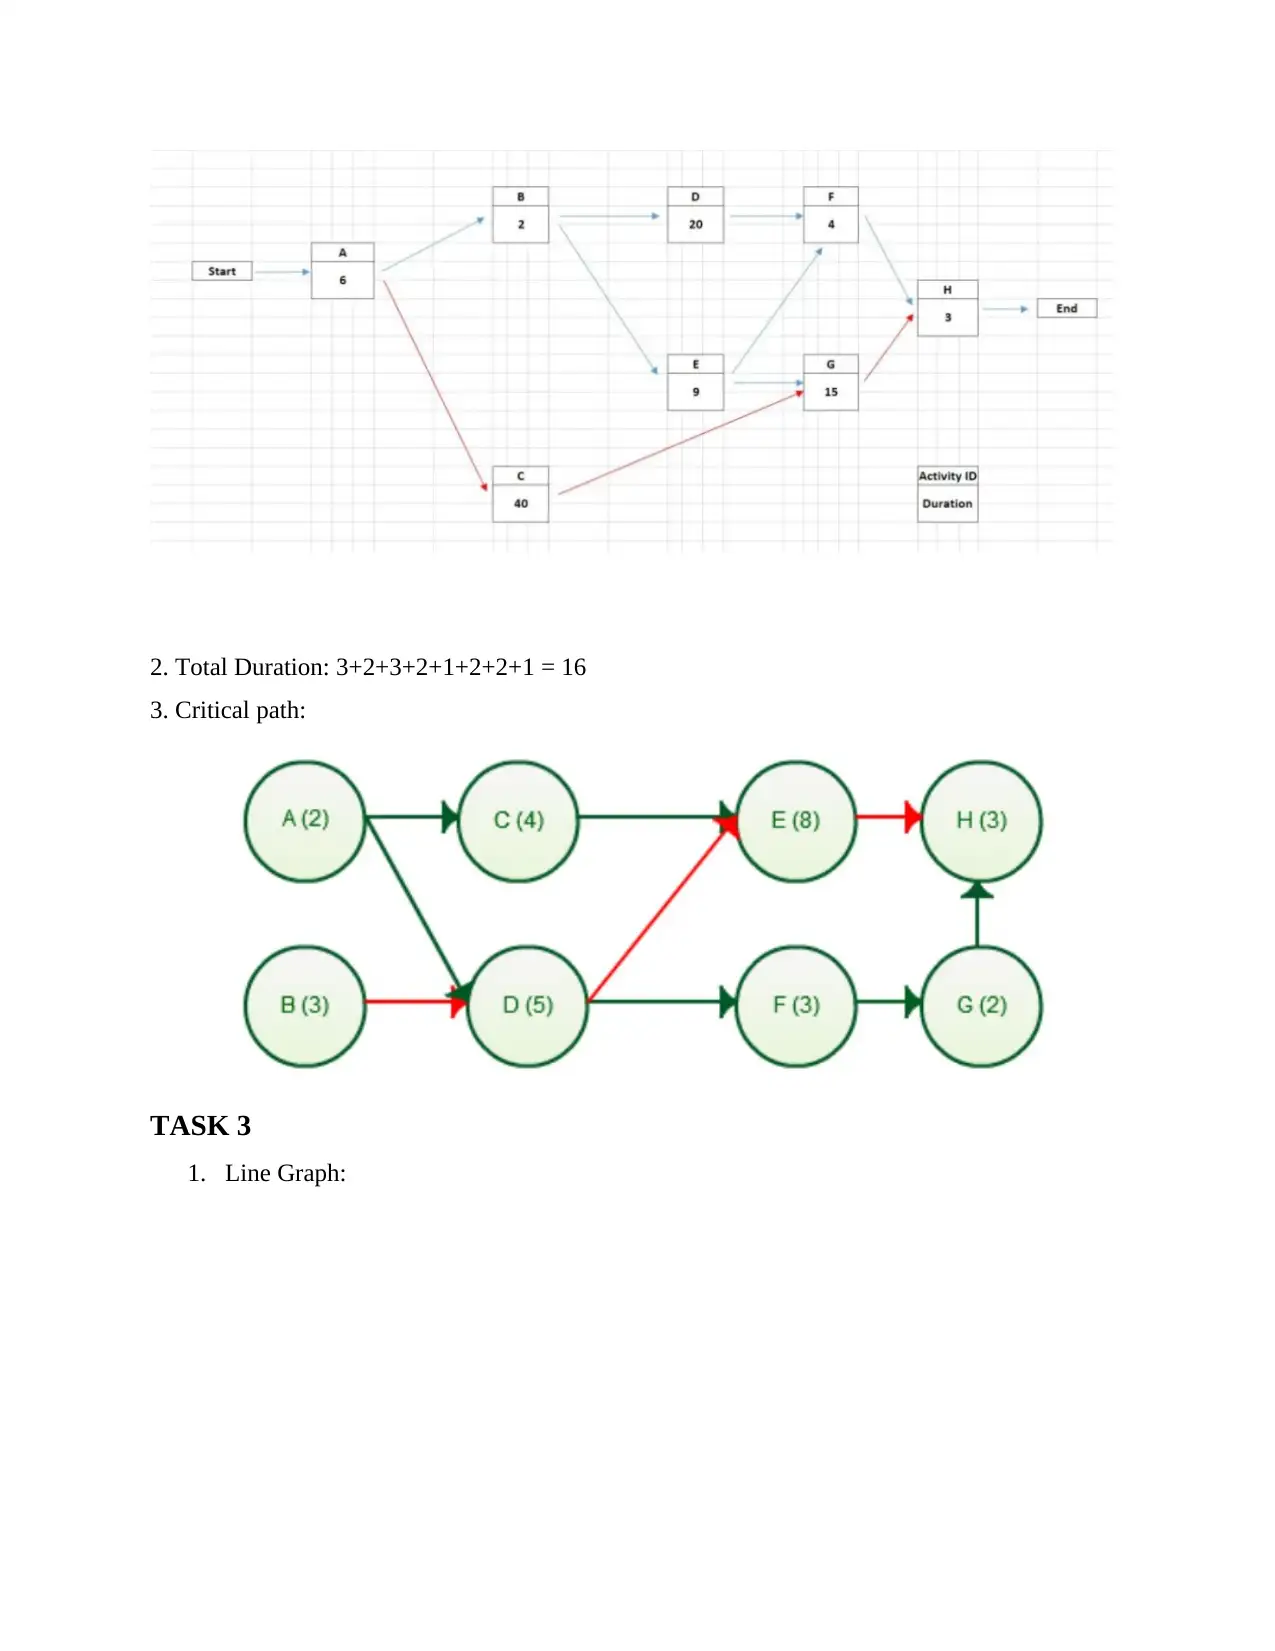
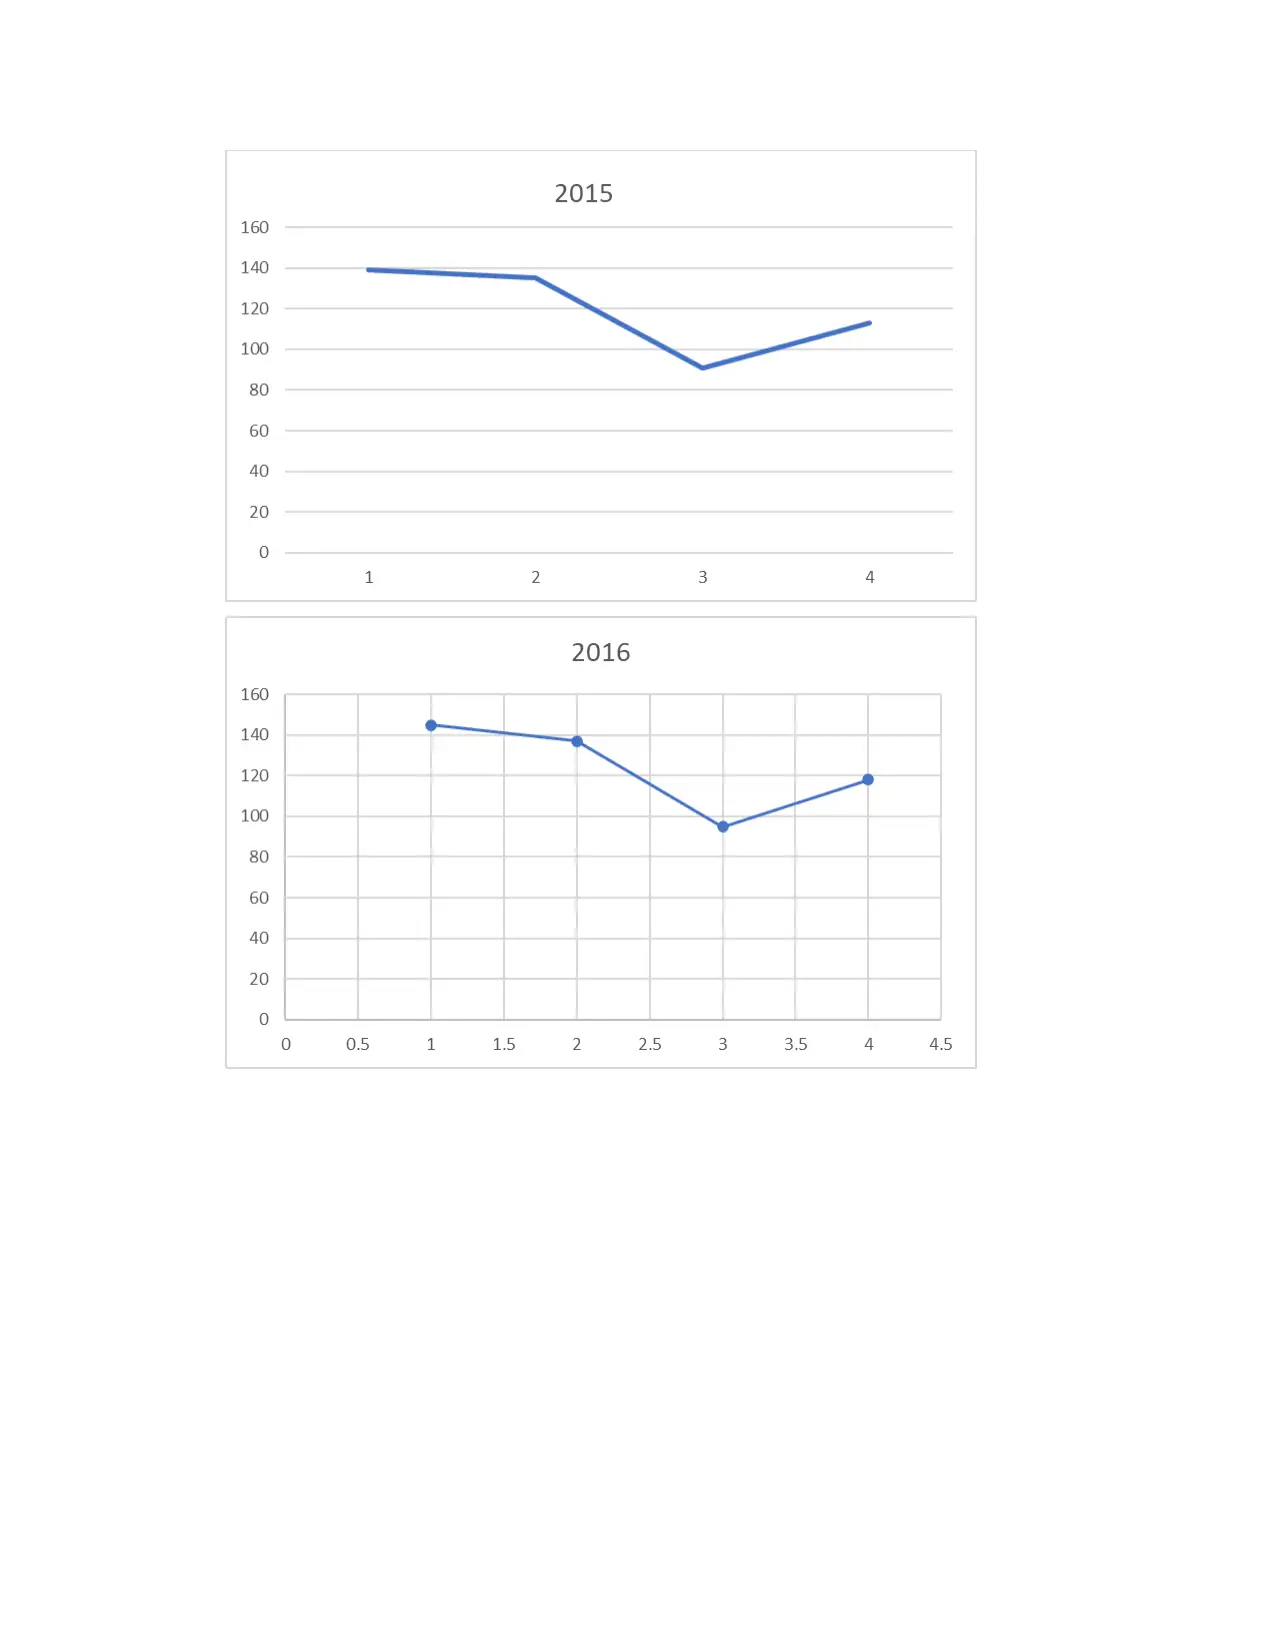
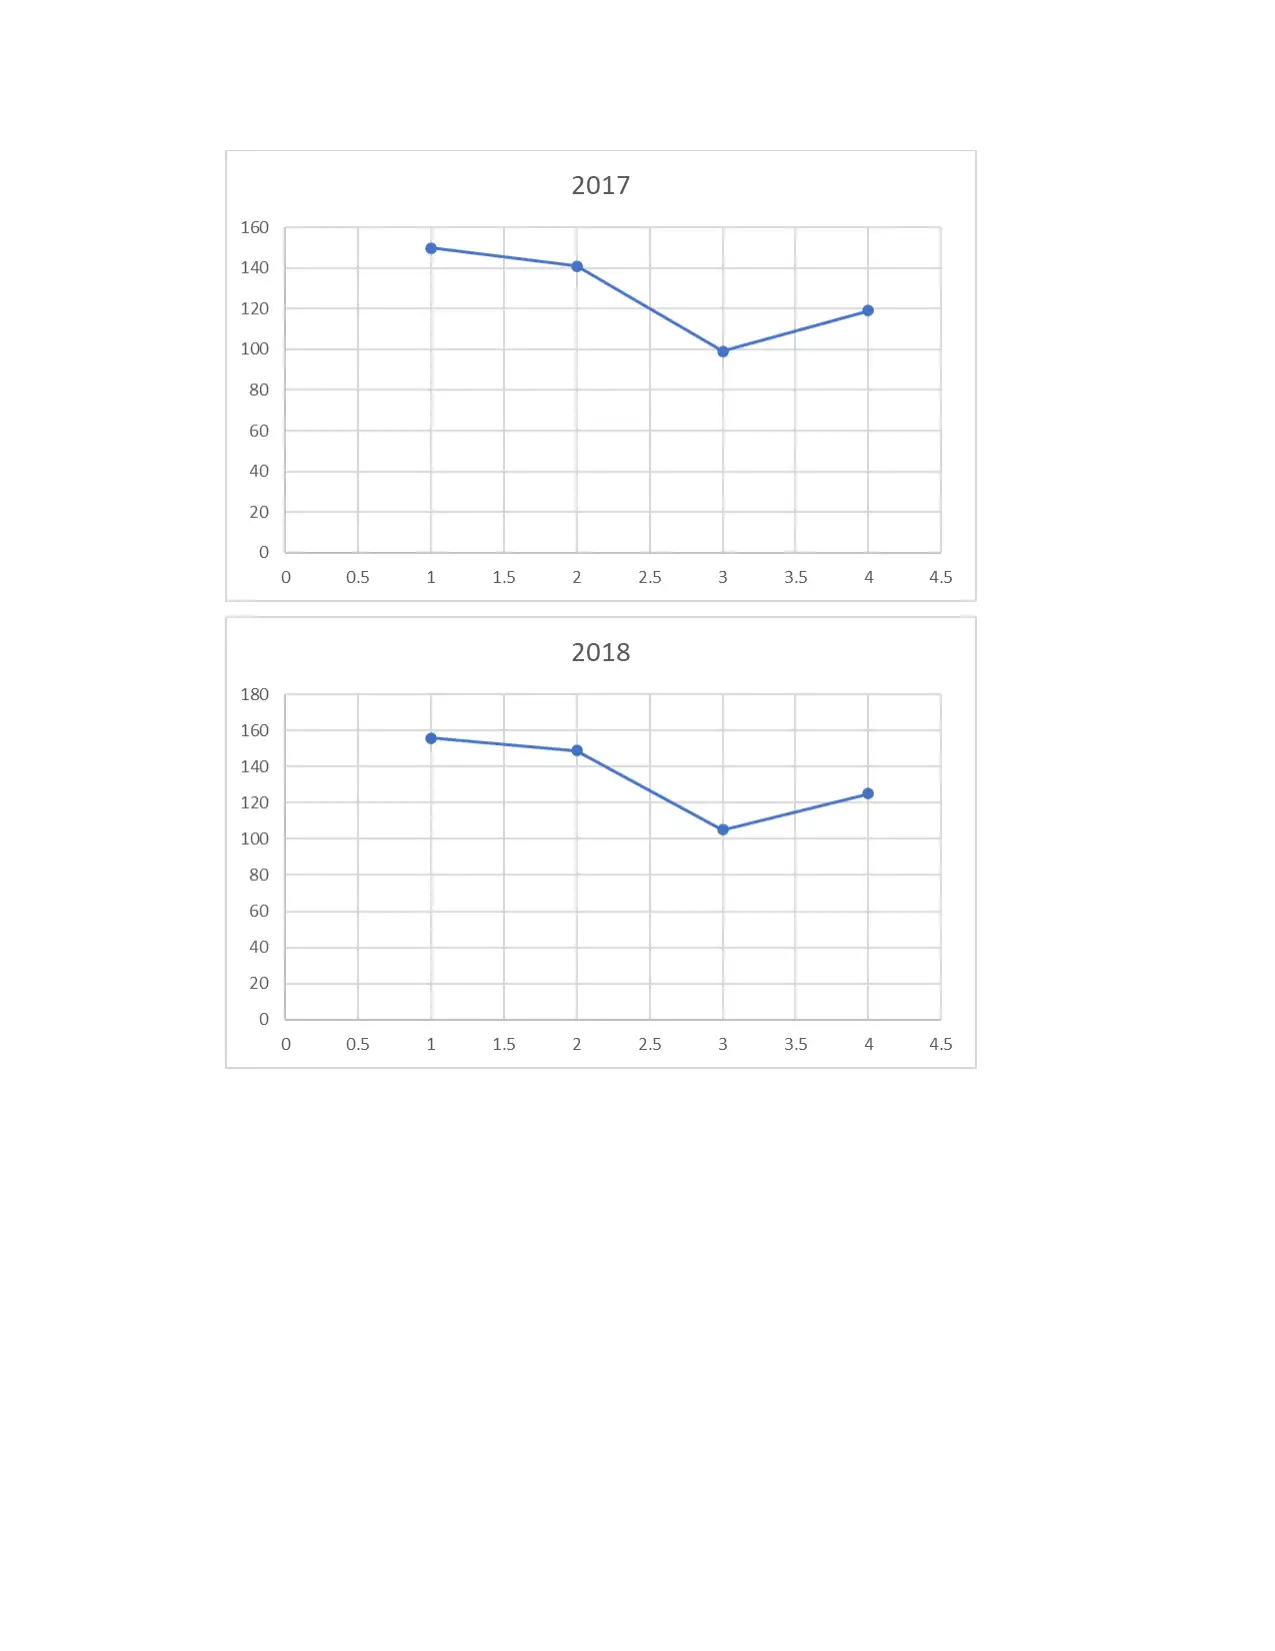
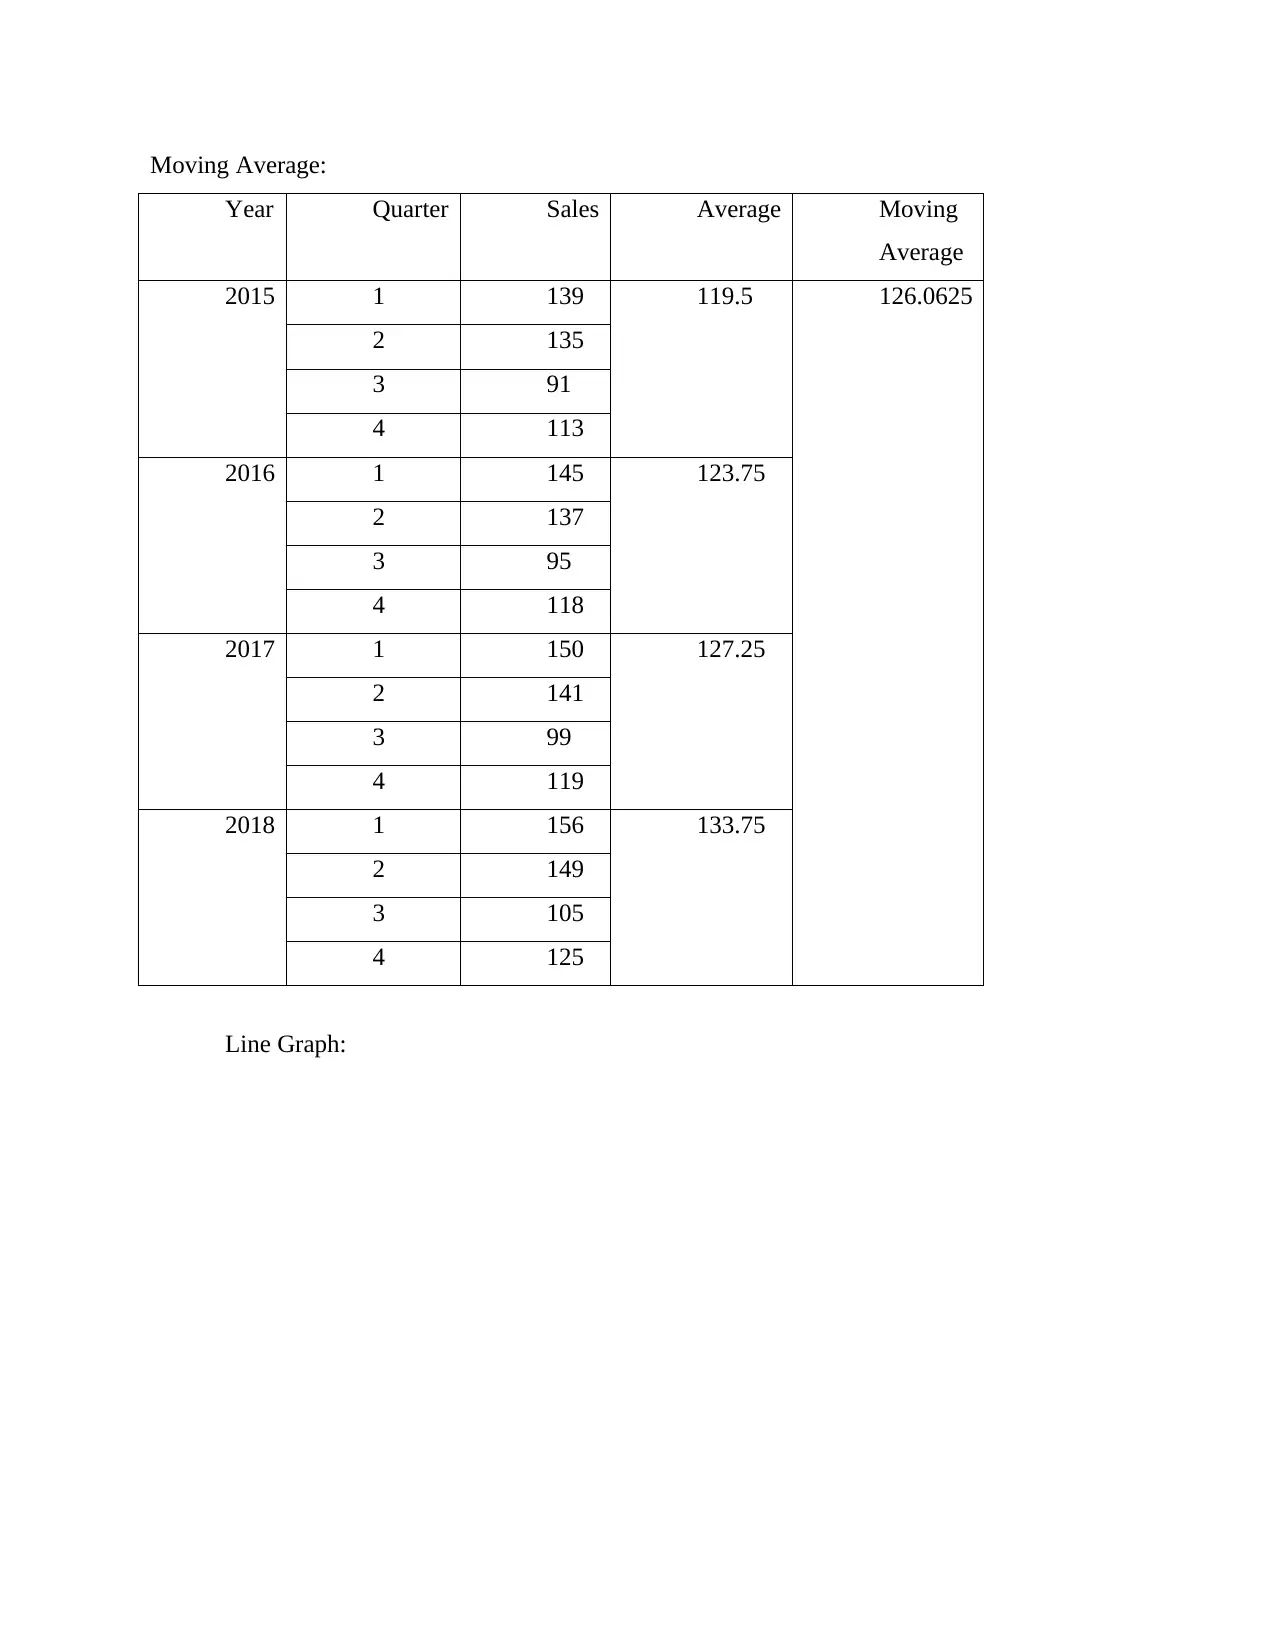
This assignment solution covers various aspects of data analysis and information management. Task 1 involves labeling codes for categories, creating frequency and percentage frequency tables, and generating graphical representations. It also includes calculations for spending, cross-tables, and scatter diagrams. Task 2 focuses on network diagrams, total duration calculation, and critical path analysis. Task 3 presents a line graph with a moving average, and Task 4 analyzes profit maximization through product optimization. The assignment demonstrates practical application of data analysis techniques, including data visualization and interpretation.
Document Page
Using and Managing Data and
Information
tabler-icon-diamond-filled.svg

Paraphrase This Document

Need a fresh take? Get an instant paraphrase of this document with our AI Paraphraser
Document Page
Contents
TASK 1............................................................................................................................................3
1. Label the codes for categories:...........................................................................................3
2. Frequency and percentage frequency tables:......................................................................3
3. Graphical representation:....................................................................................................5
4. Spending.............................................................................................................................6
5. Cross Table:........................................................................................................................7
6. Scatter Diagram:.................................................................................................................8
TASK 2............................................................................................................................................8
TASK 3............................................................................................................................................9
TASK 4..........................................................................................................................................13
Document Page
TASK 1
1. Label the codes for categories:
ï‚· Gender:
1. Male? 2. Female? 3. Prefer not to say
ï‚· Age:
1. Less than 21 2. 21 to 34 3. 35 to 47 4. 48 to 60 5. 61 and over
ï‚· Education:
1. GCSE or below 2. A’ level or Diploma 3. Degree or further
ï‚· Are you a regular user of self-checkout user:
1. Yes 2. No
2. Frequency and percentage frequency tables:
Gender
Frequency Percentage
Male 94 47.47%
Female 102 51.51%
Prefer not to
say
2 1.01%
Total 198 100%
Age Frequency Percentage
Less than
21
18 9.09%
21 to 34 17 8.58%
35 to 47 32 16.16%
48 to 60 94 47.47%
61 and
over
37 18.68%
Total 198 100
Education Frequency Percentage
Document Page
GCSE or below 67 33.83838
A’ level or
Diploma
72 36.36364
Degree or further 59 29.79798
Total 198 100
SSC
User
Frequency Percentage
Yes 69 34.84848
No 129 65.15152
Total 198 100
Spending Frequency Percentage
<100 10 5.050505
100-109 28 14.14141
110-119 71 35.85859
120-129 79 39.89899
130-140 9 4.545455
>140 1 0.505051
Total 198 100
tabler-icon-diamond-filled.svg

Paraphrase This Document

Need a fresh take? Get an instant paraphrase of this document with our AI Paraphraser
Document Page
3. Graphical representation:
Document Page
4. Spending
Minimum Mean: 92
Maximum Mean: 149
Median: 198/2 = 99th value i.e. 106
Quartiles:
Q1: ¼ (198) th value = 49.5th value = (113+122)/2 = 117.5
Q2.: 2/4(198) th value = 99th value = 106
Q3: ¾ (198) th value = (126+121)/2 = 123.5
Mean and Standard Deviation:
Document Page
Spending Frequency
<100 10
100-109 28
110-119 71
120-129 79
130-140 9
>140 1
Total 198
Mean = 198 / 6 = 33
Sd:
Spending Frequency (x-
mean)2
<100 10 529
100-109 28 25
110-119 71 1444
120-129 79 2116
130-140 9 576
>140 1 1024
Total 198 5714
Sd: 30.86
5. Cross Table:
Gender Yes No
Male 34 60
Female 33 69
Prefer not to
say
2 nil
Age Yes No
Less than
21
18 nil
tabler-icon-diamond-filled.svg

Paraphrase This Document

Need a fresh take? Get an instant paraphrase of this document with our AI Paraphraser
Document Page
21 to 34 17 nil
35 to 47 17 15
48 to 60 17 77
61 and
over
nil 37
6. Scatter Diagram:
TASK 2
1. Network Diagram:
Document Page
2. Total Duration: 3+2+3+2+1+2+2+1 = 16
3. Critical path:
TASK 3
1. Line Graph:
Document Page
tabler-icon-diamond-filled.svg

Paraphrase This Document

Need a fresh take? Get an instant paraphrase of this document with our AI Paraphraser
Document Page
Document Page
Moving Average:
Year Quarter Sales Average Moving
Average
2015 1 139 119.5 126.0625
2 135
3 91
4 113
2016 1 145 123.75
2 137
3 95
4 118
2017 1 150 127.25
2 141
3 99
4 119
2018 1 156 133.75
2 149
3 105
4 125
Line Graph:
chevron_up_icon
1 out of 14
circle_padding
hide_on_mobile
zoom_out_icon
[object Object]