Business Decision Making: Data Analysis & Trend for Murano Restaurant

Verified

Added on  2023/03/22

|11
|535
|89
Report
AI Summary
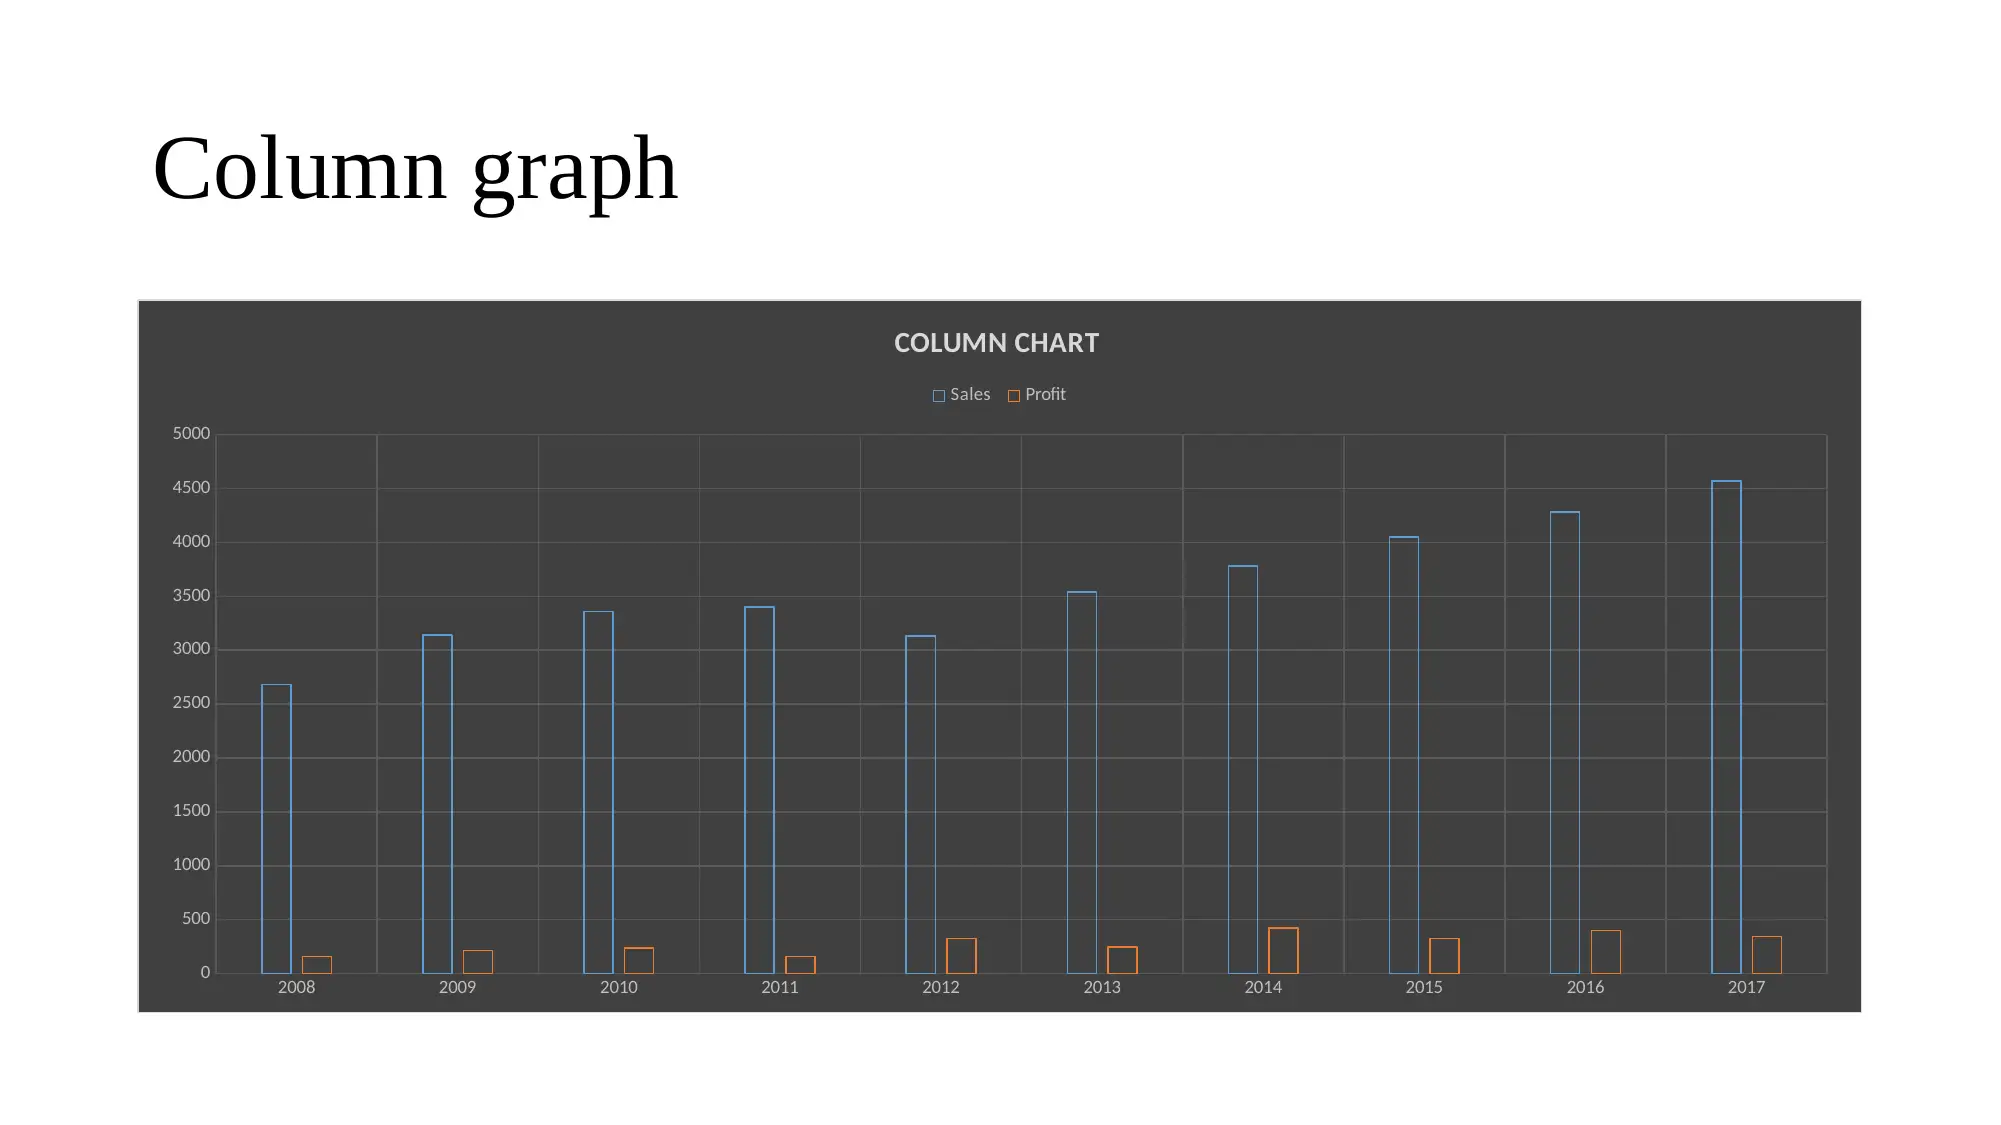
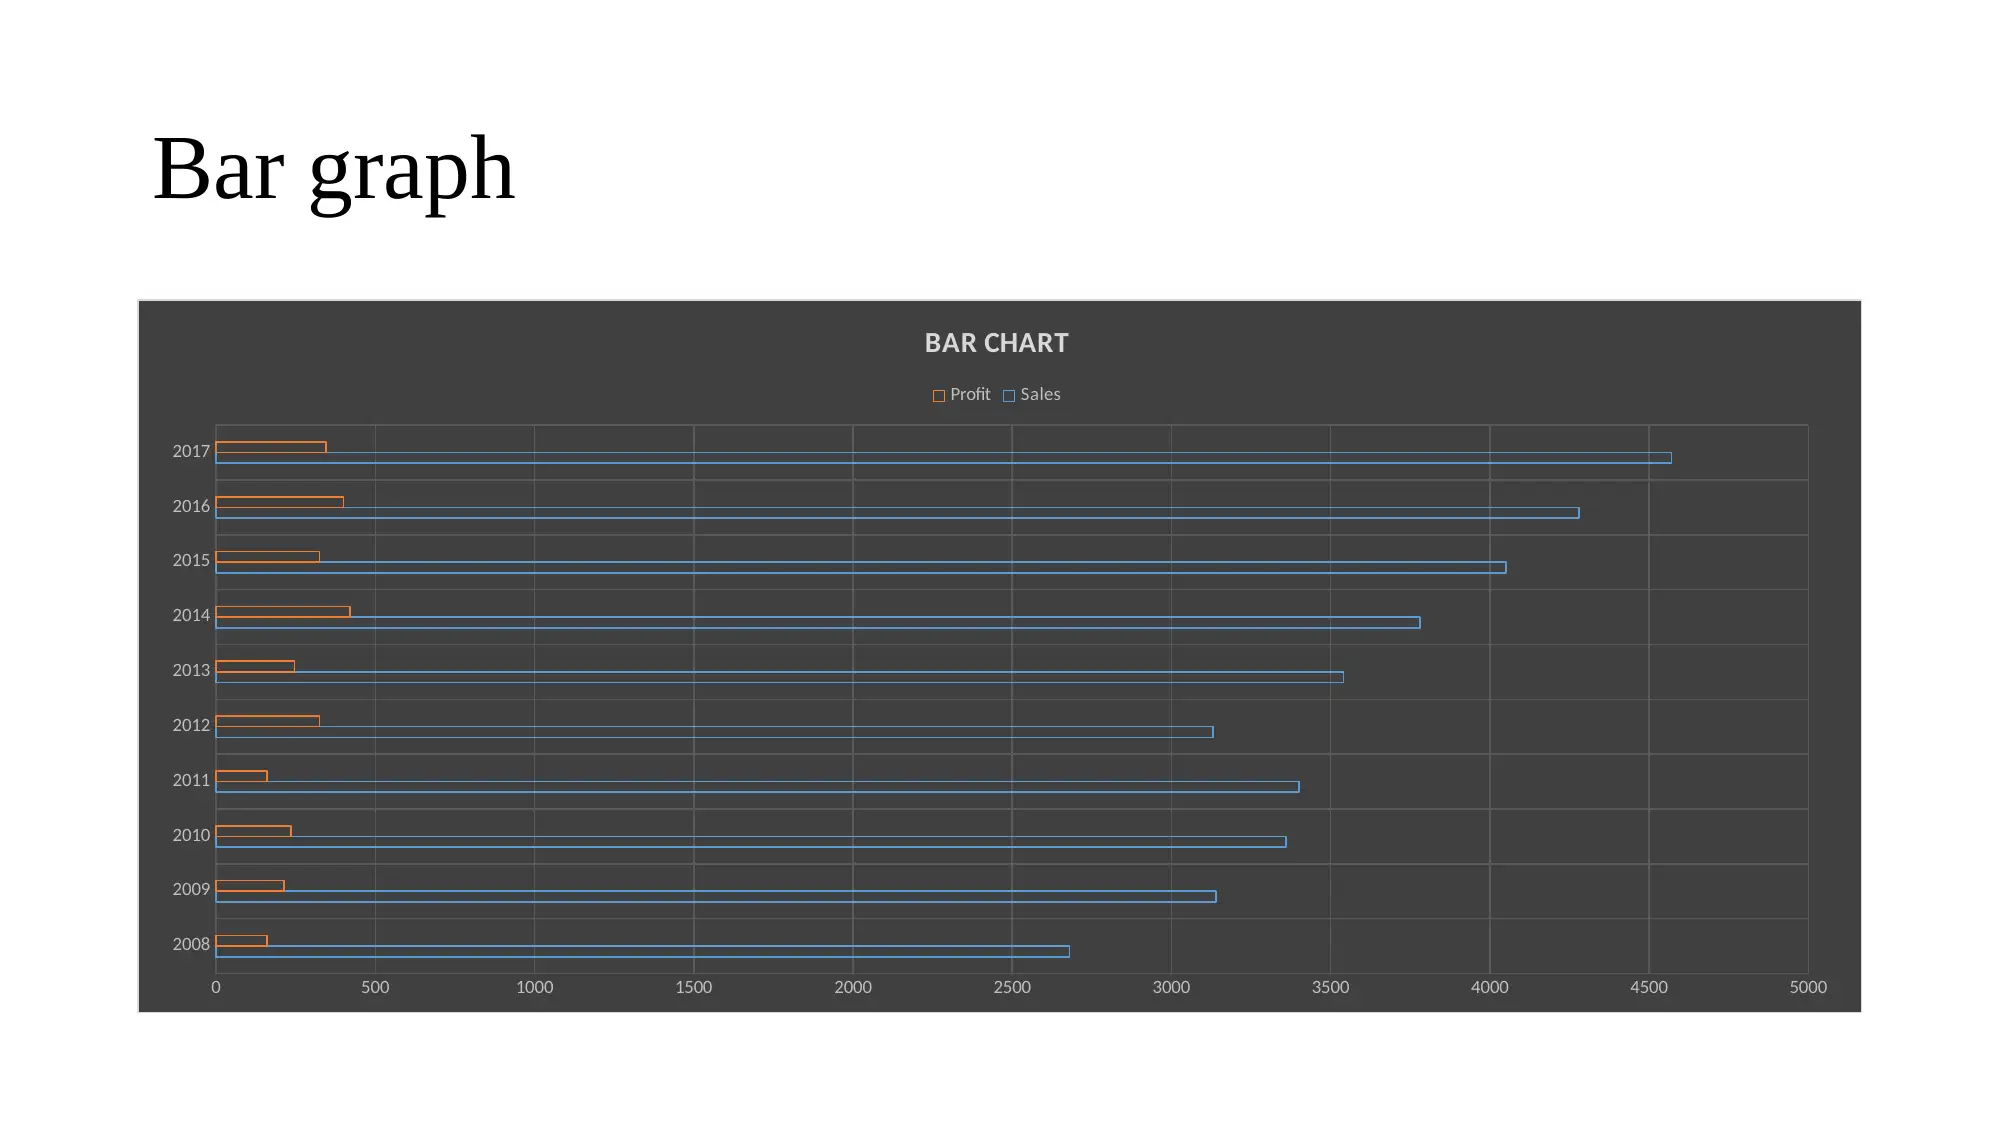
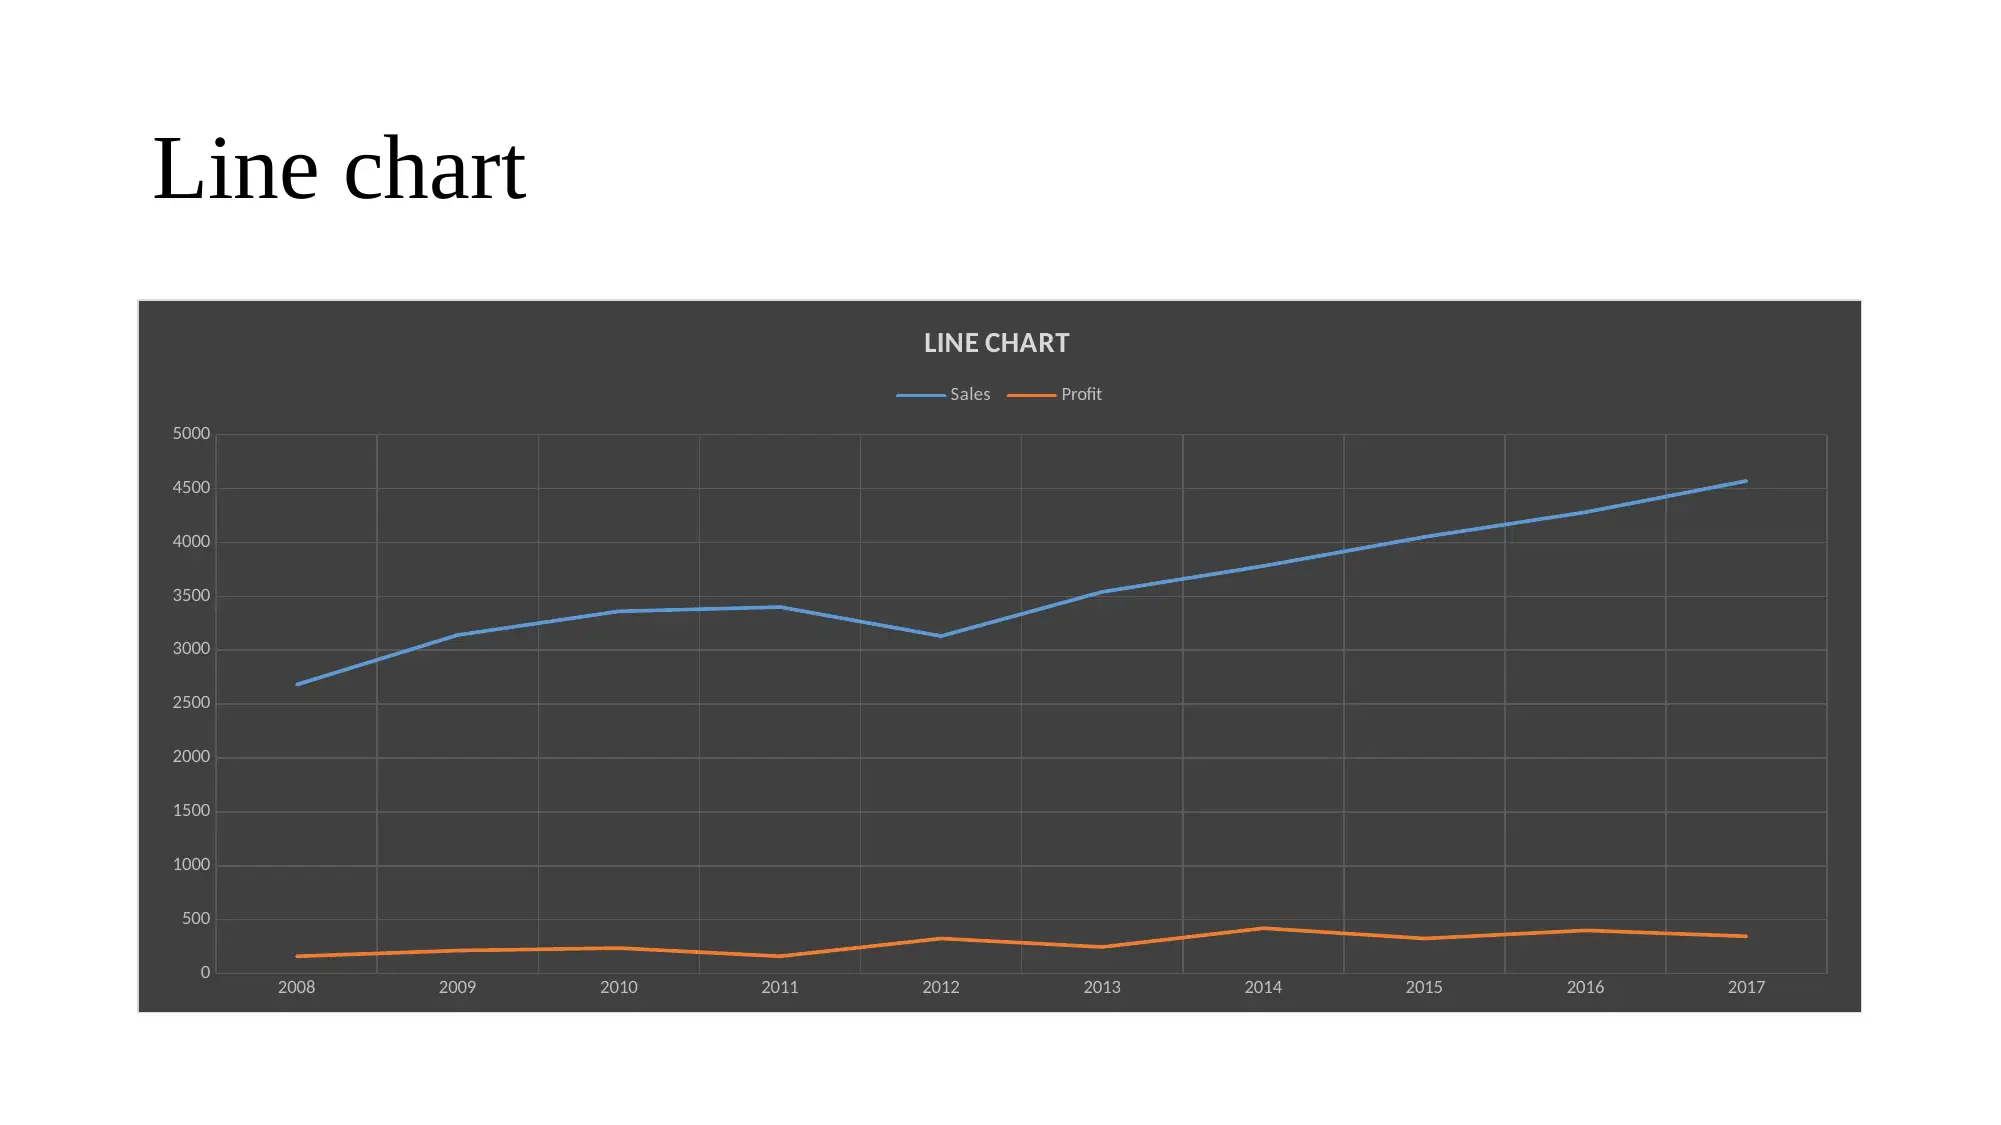
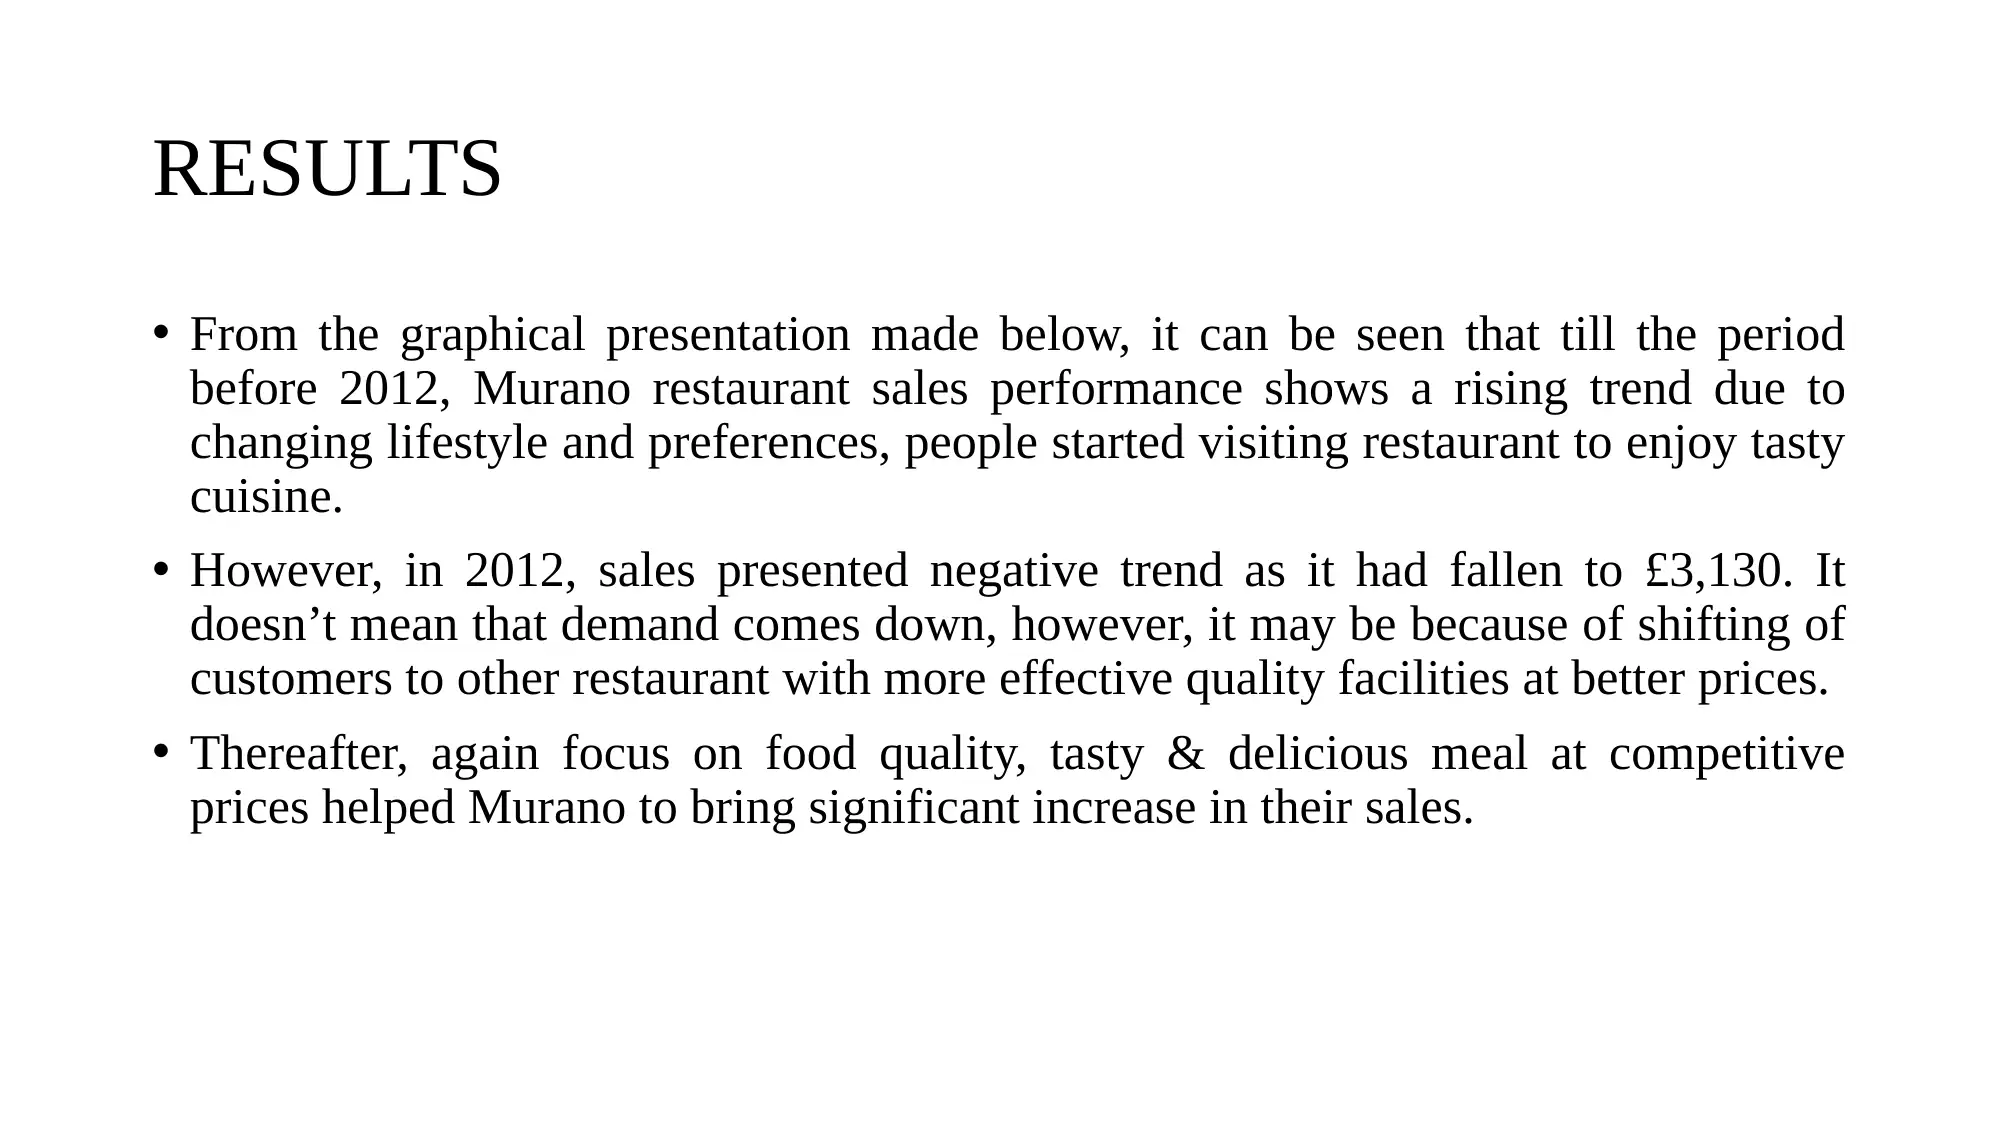
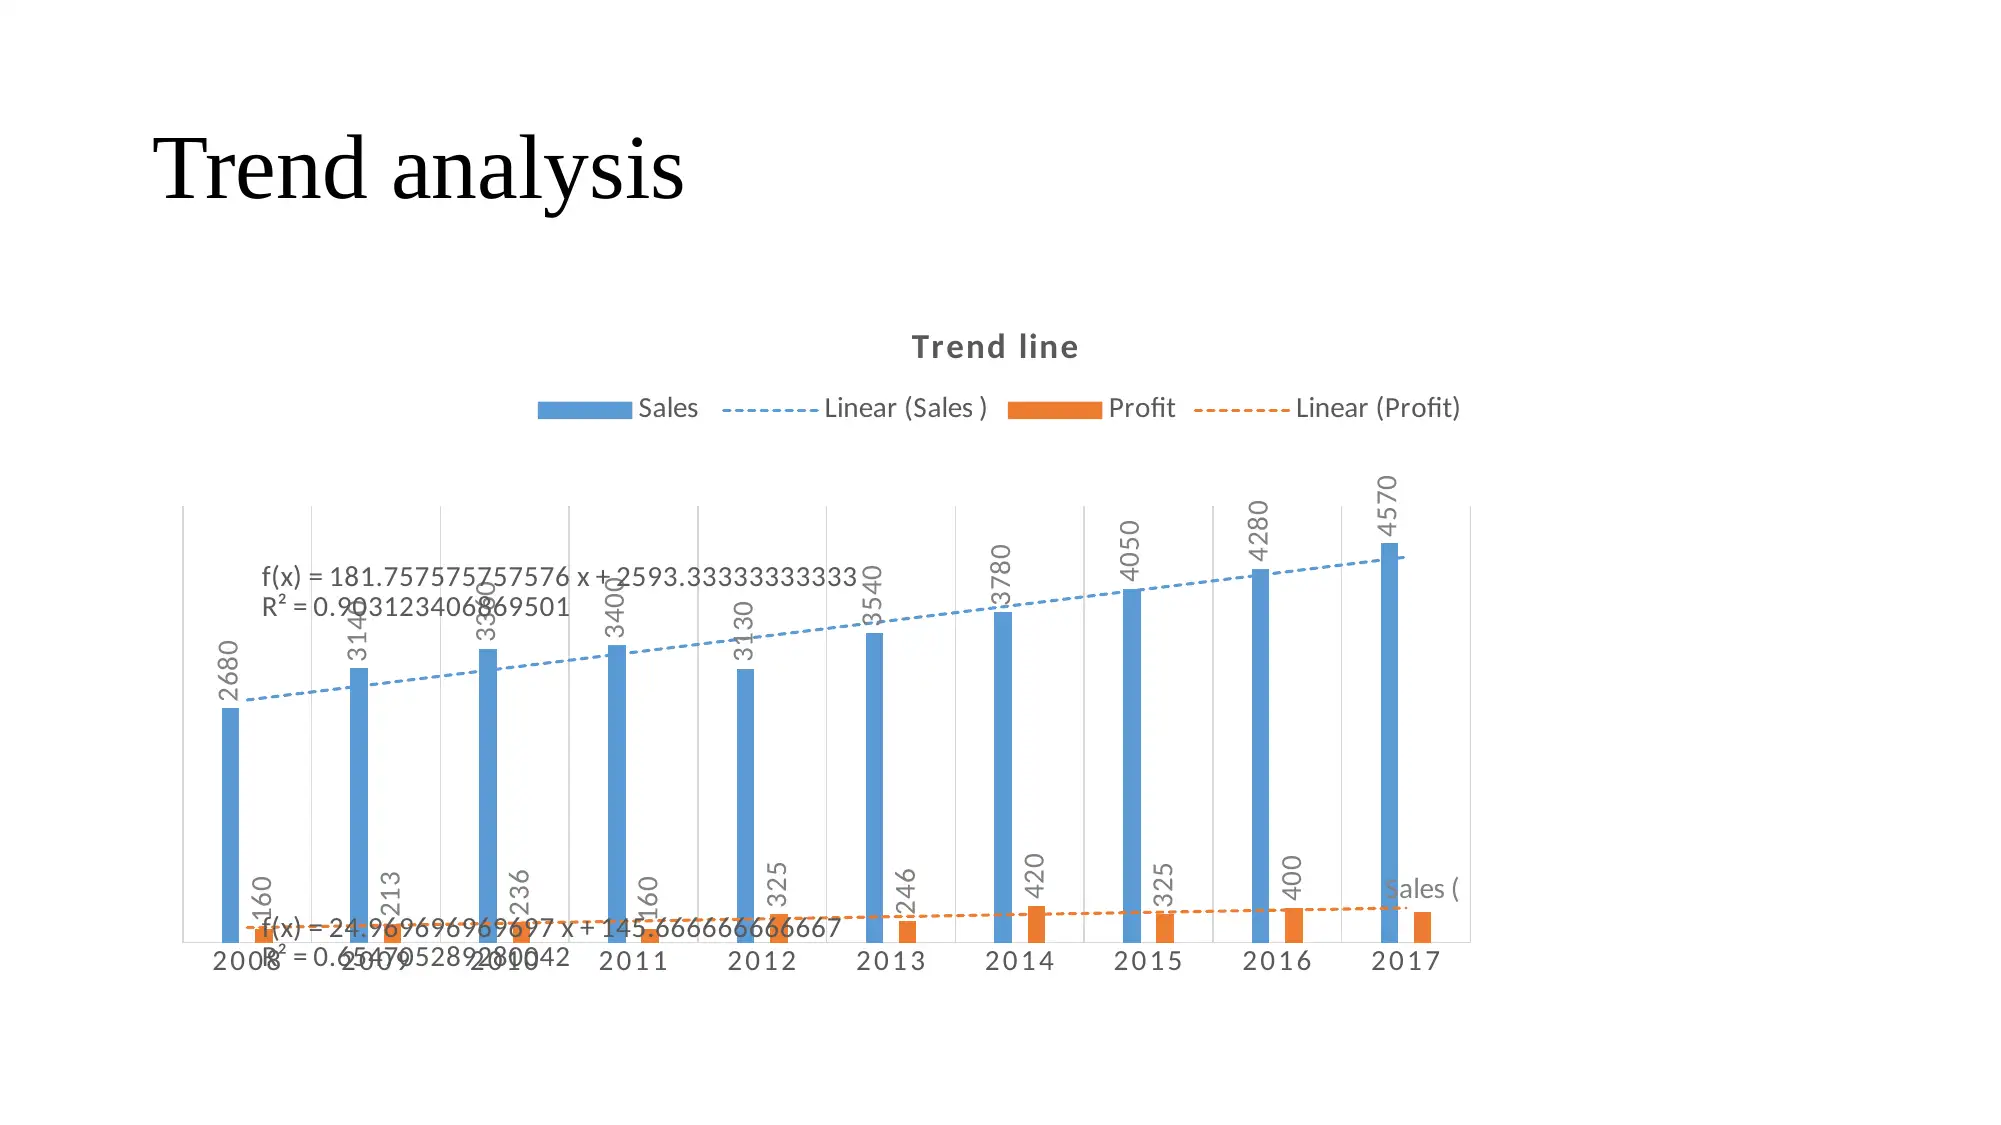
This report analyzes the sales and profit trends of Murano Restaurant from 2008 to 2017, using column, bar, and line charts to visualize the data. The analysis reveals a fluctuating sales performance, influenced by changing lifestyles, competition, and food quality. Profitability is affected by sales variations, ingredient costs, minimum wage laws, and digitalization. Trend analysis projects positive future results for Murano, driven by increasing demand for quality restaurants and potential expansion. The report references business decision-making and statistical analysis resources, providing a comprehensive overview of the restaurant's financial performance and future prospects.
Document Page
Business Decision Making
tabler-icon-diamond-filled.svg

Paraphrase This Document

Need a fresh take? Get an instant paraphrase of this document with our AI Paraphraser
Document Page
Column graph
2008 2009 2010 2011 2012 2013 2014 2015 2016 2017
0
500
1000
1500
2000
2500
3000
3500
4000
4500
5000
COLUMN CHART
Sales Profit
Document Page
Bar graph
2008
2009
2010
2011
2012
2013
2014
2015
2016
2017
0 500 1000 1500 2000 2500 3000 3500 4000 4500 5000
BAR CHART
Profit Sales
Document Page
Line chart
2008 2009 2010 2011 2012 2013 2014 2015 2016 2017
0
500
1000
1500
2000
2500
3000
3500
4000
4500
5000
LINE CHART
Sales Profit
tabler-icon-diamond-filled.svg

Paraphrase This Document

Need a fresh take? Get an instant paraphrase of this document with our AI Paraphraser
Document Page
RESULTS
From the graphical presentation made below, it can be seen that till the period
before 2012, Murano restaurant sales performance shows a rising trend due to
changing lifestyle and preferences, people started visiting restaurant to enjoy tasty
cuisine.
However, in 2012, sales presented negative trend as it had fallen to £3,130. It
doesn’t mean that demand comes down, however, it may be because of shifting of
customers to other restaurant with more effective quality facilities at better prices.
Thereafter, again focus on food quality, tasty & delicious meal at competitive
prices helped Murano to bring significant increase in their sales.
Document Page
Contd…
Although changing sales significantly affected profitability performance but it is
not the only reason and increasing cost of ingredients due to inflated prices,
coming of minimum wages act, rising overhead, digitalization and extra facilities
raised cost resultant less return. Over the period, profit performance shows a
fluctuating trend.
Document Page
Trend analysis
In corporate world, managers are concerned about future so that appropriate
policies and decisions can be made prior to succeed in the competitive
marketplace. Trend line is one of the simplest way to determine future trend.
tabler-icon-diamond-filled.svg

Paraphrase This Document

Need a fresh take? Get an instant paraphrase of this document with our AI Paraphraser
Document Page
Trend analysis
2 0 0 8 2 0 0 9 2 0 1 0 2 0 1 1 2 0 1 2 2 0 1 3 2 0 1 4 2 0 1 5 2 0 1 6 2 0 1 7
2680
3140
3360
3400
3130
3540
3780
4050
4280
4570
160
213
236
160
325
246
420
325
400
Sales (
f(x) = 181.757575757576 x + 2593.33333333333
R² = 0.903123406869501
f(x) = 24.969696969697 x + 145.666666666667
R² = 0.654705289280042
Trend line
Sales Linear (Sales ) Profit Linear (Profit)
Document Page
Interpretation
Above graphical presentations shows that future is expected to drive positive
results for Murano restaurant with the expectation of increase in its turnover and
profitability as well.
Looking to the current external market environment, change in people lifestyle
raised demand for quality restaurant who are rendering customers an exceptional
quality of tasty meal that exceed their expectations.
Visting restaurant to enjoy delicious meal in desired cuisine becomes an important
part of everyone’s life, thus, changing demographic factors and lifestyle raised
overall demand for Murano. Moreover, as business is thinking to open one more
outlet, thus, by this, it can serve more users and generate higher revenue and
profit.
Document Page
REFERENCES
Babajana, Z. and Phillips, P., 2016. Business Decision Making. Cengage
Learning.
Howell, D.C., 2016. Fundamental statistics for the behavioral sciences.
Nelson Education.
tabler-icon-diamond-filled.svg

Paraphrase This Document

Need a fresh take? Get an instant paraphrase of this document with our AI Paraphraser
Document Page
Thank You!
chevron_up_icon
1 out of 11
circle_padding
hide_on_mobile
zoom_out_icon
[object Object]