Numeracy Data & IT: Analysis of Fractions, Decimals, and Excel Use
VerifiedAdded on 2022/12/30
|20
|4577
|1
Homework Assignment
AI Summary
This assignment solution delves into numeracy concepts, focusing on fractions, decimals, and their application within an Excel environment. It addresses various numerical problems, including simplifying fractions, performing calculations with decimals, and calculating percentages. The solution demonstrates the use of Excel for data analysis, covering the creation of spreadsheets, the application of formulas, and the generation of charts and graphs. Key statistical concepts like mean, mode, median, and standard deviation are explained and calculated. The assignment also includes the analysis of a dataset related to Olympic medals, exploring data interpretation, identifying trends, and comparing performance across different countries. The solution provides detailed steps on how to rank data, filter specific criteria, and apply formulas to extract meaningful insights from the provided data. The use of appropriate chart types for data visualization is also discussed. The final sections cover the calculation of statistical measures and the application of Excel formulas for data manipulation, all aimed at providing a comprehensive understanding of numeracy and data analysis techniques.
Using Numeracy
Data & IT
Data & IT
Paraphrase This Document
Need a fresh take? Get an instant paraphrase of this document with our AI Paraphraser
Table of Contents
INTRODUCTION...........................................................................................................................5
QUESTION 1...................................................................................................................................5
a. Meaning of numerator:.............................................................................................................5
b. Meaning of denominator:.........................................................................................................5
QUESTION 2...................................................................................................................................5
Express 24/40 and 18/42 in their simplest forms:........................................................................5
QUESTION 3...................................................................................................................................6
a) Express the fractions 2/3, 3//4 and 5/6 as equivalent fractions with a denominator of 12:.....6
b. Making up the two thirds of the remainder:.............................................................................6
QUESTION 4...................................................................................................................................6
Price of each pair of the running shoes:.......................................................................................6
QUESTION 5...................................................................................................................................7
What is 240.50 x 19.54:...............................................................................................................7
Write the number 52100 as a power of 10:..................................................................................7
QUESTION 6...................................................................................................................................7
a. Total saving made by Patty and her siblings:...........................................................................7
b. Average saving per person:......................................................................................................7
QUESTION 7...................................................................................................................................7
a. 3 / 4 – 7 / 9 + 2 / 3:...................................................................................................................7
b. Largest number from all the values:........................................................................................7
QUESTION 8...................................................................................................................................8
Percentage of man said No.:.......................................................................................................8
QUESTION 9...................................................................................................................................8
The latest time that Annabelle can leave home:..........................................................................8
QUESTION 10.................................................................................................................................8
Analysis of the box which is heavier:..........................................................................................8
QUESTION 11.................................................................................................................................8
a. country had the lowest number of overall medals among the ten countries:...........................8
b. h country/countries competed in the least number of games:..................................................9
c. the mode in the number of games countries participated in:...................................................9
d. the range between the gold medals awarded to the 10 countries:............................................9
e. How many countries got more silver medals than bronze medals:..........................................9
f. which country/countries got more gold medals, more silver medals and more bronze medals
than Great Britain:........................................................................................................................9
g. The country which performed best:.........................................................................................9
h. Reason for which country Jamaica does not shows in the top 10 medals:..............................9
i. Determination of medal category which US performed its closest competitors:...................10
j. 3 countries had the most evenly distributed number of gold, silver and bronze medals:.......10
QUESTION 12...............................................................................................................................10
The spreadsheet by use of Excel:...............................................................................................10
QUESTION 13...............................................................................................................................10
a. Actions or steps in Excel can you take to rank them from 1st to 10th:..................................10
b. Specific actions or steps in excel which will produce a list of the countries with 800 or more
medals in total:...........................................................................................................................11
c. The graphs which will be suitable for representing only gold medals information:..............11
d. In which column(s) might replication have been used:.........................................................13
e. Excel formula can be used to calculate the overall total medals awarded:............................13
QUESTION 14...............................................................................................................................13
a. Formula for the total number of medals for Germany and Great Britain:.............................13
b. Formula for the average number of silver medals for a European country:..........................13
c. Formula for sum the Medals Total for Gold for those countries with less than 20 games
involvement:..............................................................................................................................13
d. Formula for the database for finding Italy and also the corresponding total medals:............13
QUESTION 15...............................................................................................................................14
a. Calculation of median numbers for the each medal and the formula for defining this:.........14
Medium = n / 2 ..........................................................................................................................14
b. Calculation of mean number and the formula for defining each number:.............................14
c. Calculation of standard deviation of the total medals awarded to each country:...................15
d. Spreadsheet for standard deviation by given data:................................................................17
QUESTION 16...............................................................................................................................17
⊘ This is a preview!⊘
Do you want full access?
Subscribe today to unlock all pages.
Trusted by 1+ million students worldwide

a. Appropriate chart for compare the gold, silver and bronze medals:......................................17
b. Appropriate chart to reflect the contribution of each country to the overall medals total:....17
CONCLUSION..............................................................................................................................18
REFERENCES..............................................................................................................................19
Paraphrase This Document
Need a fresh take? Get an instant paraphrase of this document with our AI Paraphraser
INTRODUCTION
Numeracy is refers to ability to apply easiest numerical concepts. It is the knowledge,
behaviours, skills that persons needs to use in mathematics and excel in various situations. It
helps solving, understanding mathematics in the world. It is important to know excel in business
because everything is done by software now. People shows data through excel sheet in order to
present data. Numerical data shows various real time situation in quantitative terms for making
easy to understand. For example, if anyone wants to know temperature, to understand in degree
will be easy for that person (Behle and Behle, 2017). This report is totally based on excel sheet
and graph analysis. This report covers topics such as use of basic numerical numbers, functions,
decimals, integers, calculations of proportions, percentage, mean, mode, median, averages with
ratios. Apart from this it also covers topics such as creating graphs by using simple data,
spreadsheets are also covers in this report.
QUESTION 1
a. Meaning of numerator:
Numerator: In the fraction the top number defined how much part we have from the
total, this part is known as numerator. For example, the fraction 3 / 15 in this part out of 15, 3 are
there this means 3 is known as numerator.
b. Meaning of denominator:
Denominator: It shows total part of anything and how many parts the item is devided
equally. For example, there are 15 apples and the partition like this 3 / 15, in this 15 is known as
denominator (Bennison, 2020).
QUESTION 2
Express 24/40 and 18/42 in their simplest forms:
To defining 24 / 40 in simplest form it is shows as 3 /5 and to defining 18 / 42 in simplest
form it is shows as 3 / 7. In this calculation it divides fraction till it possible.
QUESTION 3
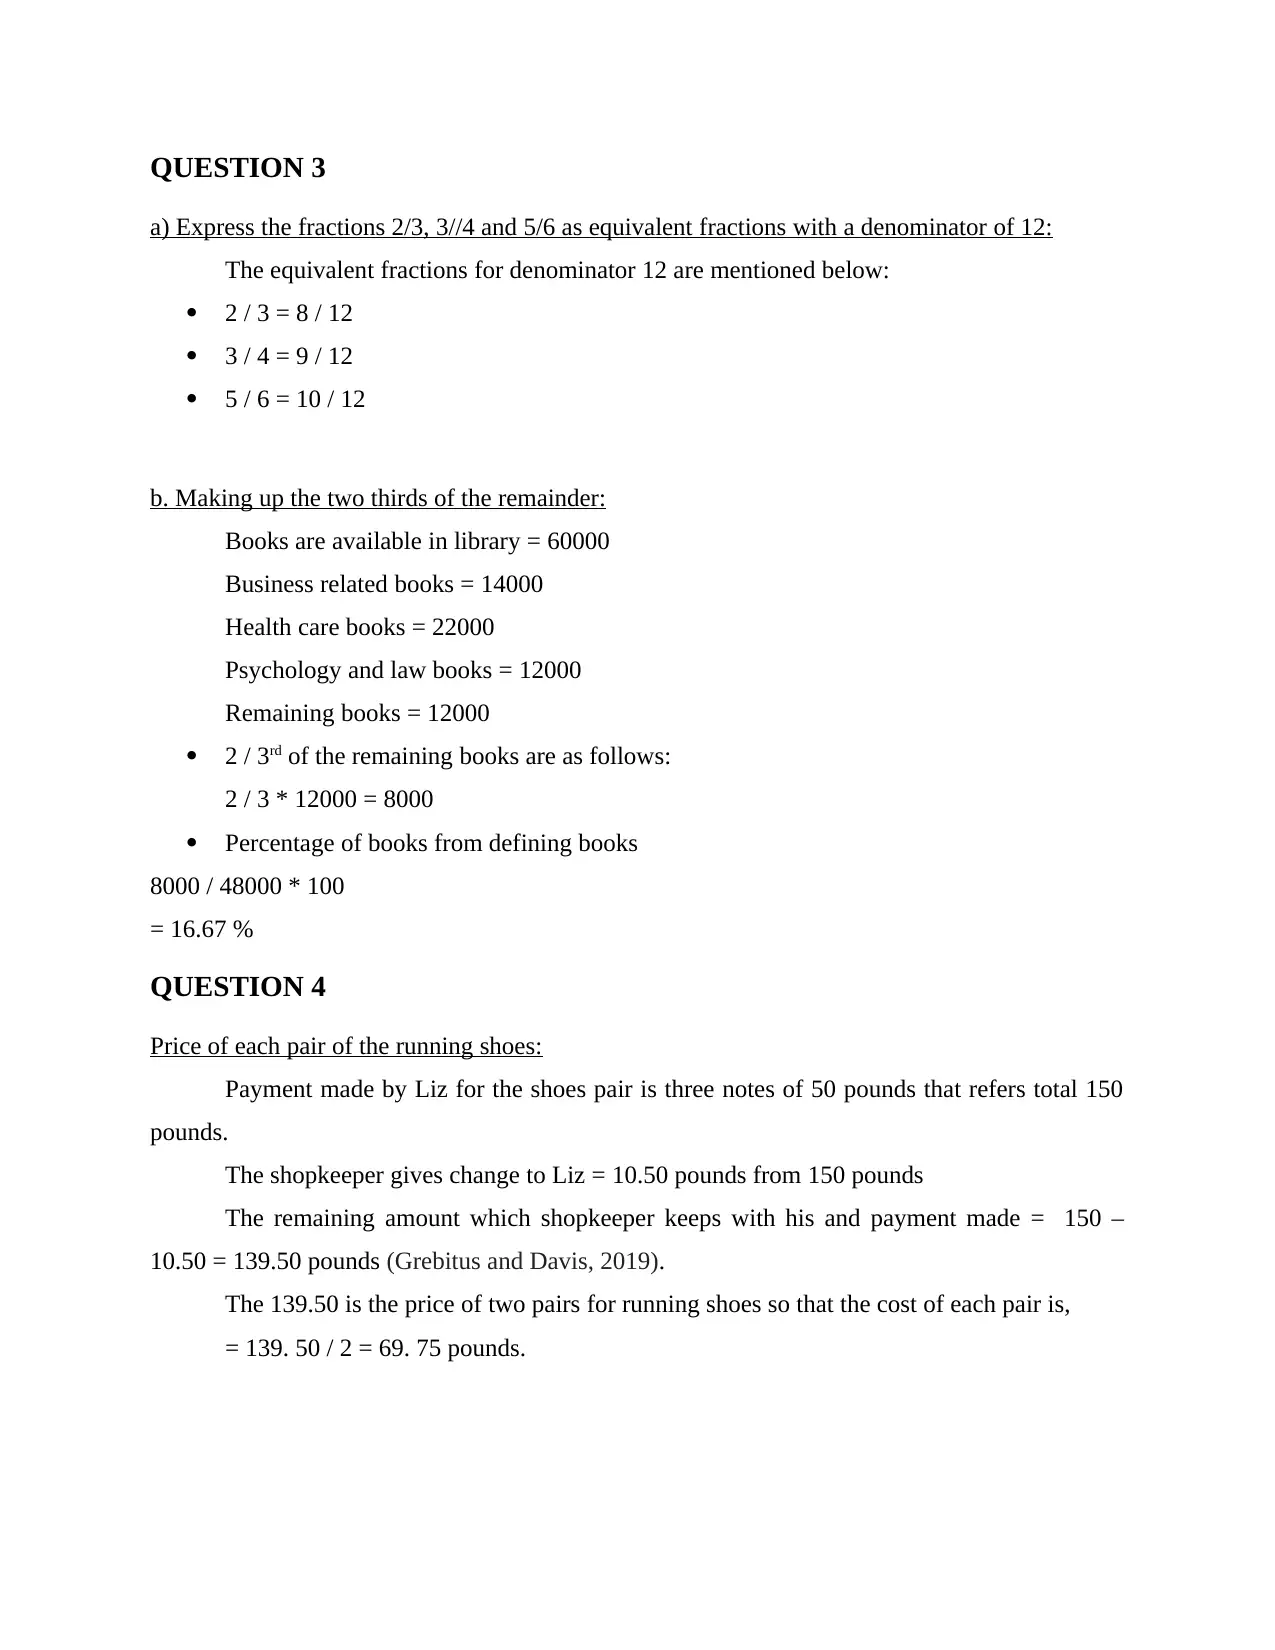
a) Express the fractions 2/3, 3//4 and 5/6 as equivalent fractions with a denominator of 12:
The equivalent fractions for denominator 12 are mentioned below:
2 / 3 = 8 / 12
3 / 4 = 9 / 12
5 / 6 = 10 / 12
b. Making up the two thirds of the remainder:
Books are available in library = 60000
Business related books = 14000
Health care books = 22000
Psychology and law books = 12000
Remaining books = 12000
2 / 3rd of the remaining books are as follows:
2 / 3 * 12000 = 8000
Percentage of books from defining books
8000 / 48000 * 100
= 16.67 %
QUESTION 4
Price of each pair of the running shoes:
Payment made by Liz for the shoes pair is three notes of 50 pounds that refers total 150
pounds.
The shopkeeper gives change to Liz = 10.50 pounds from 150 pounds
The remaining amount which shopkeeper keeps with his and payment made = 150 –
10.50 = 139.50 pounds (Grebitus and Davis, 2019).
The 139.50 is the price of two pairs for running shoes so that the cost of each pair is,
= 139. 50 / 2 = 69. 75 pounds.
⊘ This is a preview!⊘
Do you want full access?
Subscribe today to unlock all pages.
Trusted by 1+ million students worldwide
QUESTION 5
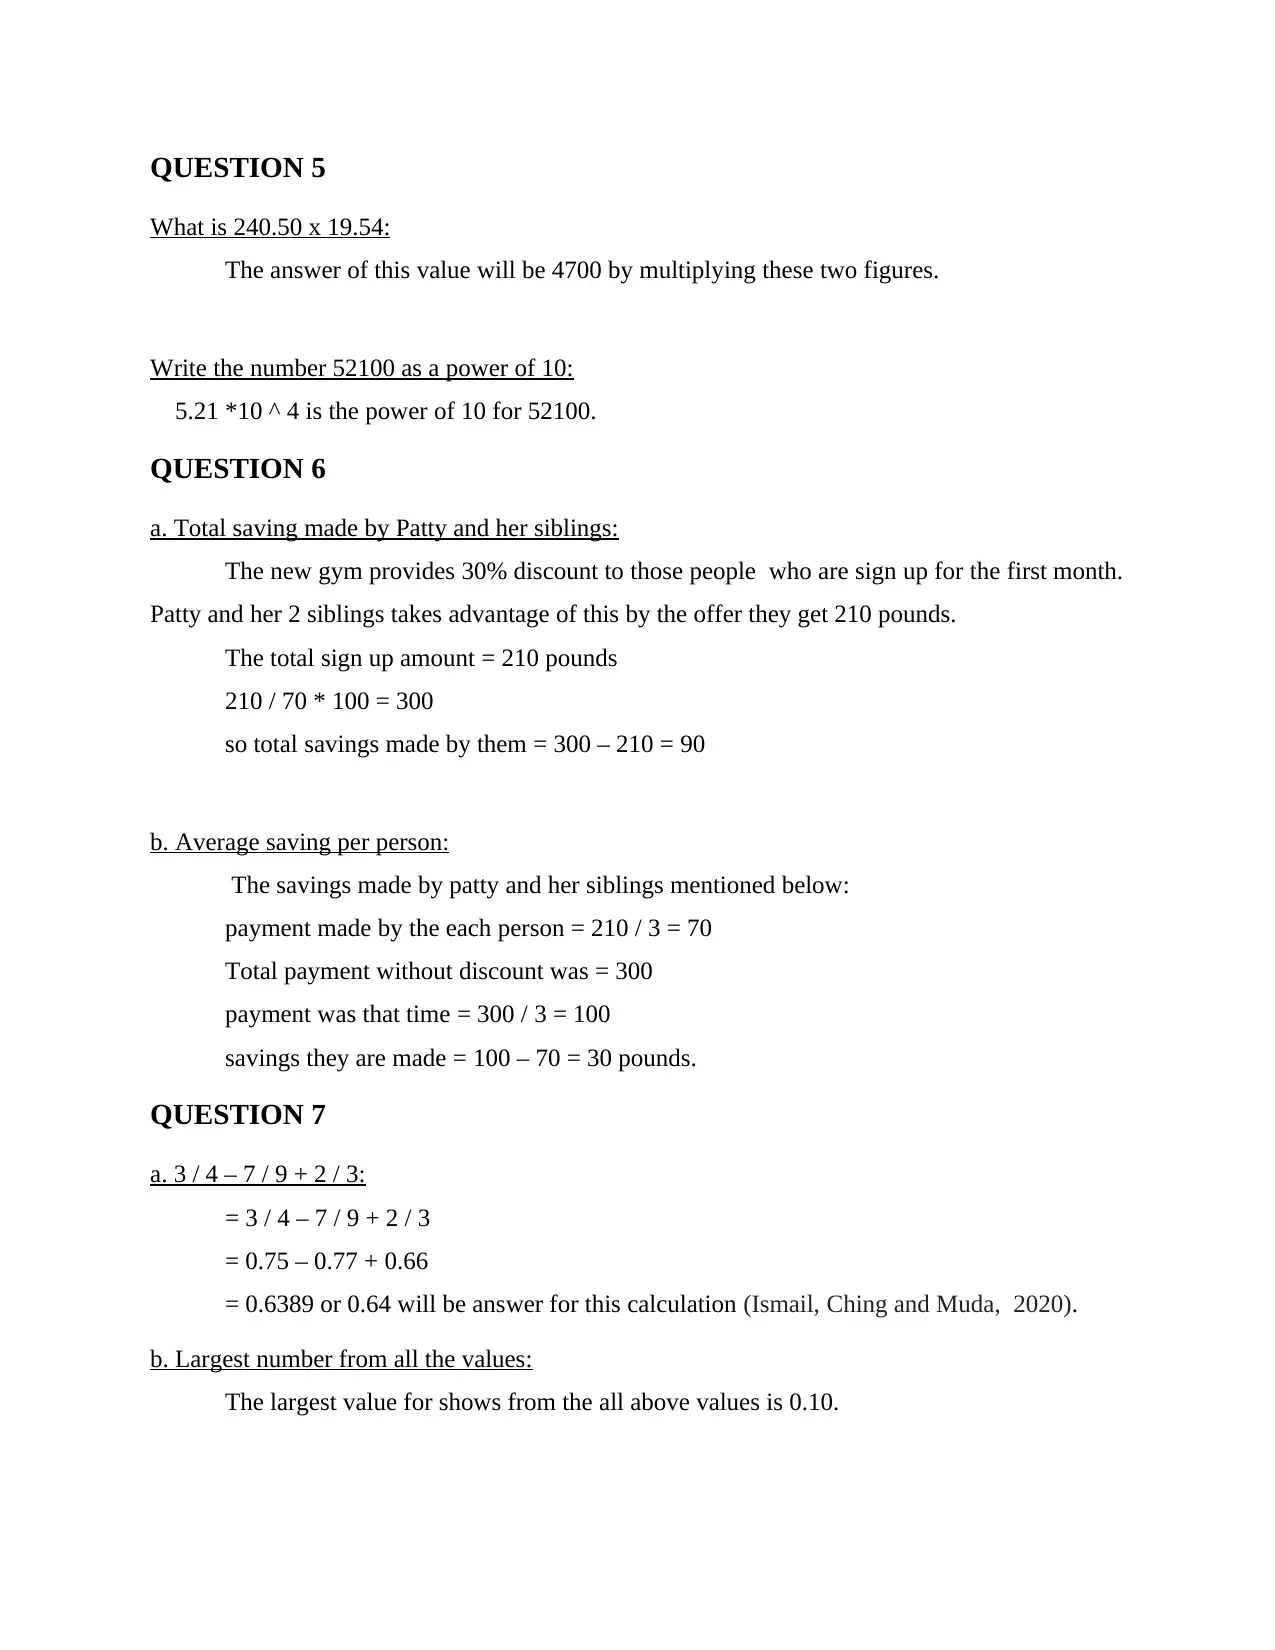
What is 240.50 x 19.54:
The answer of this value will be 4700 by multiplying these two figures.
Write the number 52100 as a power of 10:
5.21 *10 ^ 4 is the power of 10 for 52100.
QUESTION 6
a. Total saving made by Patty and her siblings:
The new gym provides 30% discount to those people who are sign up for the first month.
Patty and her 2 siblings takes advantage of this by the offer they get 210 pounds.
The total sign up amount = 210 pounds
210 / 70 * 100 = 300
so total savings made by them = 300 – 210 = 90
b. Average saving per person:
The savings made by patty and her siblings mentioned below:
payment made by the each person = 210 / 3 = 70
Total payment without discount was = 300
payment was that time = 300 / 3 = 100
savings they are made = 100 – 70 = 30 pounds.
QUESTION 7
a. 3 / 4 – 7 / 9 + 2 / 3:
= 3 / 4 – 7 / 9 + 2 / 3
= 0.75 – 0.77 + 0.66
= 0.6389 or 0.64 will be answer for this calculation (Ismail, Ching and Muda, 2020).
b. Largest number from all the values:
The largest value for shows from the all above values is 0.10.
Paraphrase This Document
Need a fresh take? Get an instant paraphrase of this document with our AI Paraphraser
QUESTION 8
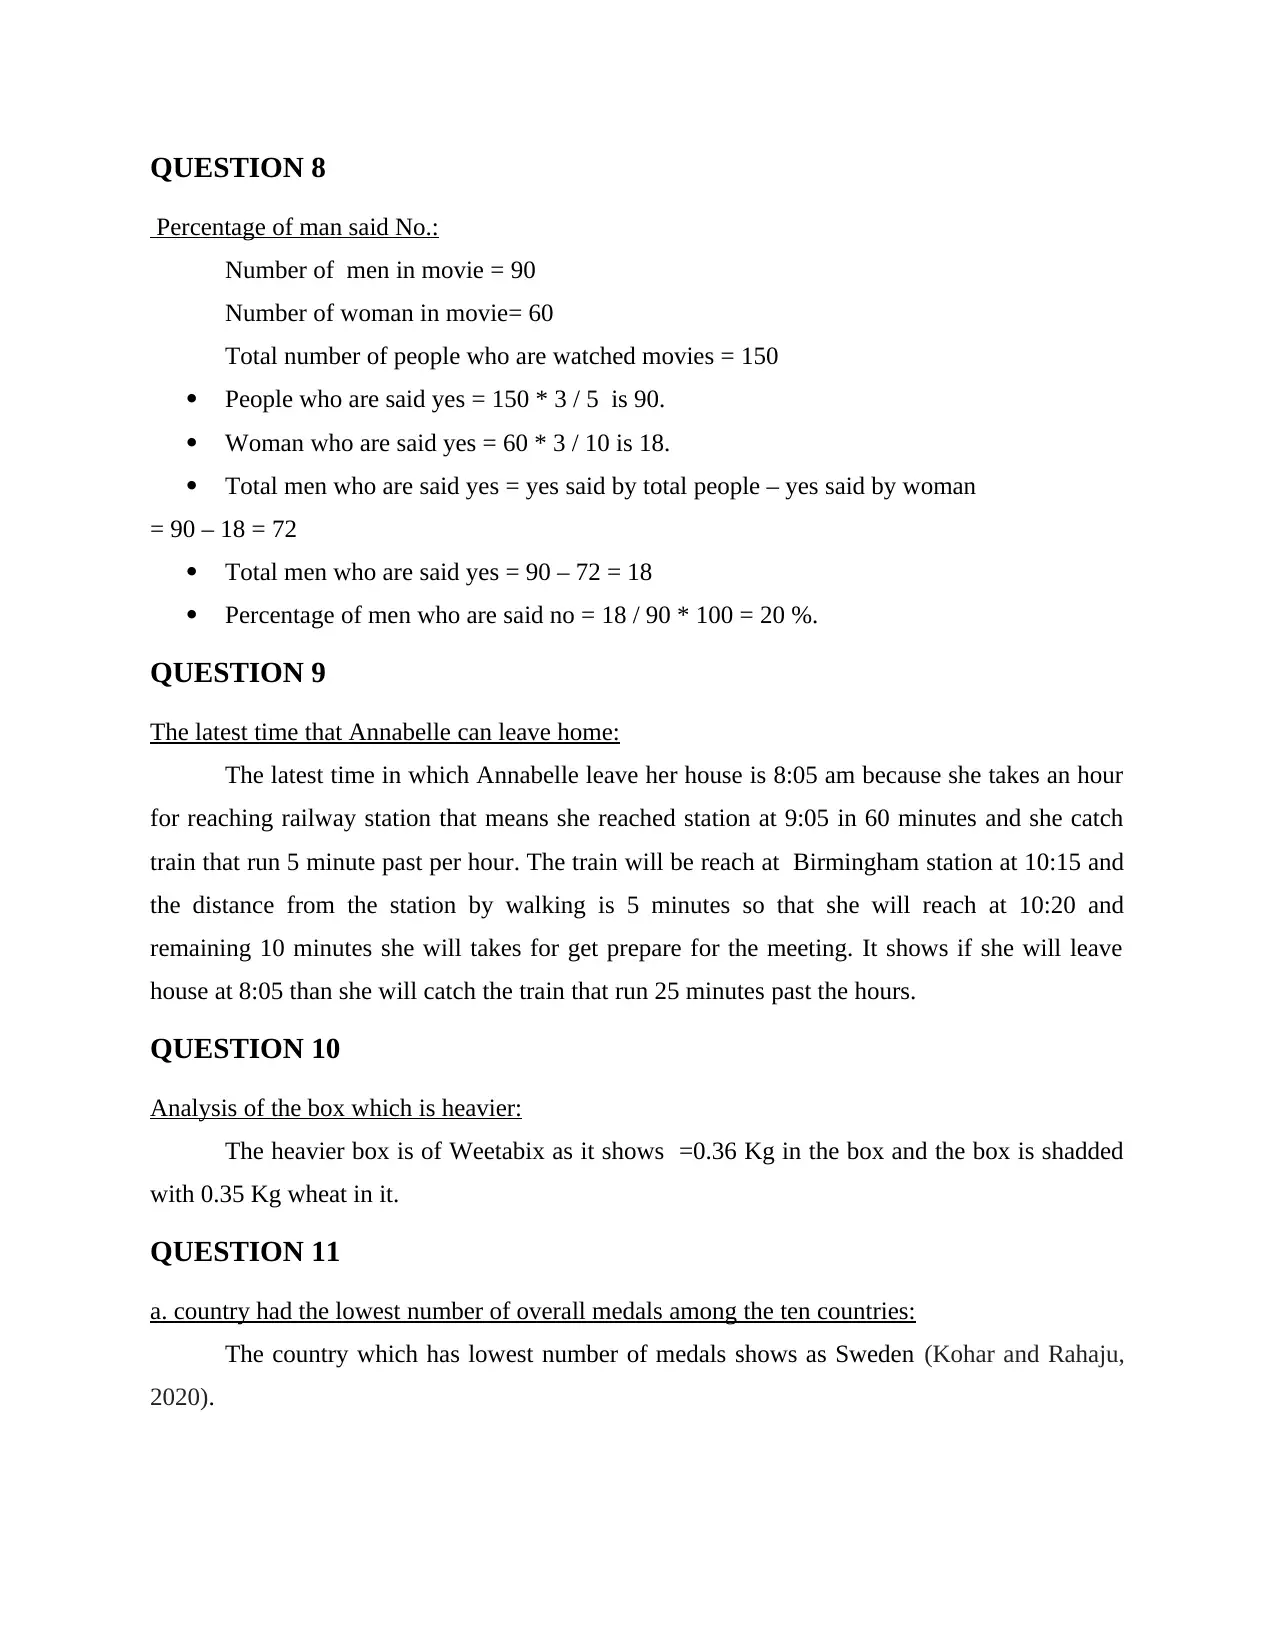
Percentage of man said No.:
Number of men in movie = 90
Number of woman in movie= 60
Total number of people who are watched movies = 150
People who are said yes = 150 * 3 / 5 is 90.
Woman who are said yes = 60 * 3 / 10 is 18.
Total men who are said yes = yes said by total people – yes said by woman
= 90 – 18 = 72
Total men who are said yes = 90 – 72 = 18
Percentage of men who are said no = 18 / 90 * 100 = 20 %.
QUESTION 9
The latest time that Annabelle can leave home:
The latest time in which Annabelle leave her house is 8:05 am because she takes an hour
for reaching railway station that means she reached station at 9:05 in 60 minutes and she catch
train that run 5 minute past per hour. The train will be reach at Birmingham station at 10:15 and
the distance from the station by walking is 5 minutes so that she will reach at 10:20 and
remaining 10 minutes she will takes for get prepare for the meeting. It shows if she will leave
house at 8:05 than she will catch the train that run 25 minutes past the hours.
QUESTION 10
Analysis of the box which is heavier:
The heavier box is of Weetabix as it shows =0.36 Kg in the box and the box is shadded
with 0.35 Kg wheat in it.
QUESTION 11
a. country had the lowest number of overall medals among the ten countries:
The country which has lowest number of medals shows as Sweden (Kohar and Rahaju,
2020).
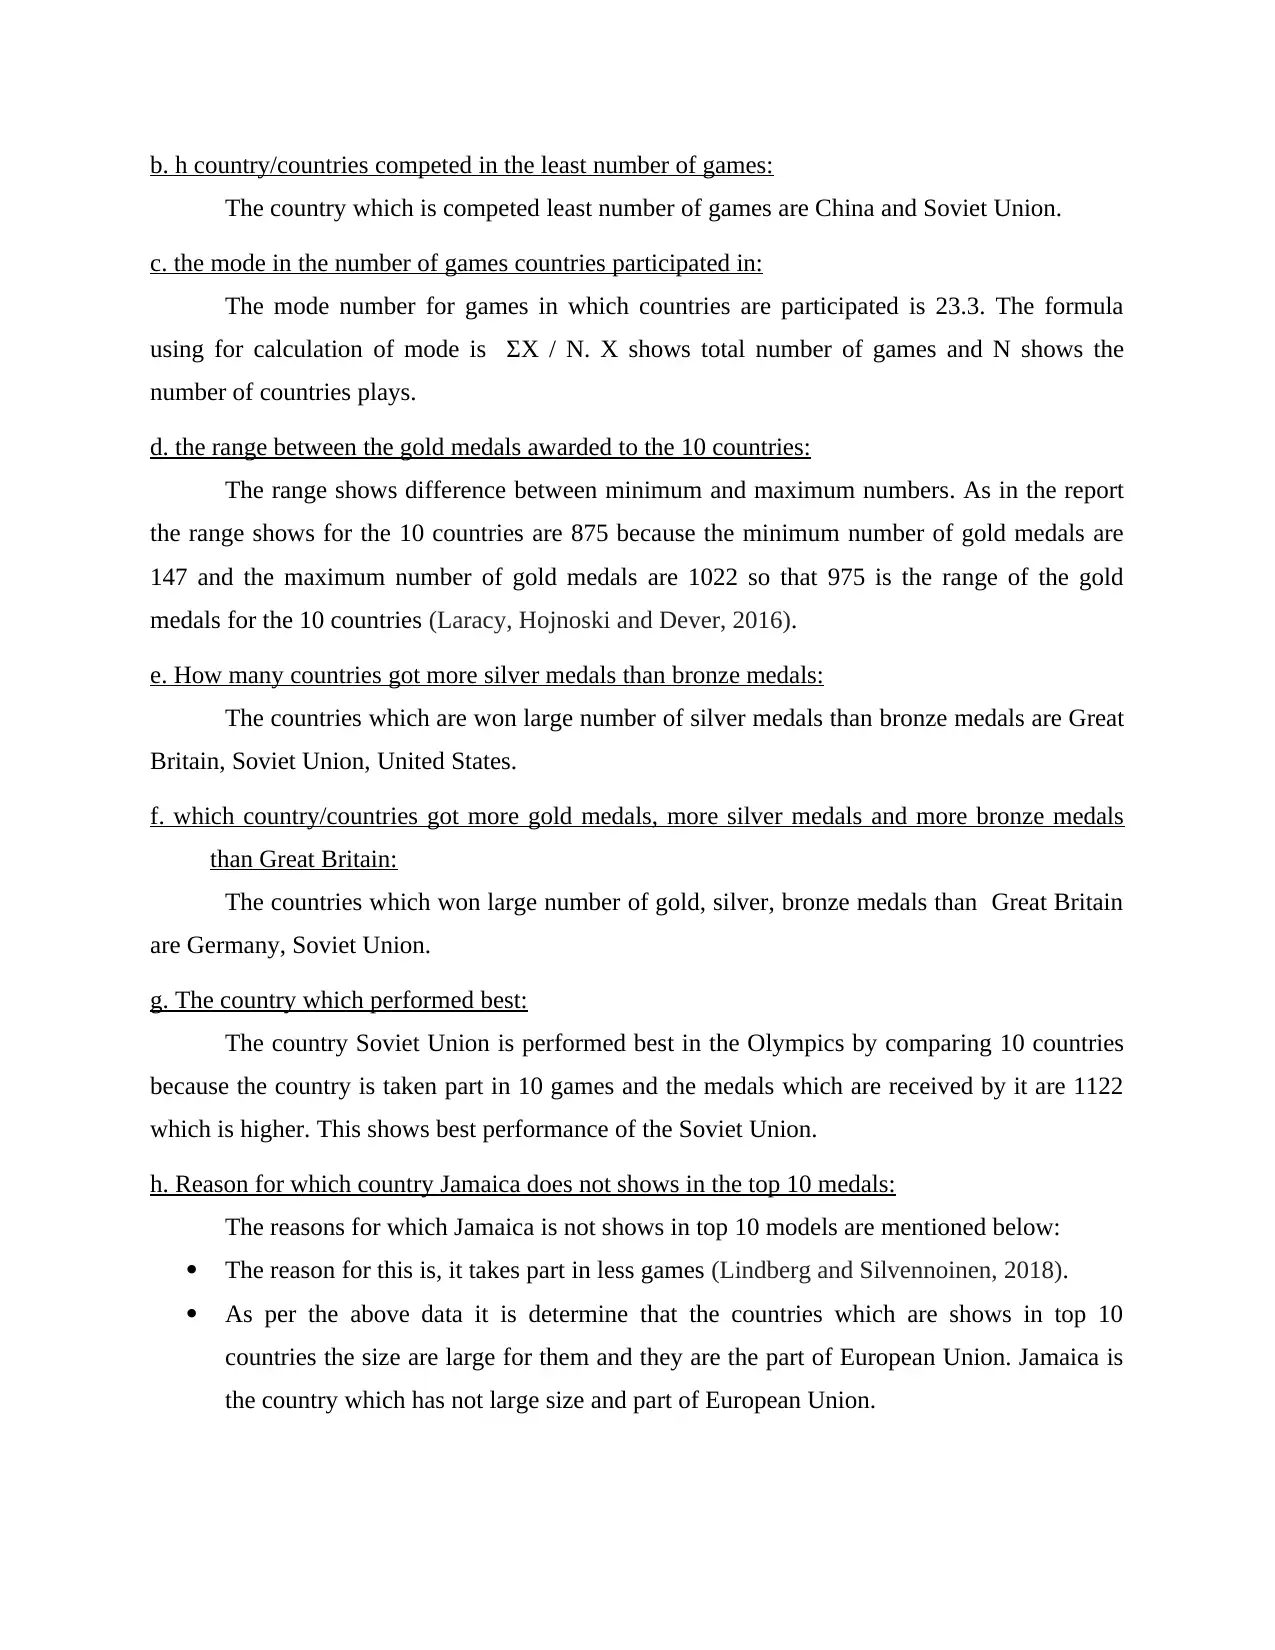
b. h country/countries competed in the least number of games:
The country which is competed least number of games are China and Soviet Union.
c. the mode in the number of games countries participated in:
The mode number for games in which countries are participated is 23.3. The formula
using for calculation of mode is ΣX / N. X shows total number of games and N shows the
number of countries plays.
d. the range between the gold medals awarded to the 10 countries:
The range shows difference between minimum and maximum numbers. As in the report
the range shows for the 10 countries are 875 because the minimum number of gold medals are
147 and the maximum number of gold medals are 1022 so that 975 is the range of the gold
medals for the 10 countries (Laracy, Hojnoski and Dever, 2016).
e. How many countries got more silver medals than bronze medals:
The countries which are won large number of silver medals than bronze medals are Great
Britain, Soviet Union, United States.
f. which country/countries got more gold medals, more silver medals and more bronze medals
than Great Britain:
The countries which won large number of gold, silver, bronze medals than Great Britain
are Germany, Soviet Union.
g. The country which performed best:
The country Soviet Union is performed best in the Olympics by comparing 10 countries
because the country is taken part in 10 games and the medals which are received by it are 1122
which is higher. This shows best performance of the Soviet Union.
h. Reason for which country Jamaica does not shows in the top 10 medals:
The reasons for which Jamaica is not shows in top 10 models are mentioned below:
The reason for this is, it takes part in less games (Lindberg and Silvennoinen, 2018).
As per the above data it is determine that the countries which are shows in top 10
countries the size are large for them and they are the part of European Union. Jamaica is
the country which has not large size and part of European Union.
⊘ This is a preview!⊘
Do you want full access?
Subscribe today to unlock all pages.
Trusted by 1+ million students worldwide
i. Determination of medal category which US performed its closest competitors:
As per the above data it shows list of top 10 countries which determines that silver and
bronze medals United states performed which is closest in competition of Soviet Union.
j. 3 countries had the most evenly distributed number of gold, silver and bronze medals:
As per the above data it shows top 10 countries, it has been determine that the countries
which are evenly distributed number of gold, silver and bronze medals are Australia, Hungry,
Sweden.
QUESTION 12
The spreadsheet by use of Excel:
Olympic Games Medals Table (Top 10)
Team Total Games Silver Gold Bronze Total
Australia 26 163 147 187 497
China 10 165 227 151 543
France 28 241 212 260 713
Germany 24 313 275 349 937
Great Britain 28 295 263 289 847
Hungry 26 147 175 169 491
Italy 27 178 206 193 577
Soviet Union 10 357 440 325 1122
Sweden 27 170 147 179 496
United States 27 794 1022 704 2520
QUESTION 13
a. Actions or steps in Excel can you take to rank them from 1st to 10th:
In order to giving ranks to the countries following steps are taken which are mentioned
below:
Step 1: In the first step we have to apply rank function in the data which have to rank.
Paraphrase This Document
Need a fresh take? Get an instant paraphrase of this document with our AI Paraphraser
Step 2: In the second step selection of range which is required is done. For example,
=RANK( B3, B3:B15)
Step 3: In the third step ranks will provides to all selected figures (Mukwambo, Mhakure
and Sitwala, 2020).
b. Specific actions or steps in excel which will produce a list of the countries with 800 or more
medals in total:
In this it produce the list of countries with 800 and the more medals are required for more
medals.
Step 1: In this step we selected the rows which are required to be grouped in 800 and
more models.
Step 2: In this step it is required for go to the data ribbon.
Step 3: In this step the group which is required to be selected has been selected.
Step 4: In this step group will be selected again as per requirement.
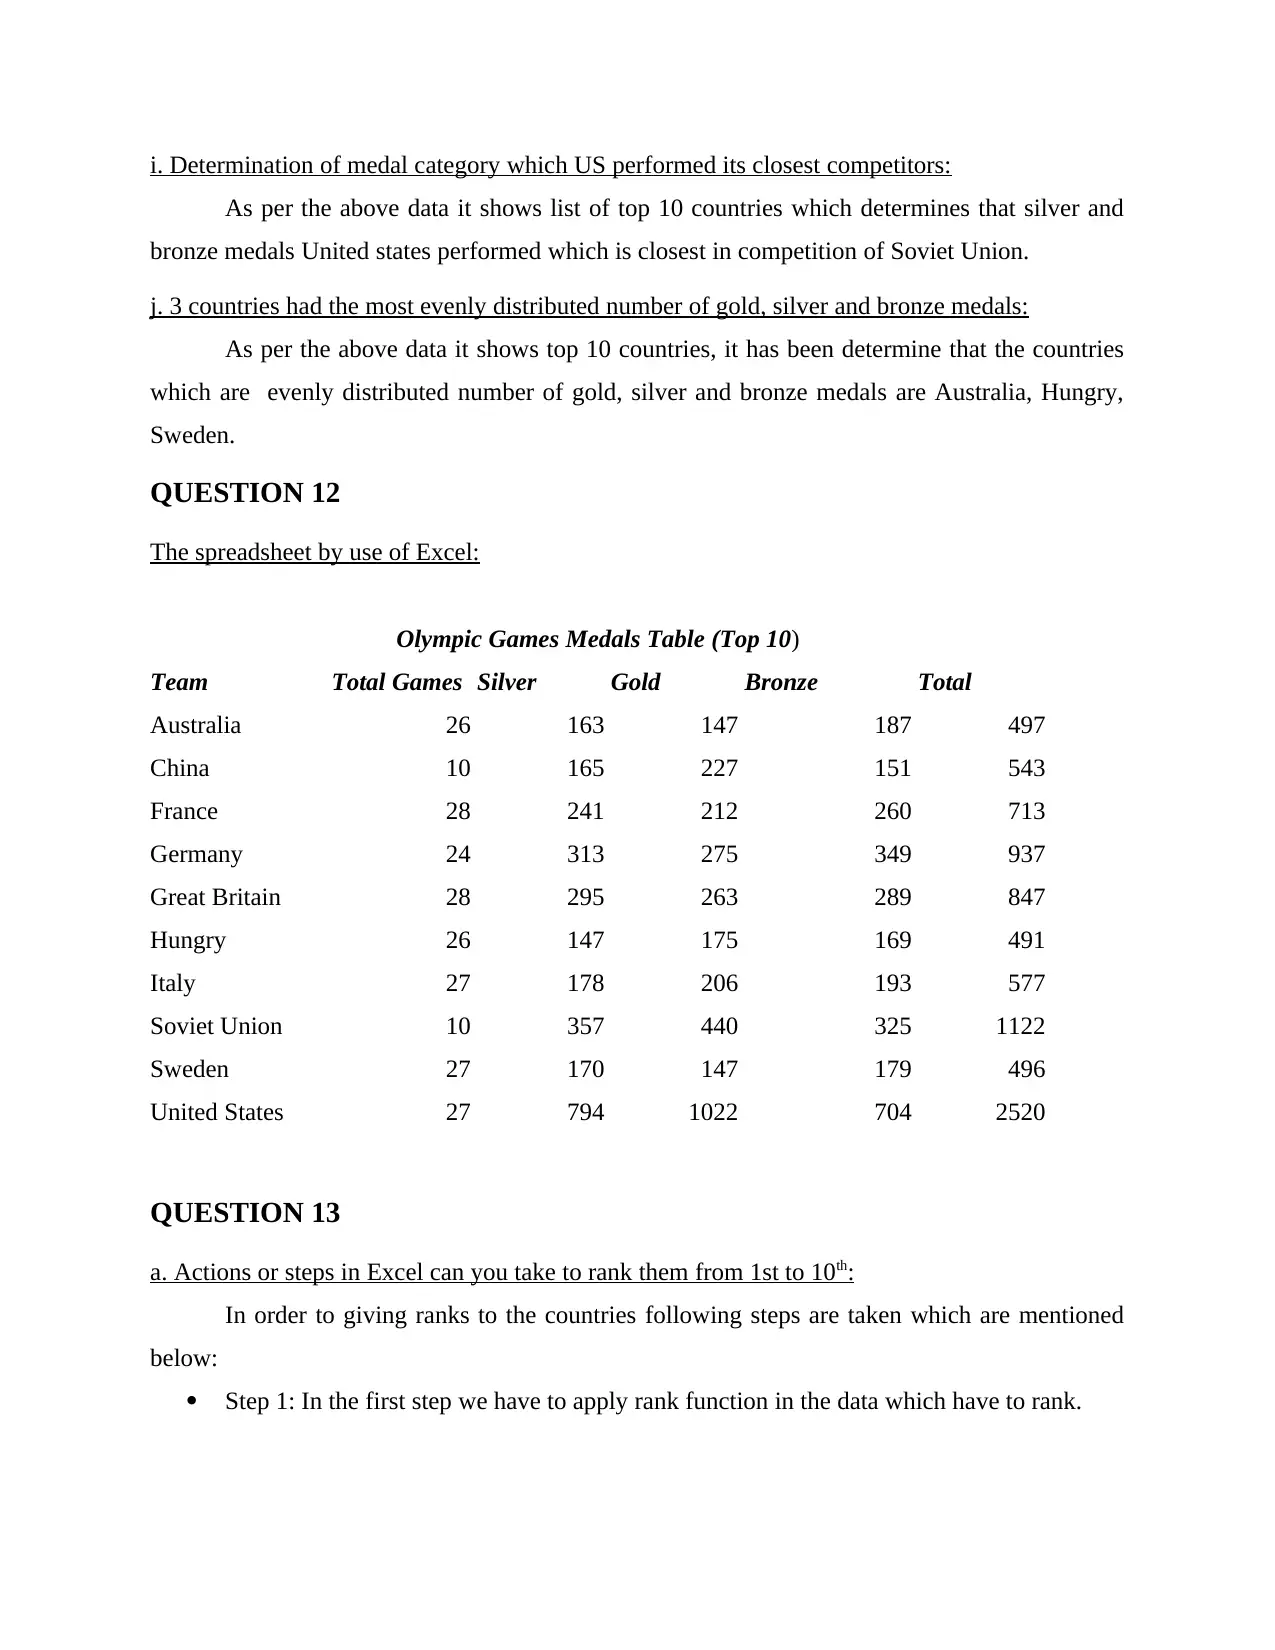
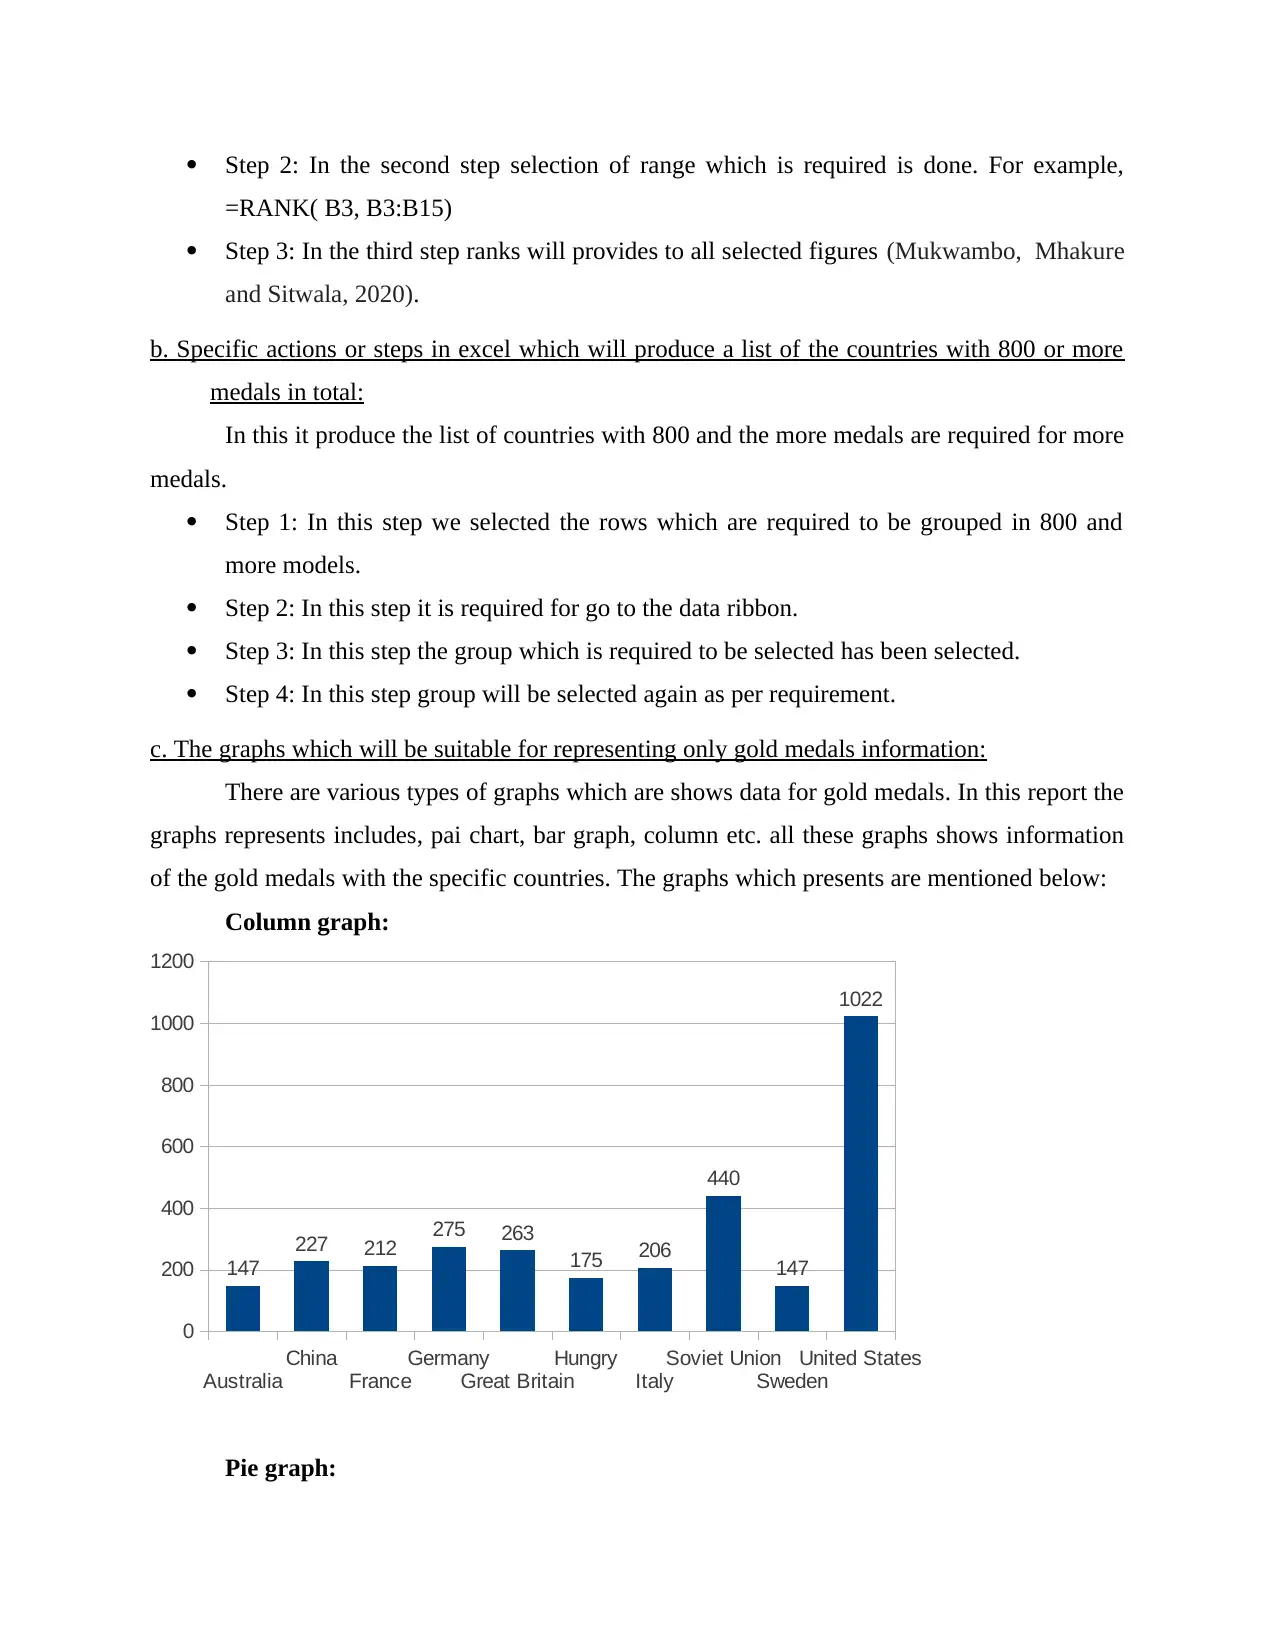
c. The graphs which will be suitable for representing only gold medals information:
There are various types of graphs which are shows data for gold medals. In this report the
graphs represents includes, pai chart, bar graph, column etc. all these graphs shows information
of the gold medals with the specific countries. The graphs which presents are mentioned below:
Column graph:
Australia
China
France
Germany
Great Britain
Hungry
Italy
Soviet Union
Sweden
United States
0
200
400
600
800
1000
1200
147
227 212 275 263
175 206
440
147
1022
Pie graph:
=RANK( B3, B3:B15)
Step 3: In the third step ranks will provides to all selected figures (Mukwambo, Mhakure
and Sitwala, 2020).
b. Specific actions or steps in excel which will produce a list of the countries with 800 or more
medals in total:
In this it produce the list of countries with 800 and the more medals are required for more
medals.
Step 1: In this step we selected the rows which are required to be grouped in 800 and
more models.
Step 2: In this step it is required for go to the data ribbon.
Step 3: In this step the group which is required to be selected has been selected.
Step 4: In this step group will be selected again as per requirement.
c. The graphs which will be suitable for representing only gold medals information:
There are various types of graphs which are shows data for gold medals. In this report the
graphs represents includes, pai chart, bar graph, column etc. all these graphs shows information
of the gold medals with the specific countries. The graphs which presents are mentioned below:
Column graph:
Australia
China
France
Germany
Great Britain
Hungry
Italy
Soviet Union
Sweden
United States
0
200
400
600
800
1000
1200
147
227 212 275 263
175 206
440
147
1022
Pie graph:
147
227
212
275
263
175
206 440
147
1022 Australia
China
France
Germany
Great Britain
Hungry
Italy
Soviet Union
Sweden
United States
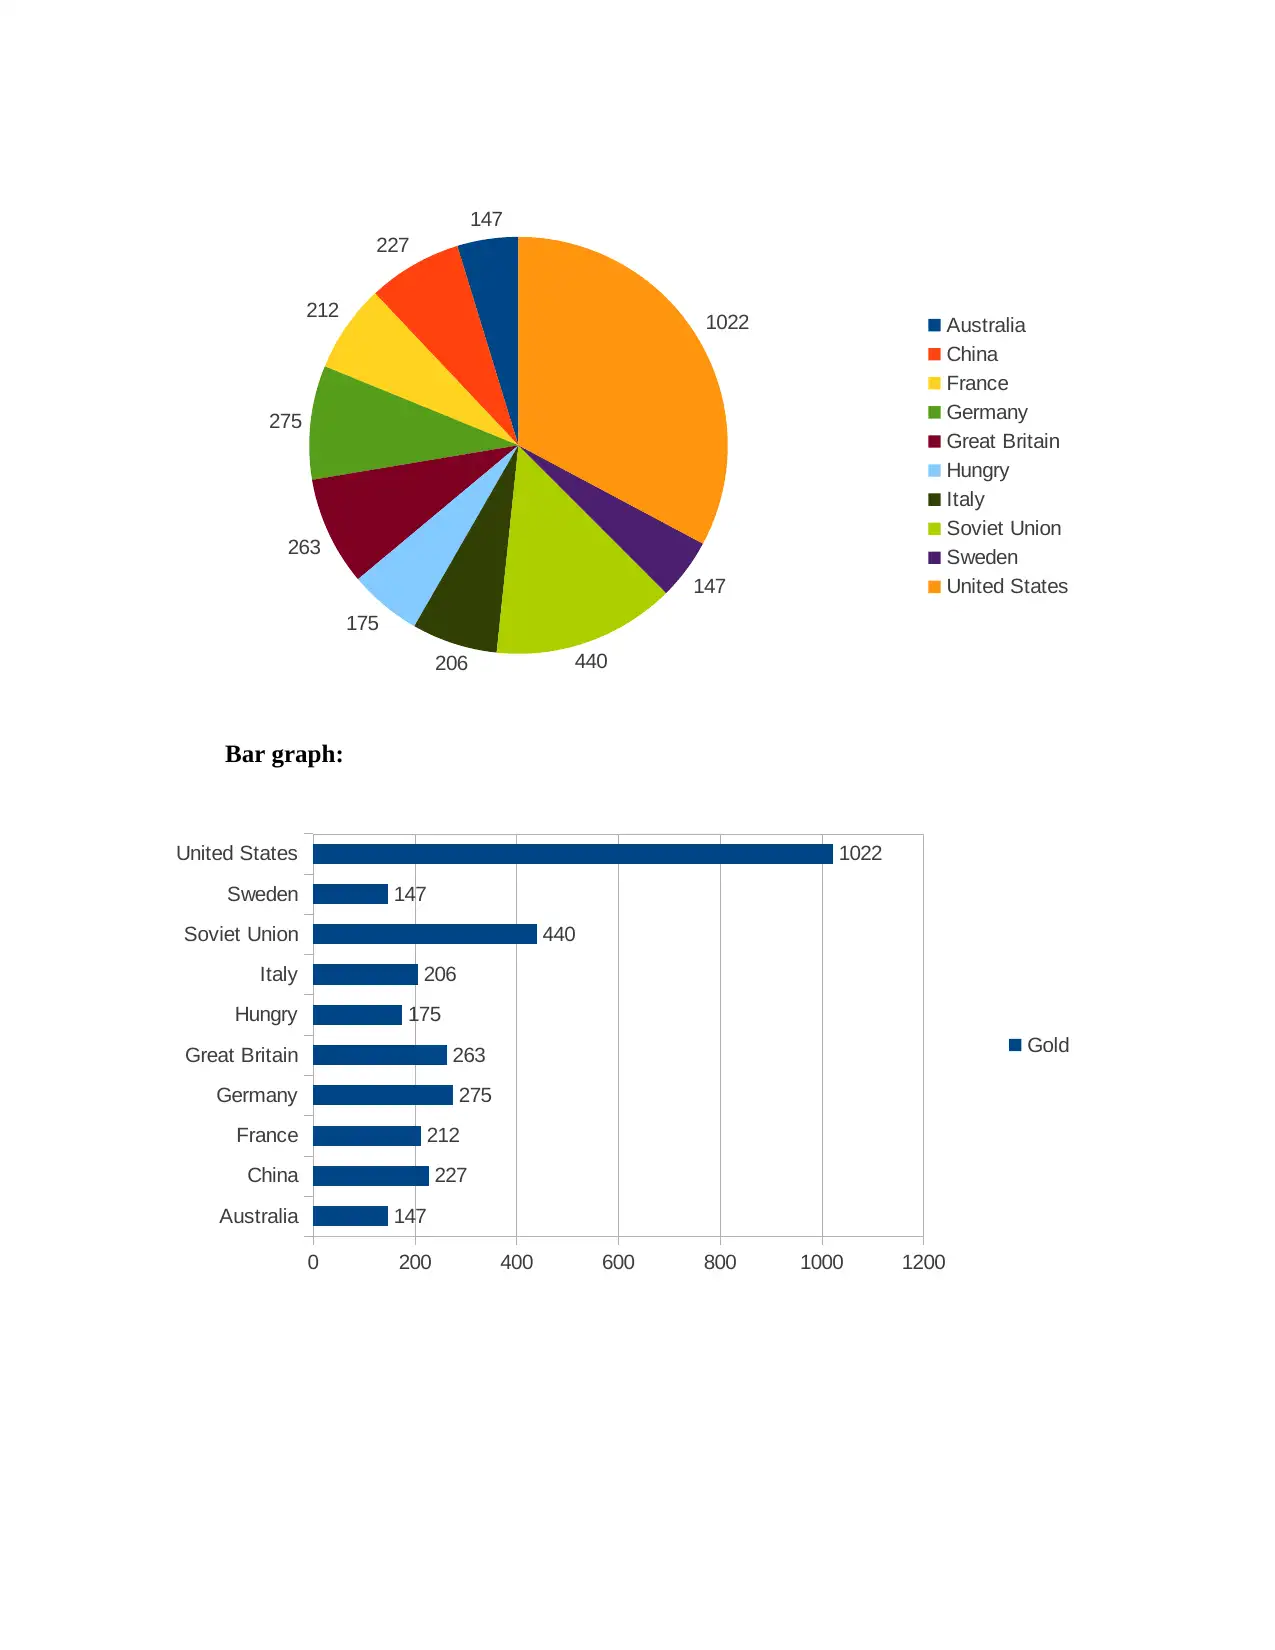
Bar graph:
Australia
China
France
Germany
Great Britain
Hungry
Italy
Soviet Union
Sweden
United States
0 200 400 600 800 1000 1200
147
227
212
275
263
175
206
440
147
1022
Gold
227
212
275
263
175
206 440
147
1022 Australia
China
France
Germany
Great Britain
Hungry
Italy
Soviet Union
Sweden
United States
Bar graph:
Australia
China
France
Germany
Great Britain
Hungry
Italy
Soviet Union
Sweden
United States
0 200 400 600 800 1000 1200
147
227
212
275
263
175
206
440
147
1022
Gold
⊘ This is a preview!⊘
Do you want full access?
Subscribe today to unlock all pages.
Trusted by 1+ million students worldwide
1 out of 20
Related Documents


Your All-in-One AI-Powered Toolkit for Academic Success.
+13062052269
info@desklib.com
Available 24*7 on WhatsApp / Email
![[object Object]](/_next/static/media/star-bottom.7253800d.svg)
Unlock your academic potential
Copyright © 2020–2026 A2Z Services. All Rights Reserved. Developed and managed by ZUCOL.