Analyzing Data Using Numeracy and IT Skills: An In-depth Report
VerifiedAdded on 2023/06/18
|22
|3680
|421
Practical Assignment
AI Summary
This assignment focuses on applying numeracy and IT skills to analyze and interpret data, including basic arithmetic operations and the use of Microsoft Excel. It covers topics such as fractions, percentages, significant figures, and data representation. The assignment includes practical questions involving calculations related to discounts, weights, and time management. Furthermore, it analyzes Olympic Games medal data, comparing countries' performances and using Excel to perform statistical calculations and create charts. The document demonstrates how to use Excel functions like RANK, SUM, and stacked bar diagrams to present and analyze data effectively. Desklib provides access to this and other solved assignments to aid students in their studies.

Using numeracy data
and IT FP
and IT FP
Paraphrase This Document
Need a fresh take? Get an instant paraphrase of this document with our AI Paraphraser
Contents
Contents...........................................................................................................................................2
INTRODUCTION...........................................................................................................................3
Part 1................................................................................................................................................3
Question 1....................................................................................................................................3
Question 2....................................................................................................................................4
Question 3....................................................................................................................................4
Question 4....................................................................................................................................4
Question 5....................................................................................................................................5
Question 6....................................................................................................................................5
Question 7....................................................................................................................................6
Question 8....................................................................................................................................6
Question 9....................................................................................................................................6
Question 10..................................................................................................................................7
Part 2................................................................................................................................................7
Part 3..............................................................................................................................................10
Question 13................................................................................................................................12
Question 14................................................................................................................................13
Question 15................................................................................................................................14
Question 16..................................................................................................................................1
Olympic Games Medal Table..........................................................................................................2
Olympic Games Medal Tables........................................................................................................3
Conclusion.......................................................................................................................................4
References........................................................................................................................................5
INTRODUCTION
Arithmetic competence is described as the ability to conceive about and apply accurate
theoretical concepts, while IT competence is described as having the ability to compute and
evaluate the available arithmetic and IT data (Bertheussen, 2016). Comprehending basic
arithmetic operations such as divides, multiplication, addition, and subtraction is an important
aspect of developing fundamental mathematical knowledge. Mathematics is required for
reasonable cognition and learning function in everyday routines. The concept of numeracy is
important for actions like consuming, following instructions, assessing invoicing, and playing. It
also makes concepts of math, patterns, scheduling, and forms available. It was established that
the concepts of literature and arithmetic may enable people to build the fundamental skills
individuals require to thrive in life. There is a comprehensive plan for increasing literacy and
mathematical abilities, and also supporting students in living a joyful and fulfilling life and
contributing as an active and well-informed community. This mathematics curriculum is broken
into three main exercises; each of them must be typically performed.
Part 1
Question 1
As already stated, mathematics competency is interpreted as the capability to analyse and
implement simple arithmetic concepts. Fundamental reasoning skills necessitate knowledge of
fundamental arithmetic computation such as dividing, multiplication, combining, and removing.
Further below, the numerator and denominator ideas will be discussed (Bulteau, Feuillet and
Dantan, 2019).
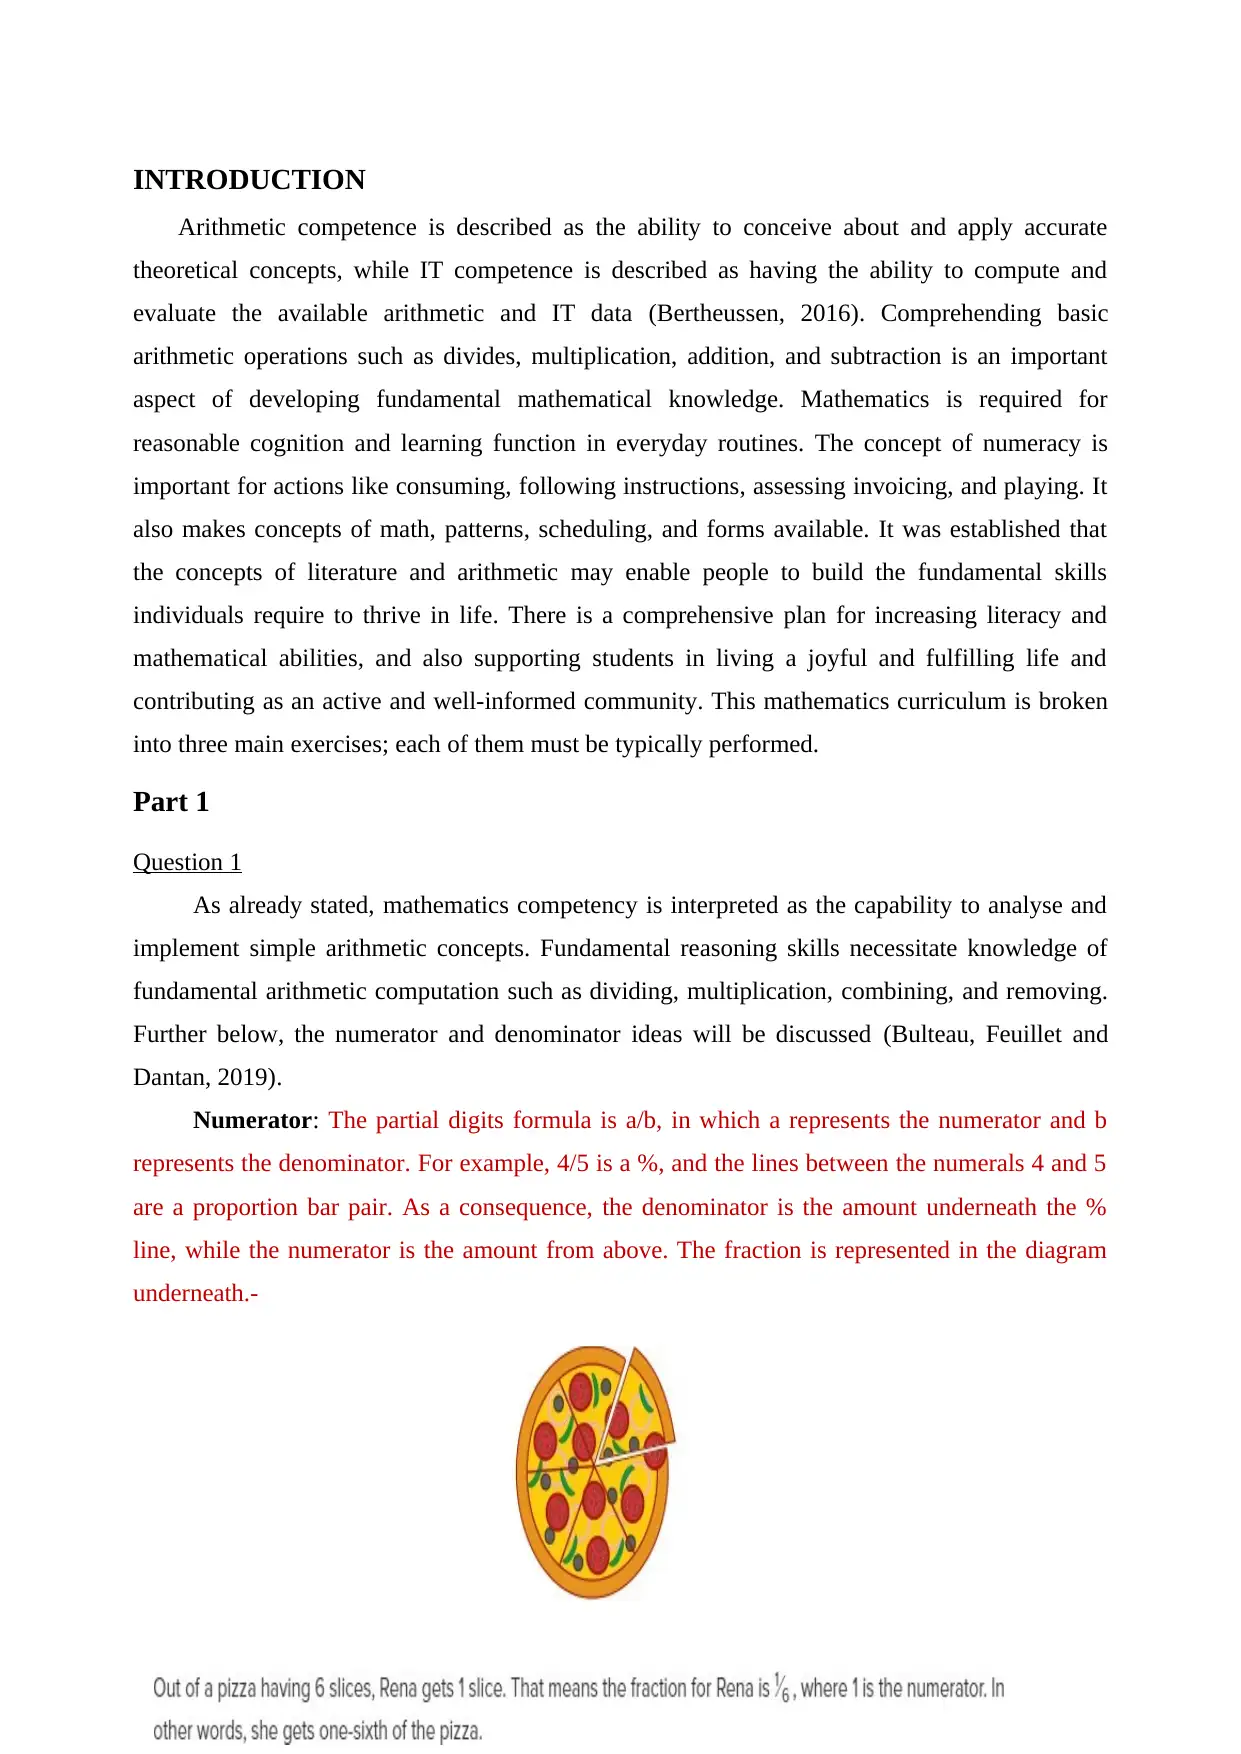
Numerator: The partial digits formula is a/b, in which a represents the numerator and b
represents the denominator. For example, 4/5 is a %, and the lines between the numerals 4 and 5
are a proportion bar pair. As a consequence, the denominator is the amount underneath the %
line, while the numerator is the amount from above. The fraction is represented in the diagram
underneath.-
Arithmetic competence is described as the ability to conceive about and apply accurate
theoretical concepts, while IT competence is described as having the ability to compute and
evaluate the available arithmetic and IT data (Bertheussen, 2016). Comprehending basic
arithmetic operations such as divides, multiplication, addition, and subtraction is an important
aspect of developing fundamental mathematical knowledge. Mathematics is required for
reasonable cognition and learning function in everyday routines. The concept of numeracy is
important for actions like consuming, following instructions, assessing invoicing, and playing. It
also makes concepts of math, patterns, scheduling, and forms available. It was established that
the concepts of literature and arithmetic may enable people to build the fundamental skills
individuals require to thrive in life. There is a comprehensive plan for increasing literacy and
mathematical abilities, and also supporting students in living a joyful and fulfilling life and
contributing as an active and well-informed community. This mathematics curriculum is broken
into three main exercises; each of them must be typically performed.
Part 1
Question 1
As already stated, mathematics competency is interpreted as the capability to analyse and
implement simple arithmetic concepts. Fundamental reasoning skills necessitate knowledge of
fundamental arithmetic computation such as dividing, multiplication, combining, and removing.
Further below, the numerator and denominator ideas will be discussed (Bulteau, Feuillet and
Dantan, 2019).
Numerator: The partial digits formula is a/b, in which a represents the numerator and b
represents the denominator. For example, 4/5 is a %, and the lines between the numerals 4 and 5
are a proportion bar pair. As a consequence, the denominator is the amount underneath the %
line, while the numerator is the amount from above. The fraction is represented in the diagram
underneath.-
⊘ This is a preview!⊘
Do you want full access?
Subscribe today to unlock all pages.
Trusted by 1+ million students worldwide
Denominator: The least number in a percentage that indicates the number of comparable
components split into an item is the denominator (Chomicki, Schaefer and Renner, 2020).
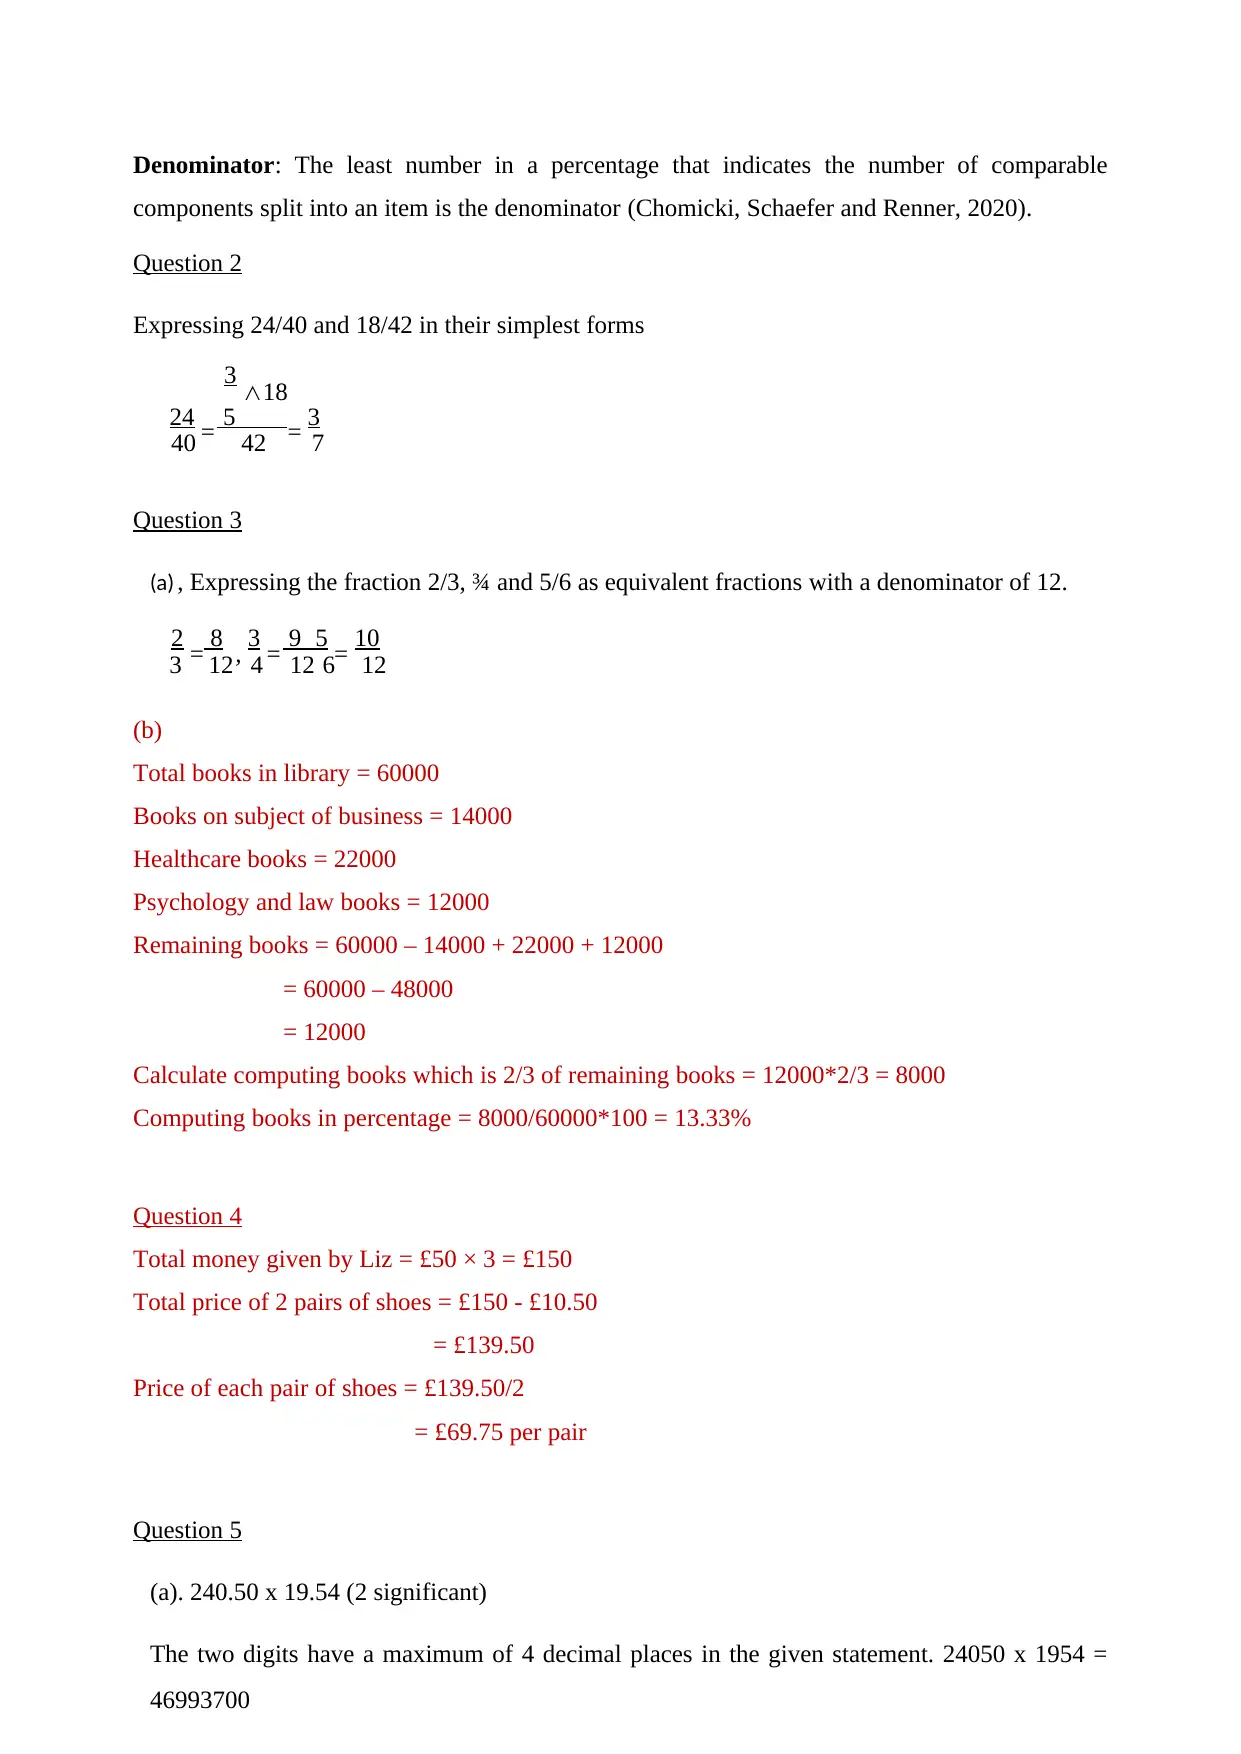
Question 2
Expressing 24/40 and 18/42 in their simplest forms
3 ∧18
24 = 5 = 3
40 42 7
Question 3
(a) , Expressing the fraction 2/3, ¾ and 5/6 as equivalent fractions with a denominator of 12.
2 = 8 , 3 = 9 5 = 10
3 12 4 12 6 12
(b)
Total books in library = 60000
Books on subject of business = 14000
Healthcare books = 22000
Psychology and law books = 12000
Remaining books = 60000 – 14000 + 22000 + 12000
= 60000 – 48000
= 12000
Calculate computing books which is 2/3 of remaining books = 12000*2/3 = 8000
Computing books in percentage = 8000/60000*100 = 13.33%
Question 4
Total money given by Liz = £50 × 3 = £150
Total price of 2 pairs of shoes = £150 - £10.50
= £139.50
Price of each pair of shoes = £139.50/2
= £69.75 per pair
Question 5
(a). 240.50 x 19.54 (2 significant)
The two digits have a maximum of 4 decimal places in the given statement. 24050 x 1954 =
46993700
components split into an item is the denominator (Chomicki, Schaefer and Renner, 2020).
Question 2
Expressing 24/40 and 18/42 in their simplest forms
3 ∧18
24 = 5 = 3
40 42 7
Question 3
(a) , Expressing the fraction 2/3, ¾ and 5/6 as equivalent fractions with a denominator of 12.
2 = 8 , 3 = 9 5 = 10
3 12 4 12 6 12
(b)
Total books in library = 60000
Books on subject of business = 14000
Healthcare books = 22000
Psychology and law books = 12000
Remaining books = 60000 – 14000 + 22000 + 12000
= 60000 – 48000
= 12000
Calculate computing books which is 2/3 of remaining books = 12000*2/3 = 8000
Computing books in percentage = 8000/60000*100 = 13.33%
Question 4
Total money given by Liz = £50 × 3 = £150
Total price of 2 pairs of shoes = £150 - £10.50
= £139.50
Price of each pair of shoes = £139.50/2
= £69.75 per pair
Question 5
(a). 240.50 x 19.54 (2 significant)
The two digits have a maximum of 4 decimal places in the given statement. 24050 x 1954 =
46993700
Paraphrase This Document
Need a fresh take? Get an instant paraphrase of this document with our AI Paraphraser
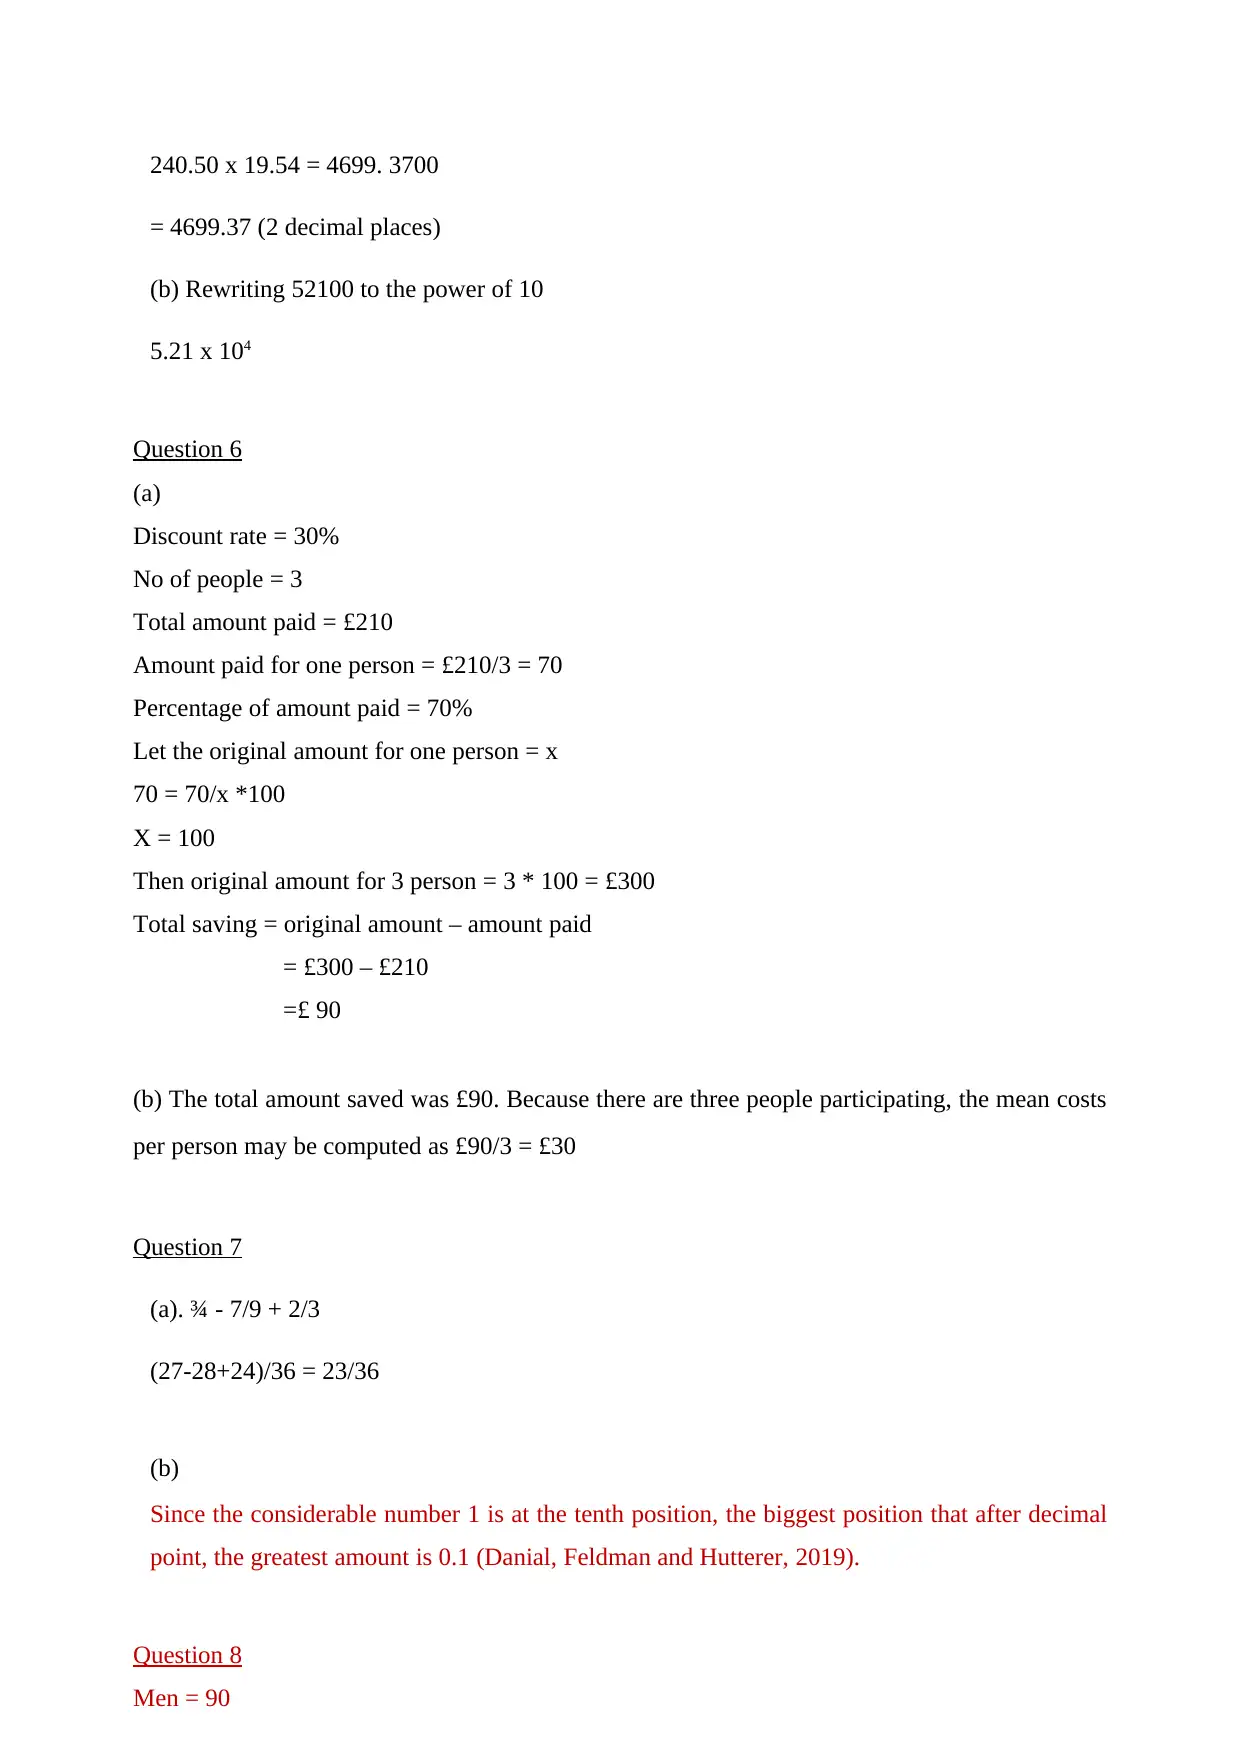
240.50 x 19.54 = 4699. 3700
= 4699.37 (2 decimal places)
(b) Rewriting 52100 to the power of 10
5.21 x 10⁴
Question 6
(a)
Discount rate = 30%
No of people = 3
Total amount paid = £210
Amount paid for one person = £210/3 = 70
Percentage of amount paid = 70%
Let the original amount for one person = x
70 = 70/x *100
X = 100
Then original amount for 3 person = 3 * 100 = £300
Total saving = original amount – amount paid
= £300 – £210
=£ 90
(b) The total amount saved was £90. Because there are three people participating, the mean costs
per person may be computed as £90/3 = £30
Question 7
(a). ¾ - 7/9 + 2/3
(27-28+24)/36 = 23/36
(b)
Since the considerable number 1 is at the tenth position, the biggest position that after decimal
point, the greatest amount is 0.1 (Danial, Feldman and Hutterer, 2019).
Question 8
Men = 90
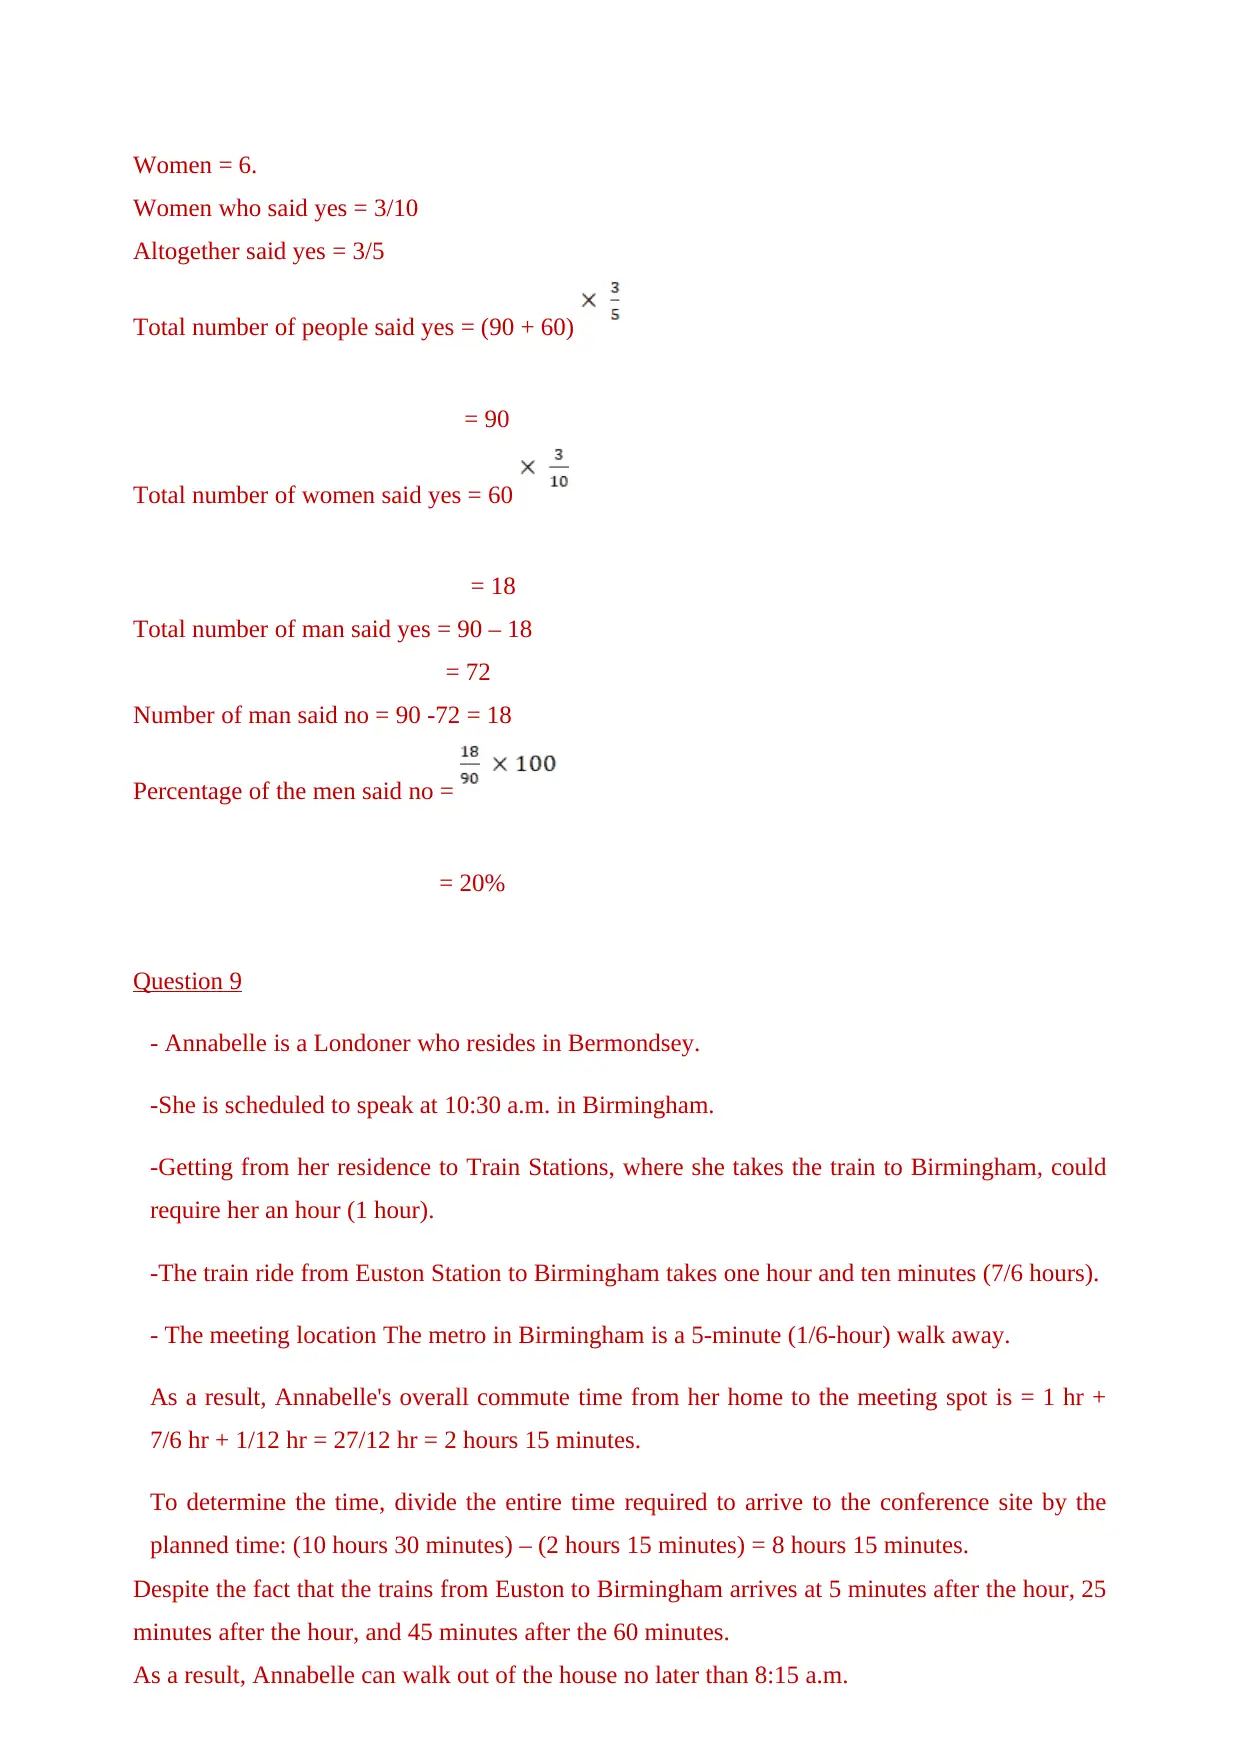
Women = 6.
Women who said yes = 3/10
Altogether said yes = 3/5
Total number of people said yes = (90 + 60)
= 90
Total number of women said yes = 60
= 18
Total number of man said yes = 90 – 18
= 72
Number of man said no = 90 -72 = 18
Percentage of the men said no =
= 20%
Question 9
- Annabelle is a Londoner who resides in Bermondsey.
-She is scheduled to speak at 10:30 a.m. in Birmingham.
-Getting from her residence to Train Stations, where she takes the train to Birmingham, could
require her an hour (1 hour).
-The train ride from Euston Station to Birmingham takes one hour and ten minutes (7/6 hours).
- The meeting location The metro in Birmingham is a 5-minute (1/6-hour) walk away.
As a result, Annabelle's overall commute time from her home to the meeting spot is = 1 hr +
7/6 hr + 1/12 hr = 27/12 hr = 2 hours 15 minutes.
To determine the time, divide the entire time required to arrive to the conference site by the
planned time: (10 hours 30 minutes) – (2 hours 15 minutes) = 8 hours 15 minutes.
Despite the fact that the trains from Euston to Birmingham arrives at 5 minutes after the hour, 25
minutes after the hour, and 45 minutes after the 60 minutes.
As a result, Annabelle can walk out of the house no later than 8:15 a.m.
⊘ This is a preview!⊘
Do you want full access?
Subscribe today to unlock all pages.
Trusted by 1+ million students worldwide
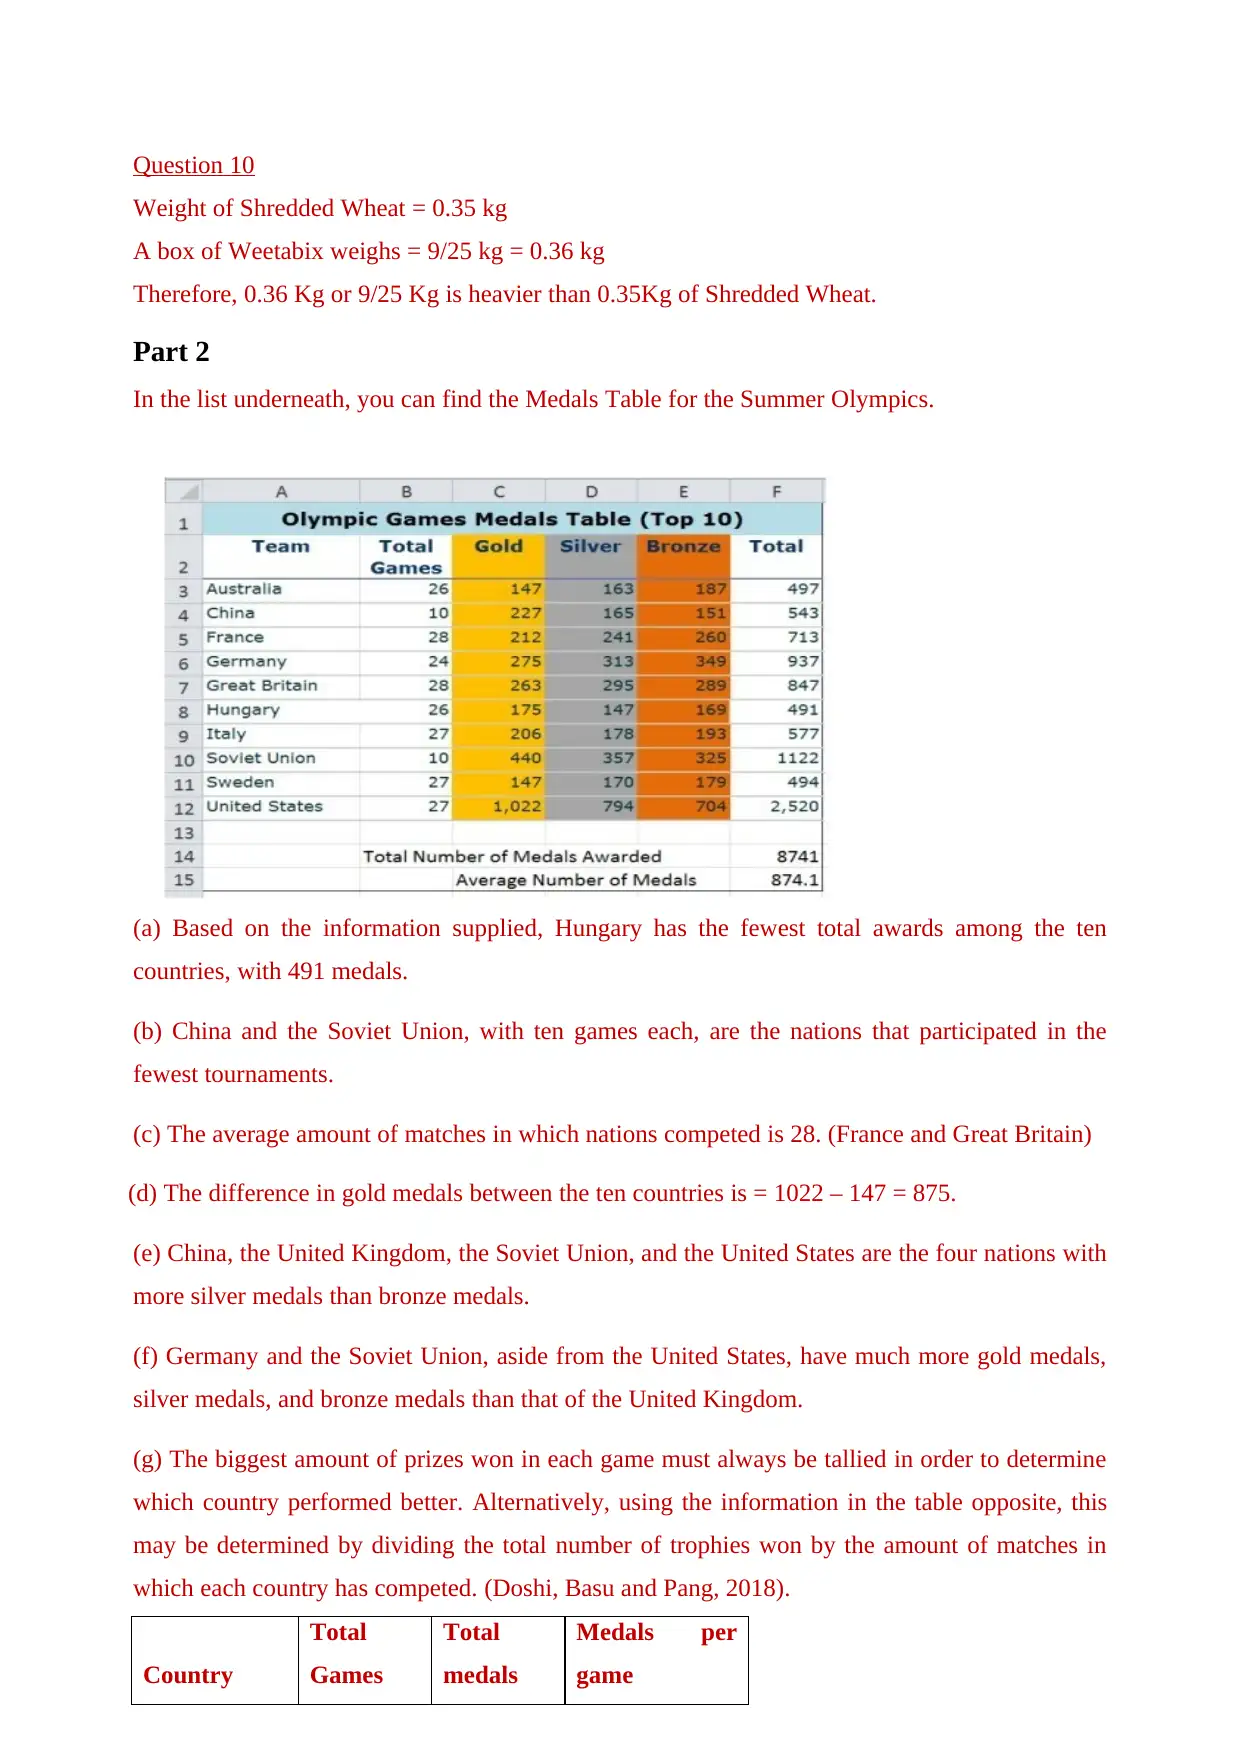
Question 10
Weight of Shredded Wheat = 0.35 kg
A box of Weetabix weighs = 9/25 kg = 0.36 kg
Therefore, 0.36 Kg or 9/25 Kg is heavier than 0.35Kg of Shredded Wheat.
Part 2
In the list underneath, you can find the Medals Table for the Summer Olympics.
(a) Based on the information supplied, Hungary has the fewest total awards among the ten
countries, with 491 medals.
(b) China and the Soviet Union, with ten games each, are the nations that participated in the
fewest tournaments.
(c) The average amount of matches in which nations competed is 28. (France and Great Britain)
(d) The difference in gold medals between the ten countries is = 1022 – 147 = 875.
(e) China, the United Kingdom, the Soviet Union, and the United States are the four nations with
more silver medals than bronze medals.
(f) Germany and the Soviet Union, aside from the United States, have much more gold medals,
silver medals, and bronze medals than that of the United Kingdom.
(g) The biggest amount of prizes won in each game must always be tallied in order to determine
which country performed better. Alternatively, using the information in the table opposite, this
may be determined by dividing the total number of trophies won by the amount of matches in
which each country has competed. (Doshi, Basu and Pang, 2018).
Country
Total
Games
Total
medals
Medals per
game
Paraphrase This Document
Need a fresh take? Get an instant paraphrase of this document with our AI Paraphraser
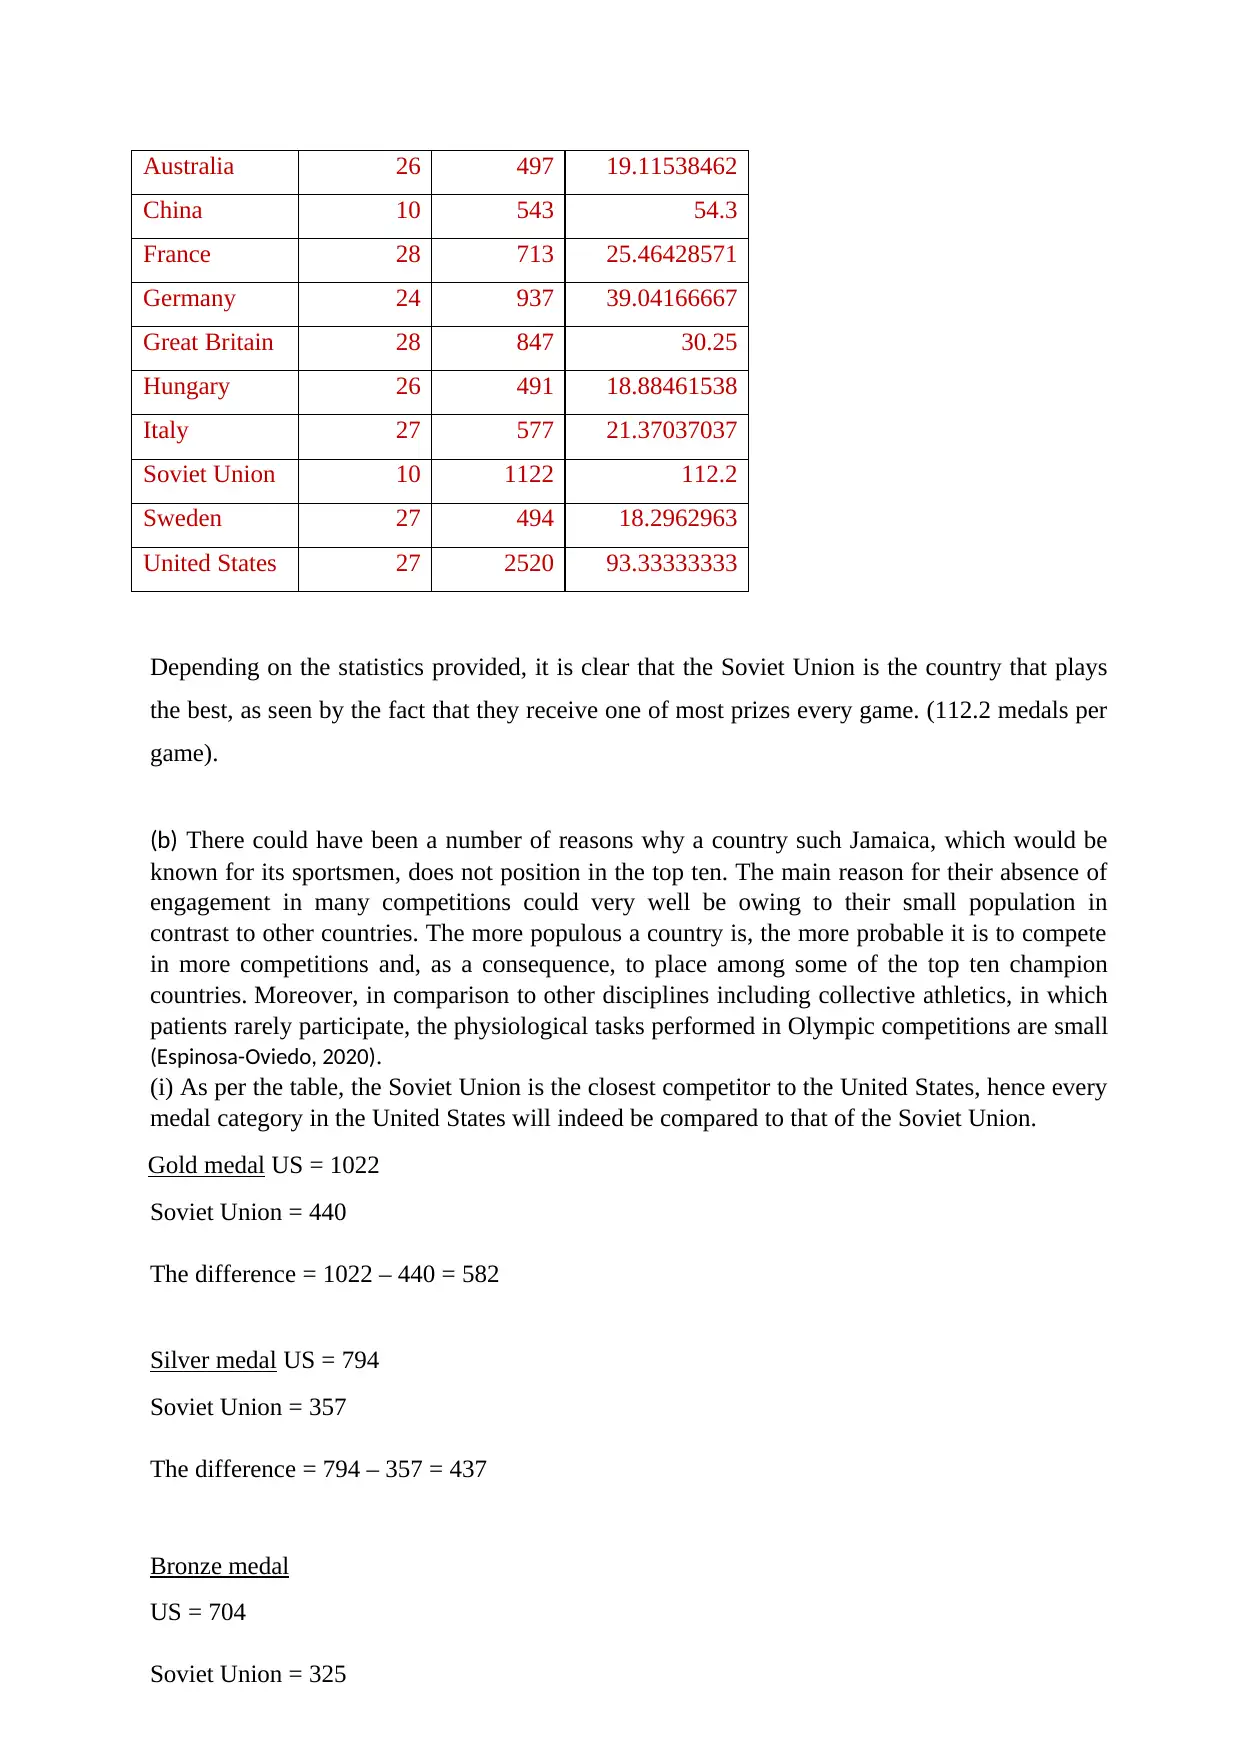
Australia 26 497 19.11538462
China 10 543 54.3
France 28 713 25.46428571
Germany 24 937 39.04166667
Great Britain 28 847 30.25
Hungary 26 491 18.88461538
Italy 27 577 21.37037037
Soviet Union 10 1122 112.2
Sweden 27 494 18.2962963
United States 27 2520 93.33333333
Depending on the statistics provided, it is clear that the Soviet Union is the country that plays
the best, as seen by the fact that they receive one of most prizes every game. (112.2 medals per
game).
(b) There could have been a number of reasons why a country such Jamaica, which would be
known for its sportsmen, does not position in the top ten. The main reason for their absence of
engagement in many competitions could very well be owing to their small population in
contrast to other countries. The more populous a country is, the more probable it is to compete
in more competitions and, as a consequence, to place among some of the top ten champion
countries. Moreover, in comparison to other disciplines including collective athletics, in which
patients rarely participate, the physiological tasks performed in Olympic competitions are small
(Espinosa-Oviedo, 2020).
(i) As per the table, the Soviet Union is the closest competitor to the United States, hence every
medal category in the United States will indeed be compared to that of the Soviet Union.
Gold medal US = 1022
Soviet Union = 440
The difference = 1022 – 440 = 582
Silver medal US = 794
Soviet Union = 357
The difference = 794 – 357 = 437
Bronze medal
US = 704
Soviet Union = 325
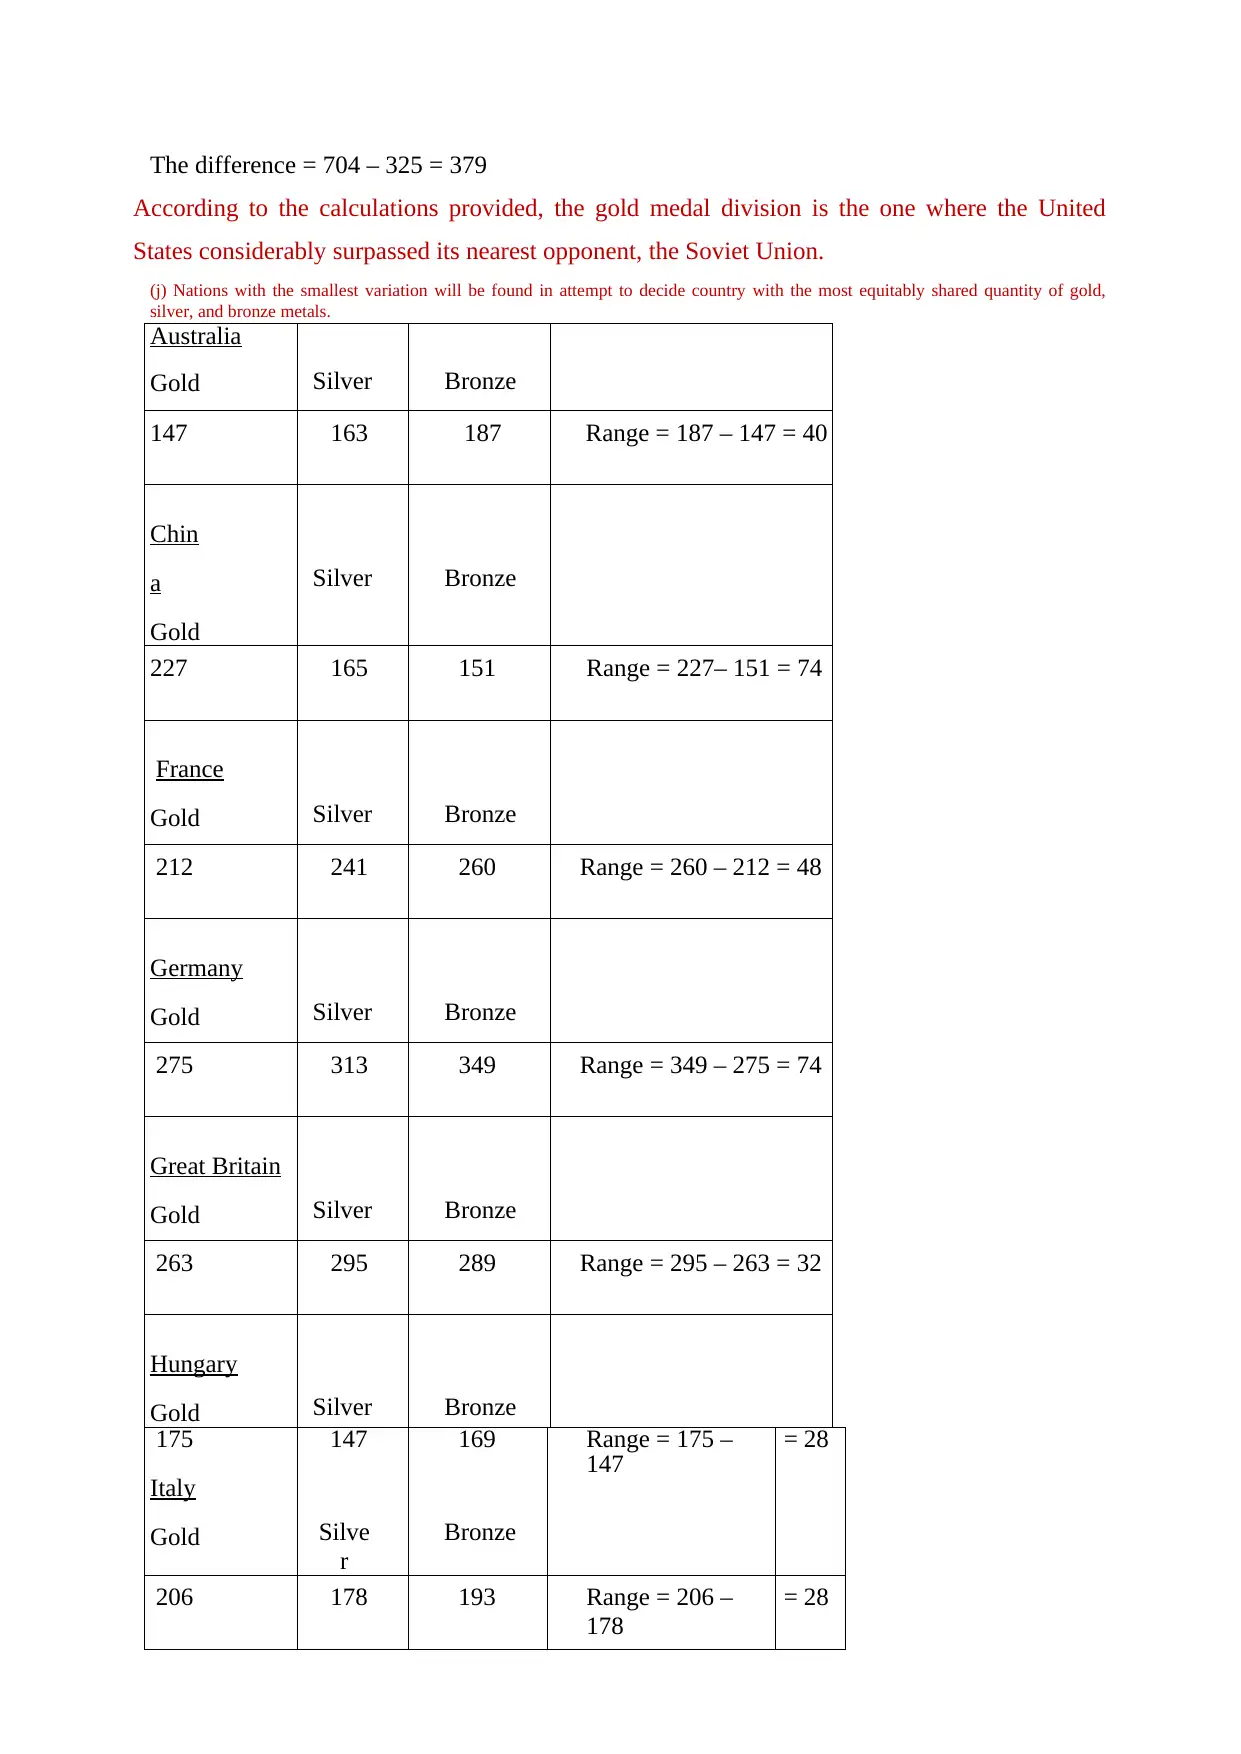
The difference = 704 – 325 = 379
According to the calculations provided, the gold medal division is the one where the United
States considerably surpassed its nearest opponent, the Soviet Union.
(j) Nations with the smallest variation will be found in attempt to decide country with the most equitably shared quantity of gold,
silver, and bronze metals.
Australia
Gold Silver Bronze
147 163 187 Range = 187 – 147 = 40
Chin
a
Gold
Silver Bronze
227 165 151 Range = 227– 151 = 74
France
Gold Silver Bronze
212 241 260 Range = 260 – 212 = 48
Germany
Gold Silver Bronze
275 313 349 Range = 349 – 275 = 74
Great Britain
Gold Silver Bronze
263 295 289 Range = 295 – 263 = 32
Hungary
Gold Silver Bronze
175
Italy
Gold
147
Silve
r
169
Bronze
Range = 175 –
147 = 28
206 178 193 Range = 206 –
178
= 28
⊘ This is a preview!⊘
Do you want full access?
Subscribe today to unlock all pages.
Trusted by 1+ million students worldwide
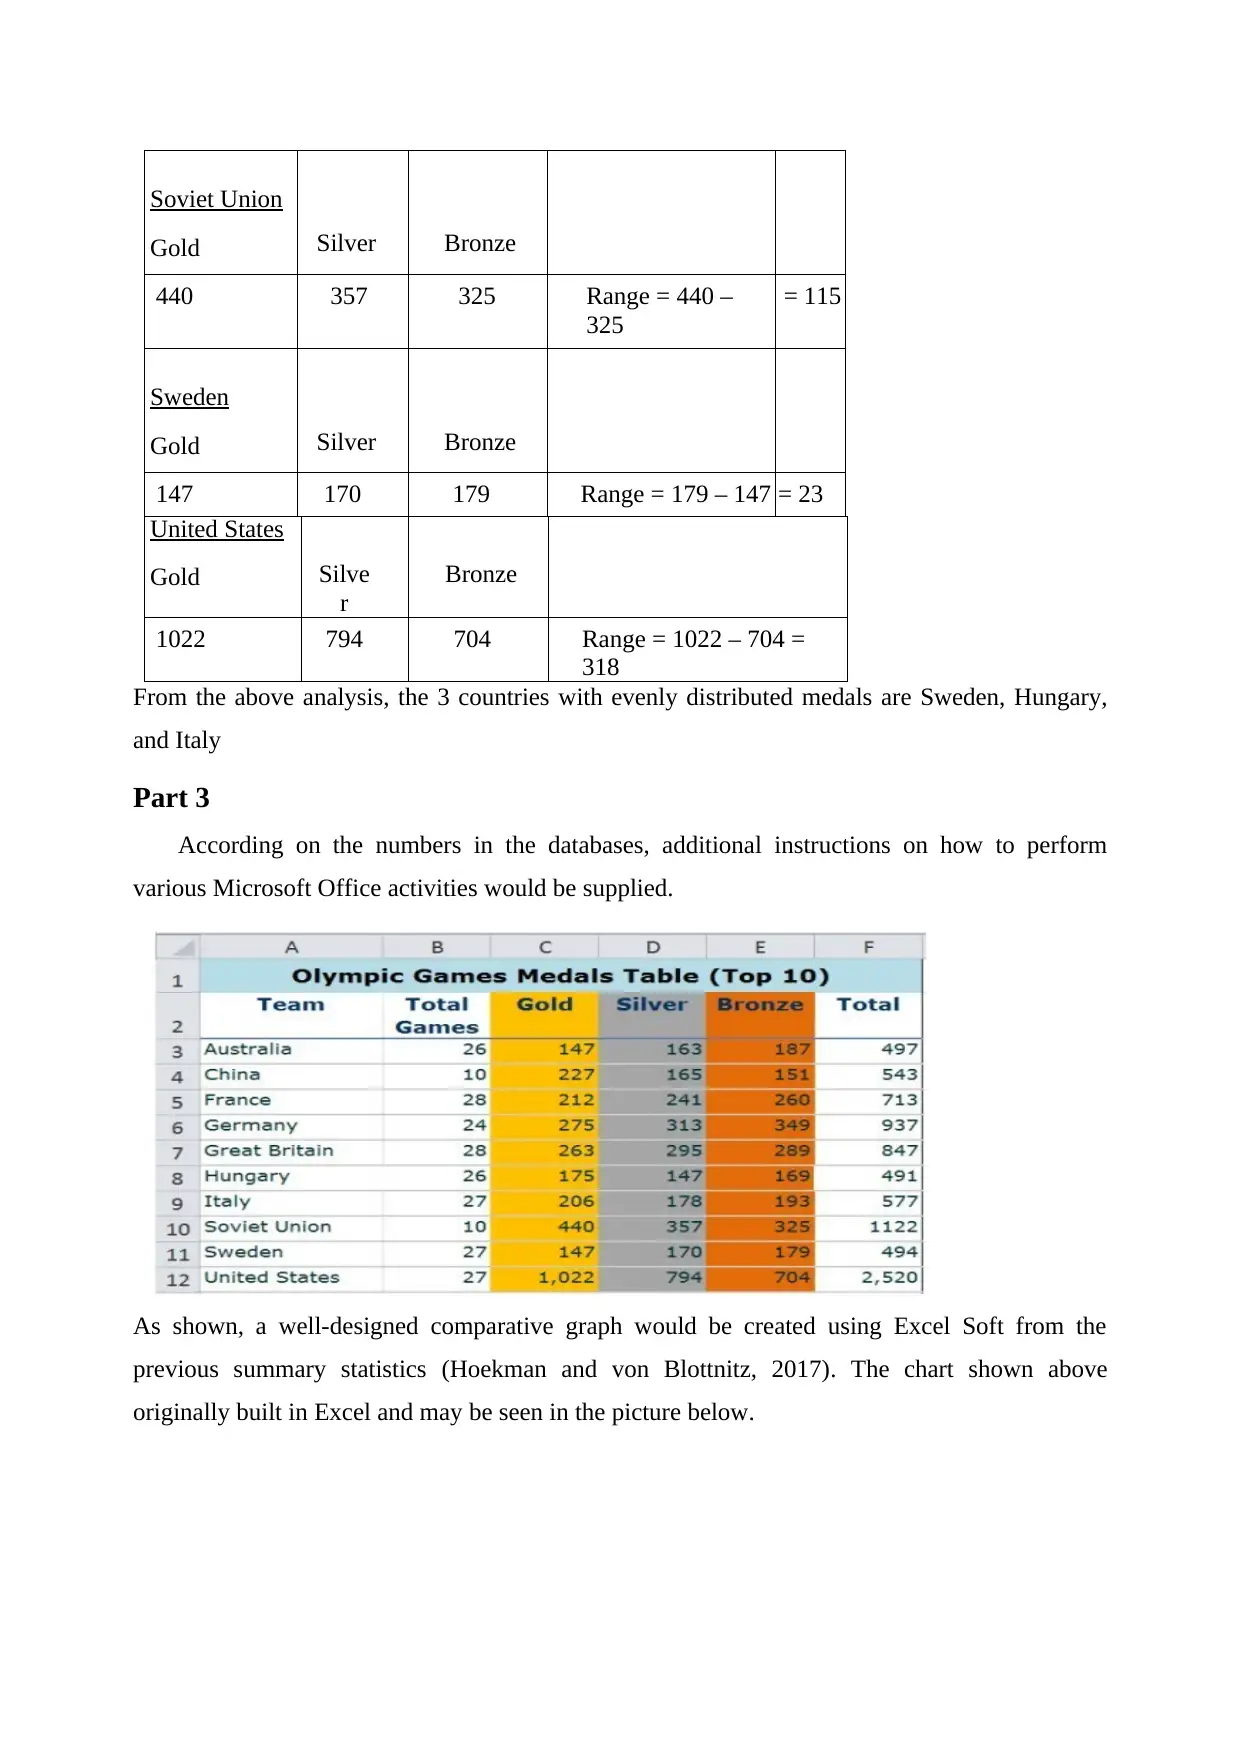
Soviet Union
Gold Silver Bronze
440 357 325 Range = 440 –
325
= 115
Sweden
Gold Silver Bronze
147 170 179 Range = 179 – 147 = 23
United States
Gold Silve
r
Bronze
1022 794 704 Range = 1022 – 704 =
318
From the above analysis, the 3 countries with evenly distributed medals are Sweden, Hungary,
and Italy
Part 3
According on the numbers in the databases, additional instructions on how to perform
various Microsoft Office activities would be supplied.
As shown, a well-designed comparative graph would be created using Excel Soft from the
previous summary statistics (Hoekman and von Blottnitz, 2017). The chart shown above
originally built in Excel and may be seen in the picture below.
Gold Silver Bronze
440 357 325 Range = 440 –
325
= 115
Sweden
Gold Silver Bronze
147 170 179 Range = 179 – 147 = 23
United States
Gold Silve
r
Bronze
1022 794 704 Range = 1022 – 704 =
318
From the above analysis, the 3 countries with evenly distributed medals are Sweden, Hungary,
and Italy
Part 3
According on the numbers in the databases, additional instructions on how to perform
various Microsoft Office activities would be supplied.
As shown, a well-designed comparative graph would be created using Excel Soft from the
previous summary statistics (Hoekman and von Blottnitz, 2017). The chart shown above
originally built in Excel and may be seen in the picture below.
Paraphrase This Document
Need a fresh take? Get an instant paraphrase of this document with our AI Paraphraser
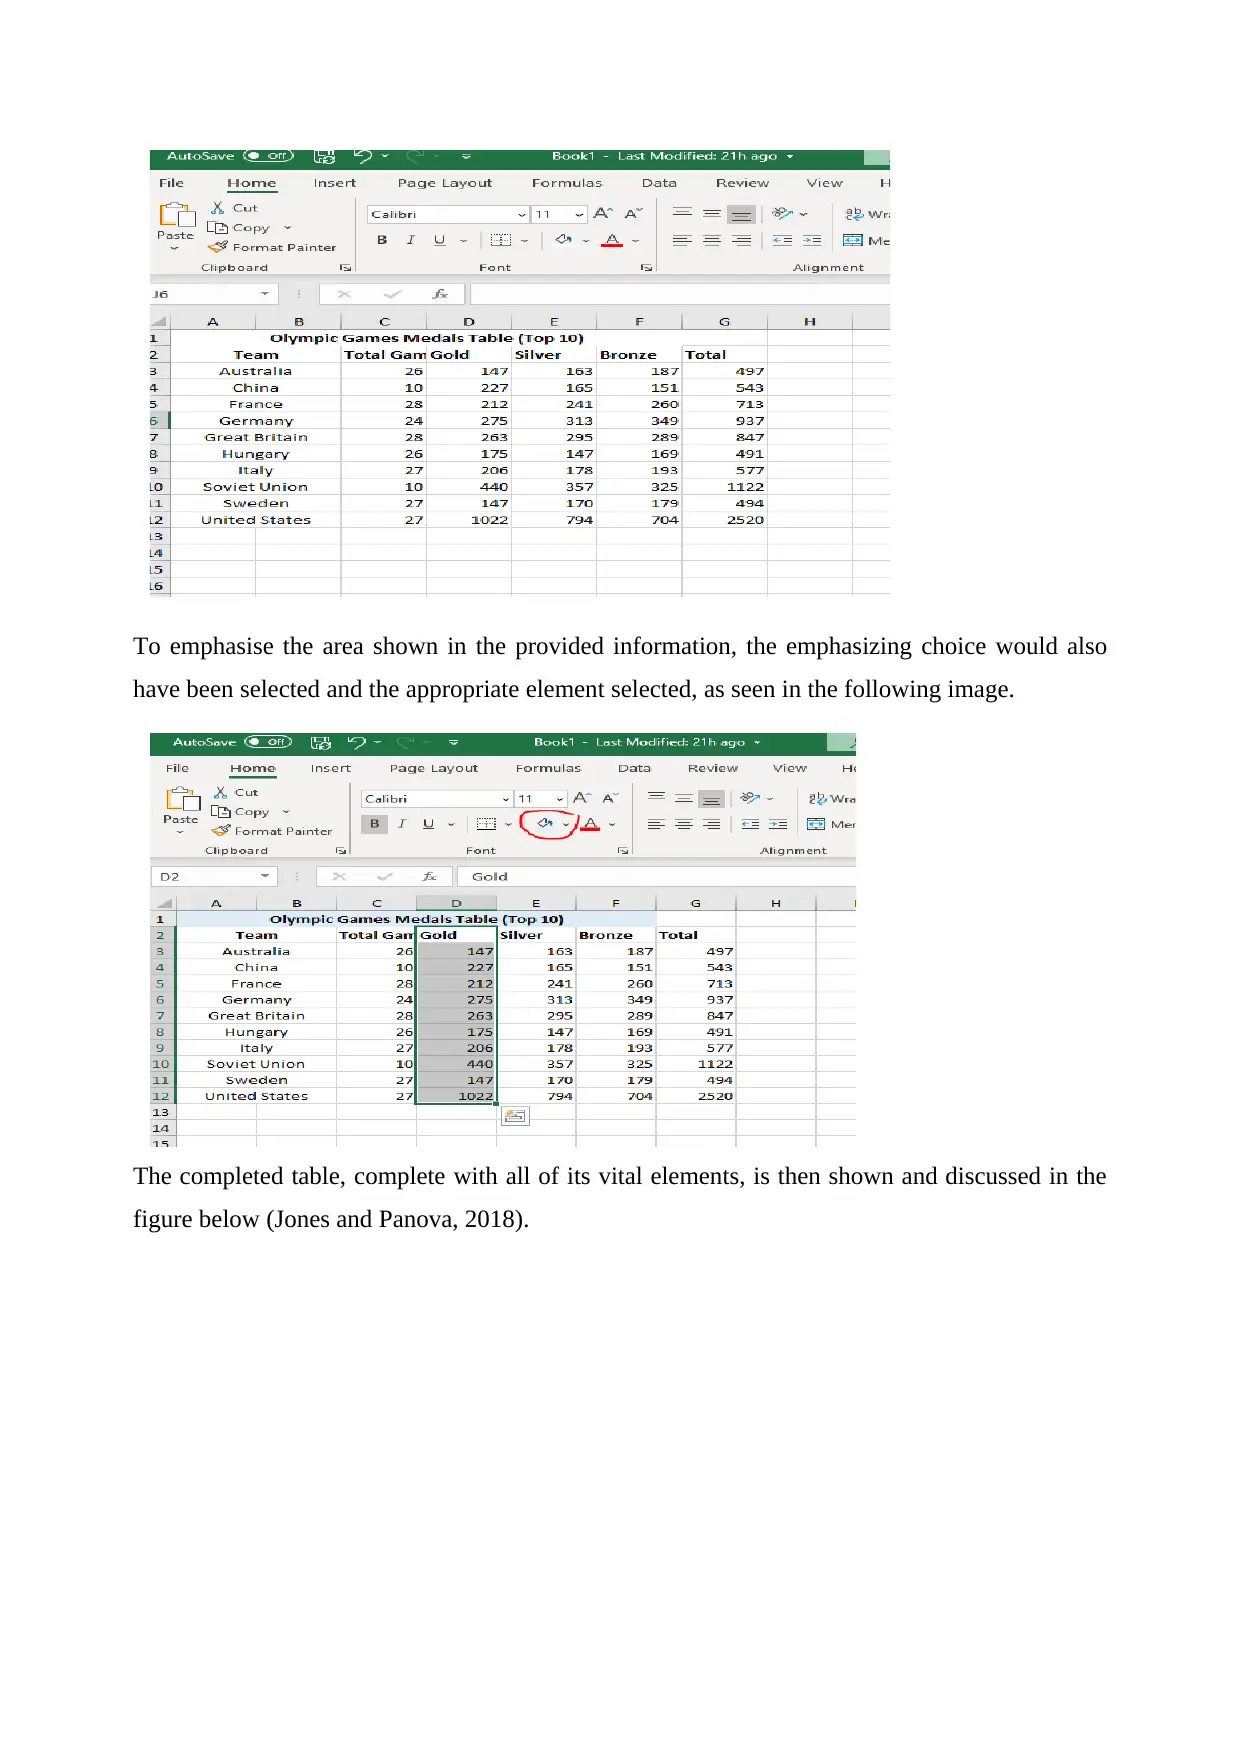
To emphasise the area shown in the provided information, the emphasizing choice would also
have been selected and the appropriate element selected, as seen in the following image.
The completed table, complete with all of its vital elements, is then shown and discussed in the
figure below (Jones and Panova, 2018).
have been selected and the appropriate element selected, as seen in the following image.
The completed table, complete with all of its vital elements, is then shown and discussed in the
figure below (Jones and Panova, 2018).
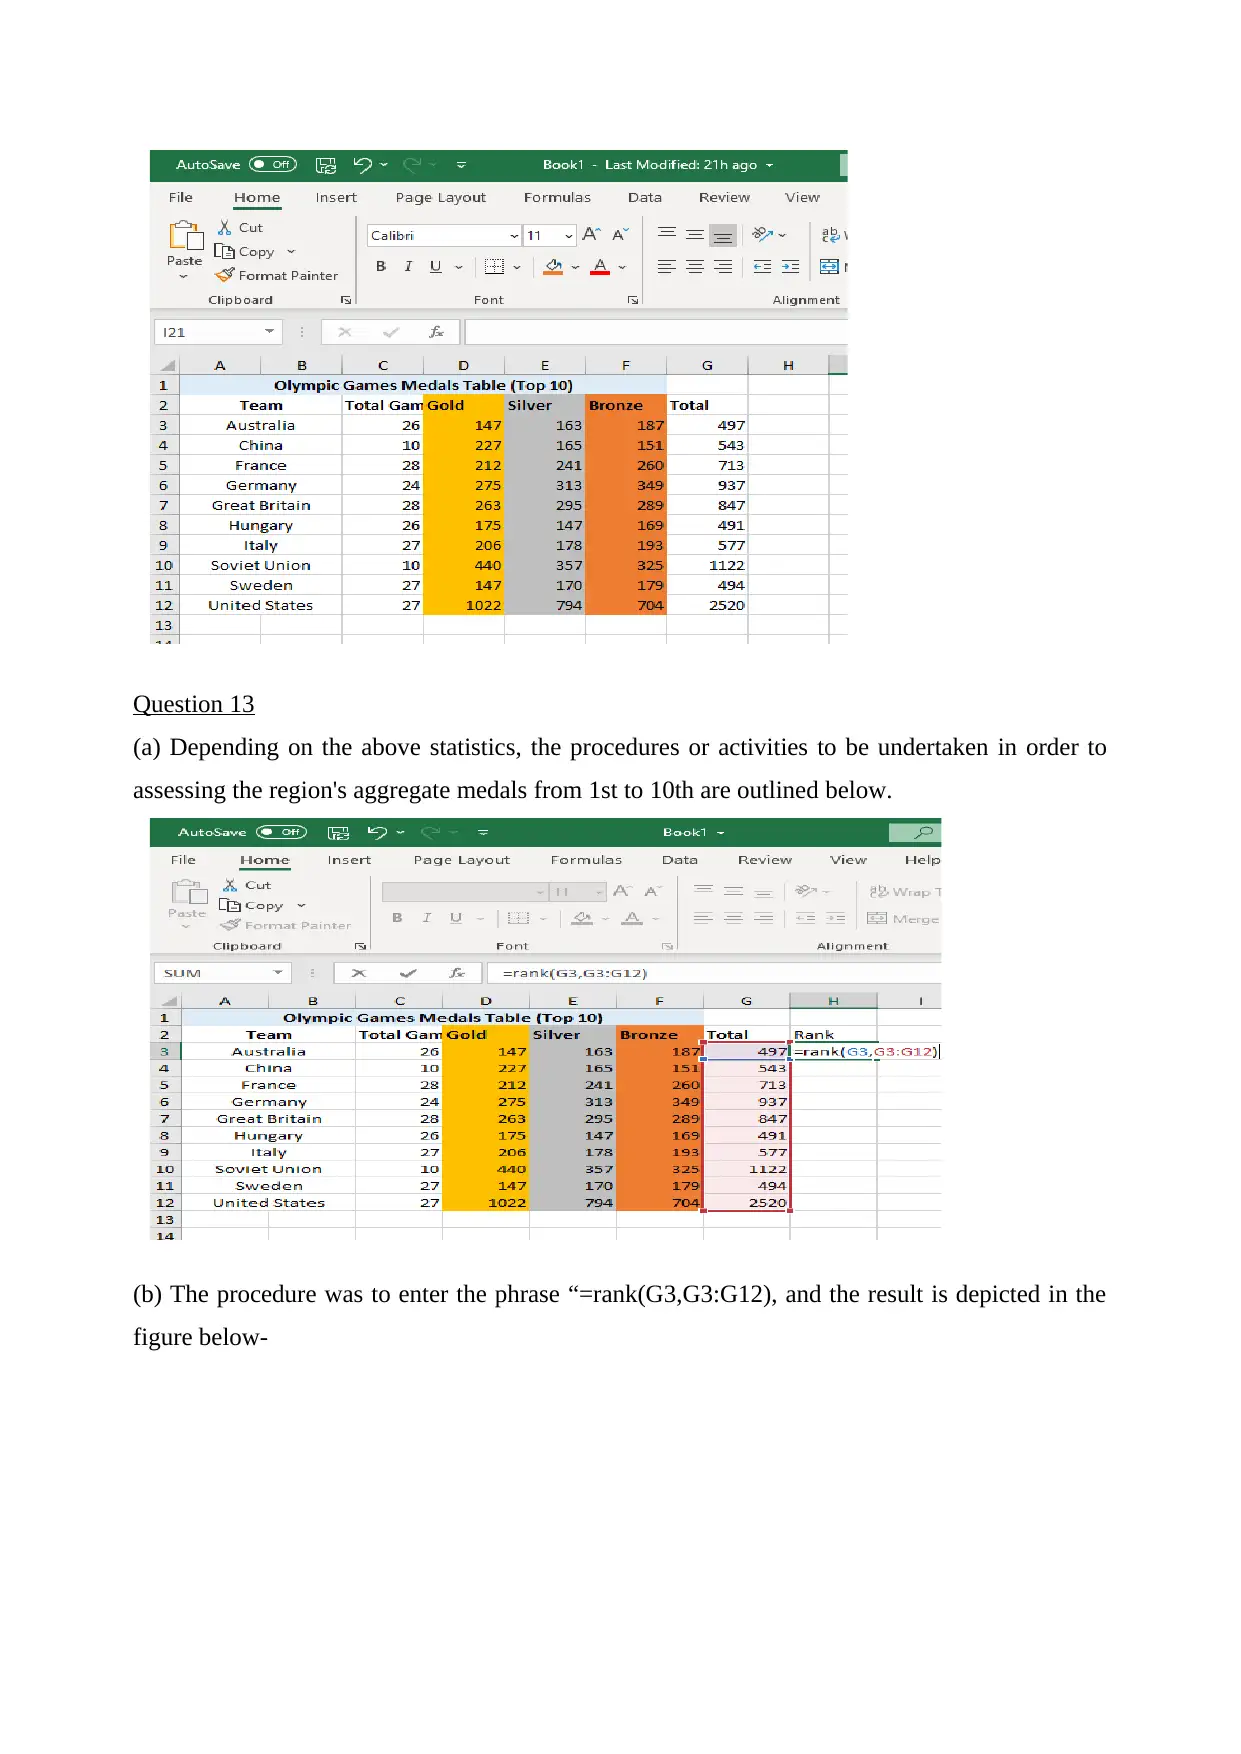
Question 13
(a) Depending on the above statistics, the procedures or activities to be undertaken in order to
assessing the region's aggregate medals from 1st to 10th are outlined below.
(b) The procedure was to enter the phrase “=rank(G3,G3:G12), and the result is depicted in the
figure below-
(a) Depending on the above statistics, the procedures or activities to be undertaken in order to
assessing the region's aggregate medals from 1st to 10th are outlined below.
(b) The procedure was to enter the phrase “=rank(G3,G3:G12), and the result is depicted in the
figure below-
⊘ This is a preview!⊘
Do you want full access?
Subscribe today to unlock all pages.
Trusted by 1+ million students worldwide
1 out of 22
Related Documents


Your All-in-One AI-Powered Toolkit for Academic Success.
+13062052269
info@desklib.com
Available 24*7 on WhatsApp / Email
![[object Object]](/_next/static/media/star-bottom.7253800d.svg)
Unlock your academic potential
Copyright © 2020–2026 A2Z Services. All Rights Reserved. Developed and managed by ZUCOL.