Numeracy, Data & IT Assignment: Olympic Medals Data Analysis and Excel
VerifiedAdded on 2023/01/06
|20
|4529
|52
Homework Assignment
AI Summary
This assignment delves into numeracy, data analysis, and IT skills, primarily utilizing Excel for data manipulation and interpretation. It begins with fundamental concepts like numerators, denominators, and expressing fractions in their simplest forms. The assignment then progresses to calculations involving fractions, percentages, and averages, including real-world scenarios such as calculating the price of running shoes and savings. It also covers the use of exponents and basic arithmetic operations. A significant portion focuses on analyzing Olympic medal data, involving calculations of averages, percentages, and identifying trends. The assignment includes creating Excel spreadsheets, applying various formulas (including calculating mean, median, and standard deviation), and constructing appropriate charts to visualize the data. Specific Excel tasks include ranking data, filtering for specific criteria, and creating different chart types to compare and represent the data effectively. Finally, the assignment explores the use of formulas to calculate totals and averages, and to search databases within Excel. The assignment is designed to build proficiency in data handling, formula application, and data visualization using Excel, and to apply these skills to real-world data analysis.
USING NUMERACY,
DATA & IT
DATA & IT
Paraphrase This Document
Need a fresh take? Get an instant paraphrase of this document with our AI Paraphraser
Table of Contents
INTRODUCTION...........................................................................................................................1
QUESTION 1...................................................................................................................................1
a. Explanation of numerator.........................................................................................................1
b. Explanation of denominator.....................................................................................................1
QUESTION 2...................................................................................................................................1
Expressing 24 / 40 and 18 / 42 in simplest forms........................................................................1
QUESTION 3...................................................................................................................................1
a. Expressing the fractions 2 / 3, 3 / 4 and 5 / 6 equivalent with a denominator of 12................1
b. Making up the two thirds of the remainder..............................................................................2
QUESTION 4...................................................................................................................................2
Price of each pair of the running shoes........................................................................................2
QUESTION 5...................................................................................................................................2
a. What is 240.50 * 19.54............................................................................................................2
b. Writing the number 52100 as the power of 10........................................................................2
QUESTION 6...................................................................................................................................3
a. Total saving made by Patty and her siblings............................................................................3
b. Average saving per person.......................................................................................................3
QUESTION 7...................................................................................................................................3
a. 3 / 4 – 7 / 9 + 2 / 3....................................................................................................................3
b. Largest number from all the values.........................................................................................3
QUESTION 8...................................................................................................................................3
The percentage of men that said no.............................................................................................3
QUESTION 9...................................................................................................................................4
The latest time that Annabelle can leave home...........................................................................4
QUESTION 10.................................................................................................................................4
Analysis of the box which is heavier...........................................................................................4
QUESTION 11.................................................................................................................................4
a. The country with lowest number of overall medals.................................................................4
b. The country or countries which competed the least number of games....................................4
c. The mode in the number of games countries participated in...................................................5
d. Range between the gold medals awarded to the 10 countries.................................................5
e. Number of countries that got more silver medals than bronze medals....................................5
f. The countries which got more gold, silver and bronze medals than Great Britain..................5
g. The country which performed best..........................................................................................5
h. Reasons due to which country like Jamaica does not feature in the top 10 medals................5
i. Determination of the medal category in which the US far outperformed its closest
competitor....................................................................................................................................5
j. The three countries that has most evenly distributed number of gold, silver and bronze medal
......................................................................................................................................................6
QUESTION 12.................................................................................................................................6
Creating the excel including rows and columns, identifiers, test formatting and column
highlighting..................................................................................................................................6
QUESTION 13.................................................................................................................................6
a. Actions or steps in excel which could be taken to rank the figures from 1 to 10th.................6
b. Specific actions or steps in excel which will produce a list of the countries with 800 or more
medals in total..............................................................................................................................7
c. The graphs which will be suitable for representing only gold medals information.................7
d. The column in which might replication have been used..........................................................9
e. The excel formula which could be used to calculate the overall total medals.........................9
QUESTION 14.................................................................................................................................9
a. Excel formula to calculate total medals for Germany and Great Britain.................................9
b. Formula to calculate average number of silver medals for European country........................9
c. Excel formula to sum the medals total for gold for those counties with less than 20 games
involvement..................................................................................................................................9
d. Excel formula to search the data base to find Italy and also the corresponding medals total. 9
QUESTION 15...............................................................................................................................10
a. Calculation of medium number of medals for each medal type, stating the formula which is
used to determine the median for the medals.............................................................................10
b. Calculation of mean for the medals along with the formula which is used for the same
calculation..................................................................................................................................10
⊘ This is a preview!⊘
Do you want full access?
Subscribe today to unlock all pages.
Trusted by 1+ million students worldwide
c. calculation of standard deviation of total medals awarded to each country..........................11
d. Usefulness of a standard deviation in the data set.................................................................13
QUESTION 16...............................................................................................................................13
a. Chart to compare fully labelled chart to compare gold, silver and bronze medal.................13
b. Chart to reflect the contribution of each country to the overall medals total........................14
CONCLUSION..............................................................................................................................14
REFERENCES..............................................................................................................................15
Paraphrase This Document
Need a fresh take? Get an instant paraphrase of this document with our AI Paraphraser
INTRODUCTION
Numeracy data could be defined as the information which is available in numerical
format. It is very important for the individuals who are working on the data analysis to use excel
in systematic manner. Apart from this, it is also very important for them to make sure that they
are having good and effective IT skills. Lack of it may result in inappropriate attainment of all
the requirements of the project on which individuals are working. If they will not be able to use
excel in systematic manner of they will having low knowledge of it then it will affect their ability
to complete the projects (Ayob, 2017). Present report is based upon use of excel and different
types of excel formulas so that all the requirements of project could be met. This assignment is
focused with different topics such as use of basic numerical operations with whole number ,
integers, fractions and decimals, calculation of proportions, percentages and averages along with
ratios. Additionally, construction of appropriate graphical techniques to present simple data
along with spreadsheet is also covered in this report.
QUESTION 1
a. Explanation of numerator
Numerator could be defined as the top number in the fraction. It is the part of fraction
which is depicted above the line and divided by denominator. For example if a fraction is 1 / 2
then 1 will be the numerator in it.
b. Explanation of denominator
The number which is depicted below the line in the fraction is called denominator. It
functions as the divisor for numerator. For example, if a fraction is 2 / 5 then 5 will be the
denominator in this fraction (Beverley, Hughes and Hastings, 2018).
QUESTION 2
Expressing 24 / 40 and 18 / 42 in simplest forms
The simplest form of 24 / 40 is 3 / 5. The simplest form for 18 / 42 is 3 / 7.
QUESTION 3
a. Expressing the fractions 2 / 3, 3 / 4 and 5 / 6 equivalent with a denominator of 12
The fractions with denominator of 12 are as follows:
1
2 / 3 = 8 / 12
3 / 4 = 9 / 12
5 / 6 = 10 / 12
b. Making up the two thirds of the remainder
Total books in library = 60000
Books of business = 14000
Books of health care = 22000
Books of psychology and law = 12000
Remaining books = 12000
2 / of the remainder = 12000 * 2 / 3
= 8000
Percentage of books on computing = 8000 / 48000 * 100
= 16.67%
QUESTION 4
Price of each pair of the running shoes
The payment which was made by Liz = three notes of 50 pounds which means 150
pounds (Fitzallen, Watson and Wright, 2017).
Change received by Liz = 10.50 pounds
Total payment which was made by Liz = 150 – 10.50
= 139.5
139.5 payment was made for two pairs of running shoes.
Cost of one pair of shoes = 139.5 / 2
= 69.75
QUESTION 5
a. What is 240.50 * 19.54
The value will be 4700 in the two significant figures.
b. Writing the number 52100 as the power of 10
5.21 *10 ^ 4 is the power of 10 fir 52100.
2
⊘ This is a preview!⊘
Do you want full access?
Subscribe today to unlock all pages.
Trusted by 1+ million students worldwide
QUESTION 6
a. Total saving made by Patty and her siblings
Total payment made by Patty and her siblings = 210
As the payment is made after the 30% discount so the actual payment which was required
to be made by them will be = 210 / 70 * 100
= 300
So the total savings by all of them will be = 300 – 210
= 90
b. Average saving per person
Total payment which was made by three of them after discount = 210
Payment made by each person = 210 / 3
= 70
Total payment before discount = 300
Payment for each person = 300 / 3
= 100
Saving per person = 100 – 70
= 30
QUESTION 7
a. 3 / 4 – 7 / 9 + 2 / 3
3 / 4 – 7 / 9 + 2 / 3
= 0.75 – 0.7777 + 0.6666
= 0.6389 or 0.64
b. Largest number from all the values
The largest number from all the values is 0.10.
QUESTION 8
The percentage of men that said no
Total number of men = 90
Total number of women = 60
Total people who watched movie = 150
3
Paraphrase This Document
Need a fresh take? Get an instant paraphrase of this document with our AI Paraphraser
People who said yes = 150 * 3 / 5
= 90
Women who said yes = 60 * 3 / 10
= 18
Total men who said yes = Total people who said yes – women who said yes
= 90 – 18
= 72
Total men who said no = 90 – 72
= 18
Percentage of men who said no = 18 / 90 * 100
= 20%
QUESTION 9
The latest time that Annabelle can leave home
The latest time that Annabelle can leave home is 8:05 am because if she will leave home
at this time then she can reach to the railway station at 9:05 in 60 minutes and she can catch the
train that run 5 minute past the hour. The train will reach to the Birmingham station at 10:15 and
the walking distance will be 5 minutes so she will reach to the meeting at 10:20. 10 minutes
could be taken by her to get prepare for the meeting (Grebitusand Davis, 2019). If she will leave
the home after 8:05 then she will have to catch the train that run 25 minute past the hour.
QUESTION 10
Analysis of the box which is heavier
The box which is heavier is of Wheetabix as it is having 0.36 Kg in it and the box with
Shredded wheat have only 0.35 kg weight in it (Kjelvik and Schultheis, 2019).
QUESTION 11
a. The country with lowest number of overall medals
Sweden is the country which is having lowest number of overall medals.
b. The country or countries which competed the least number of games
The countries which competed the least number of games are China and Soviet Union.
4
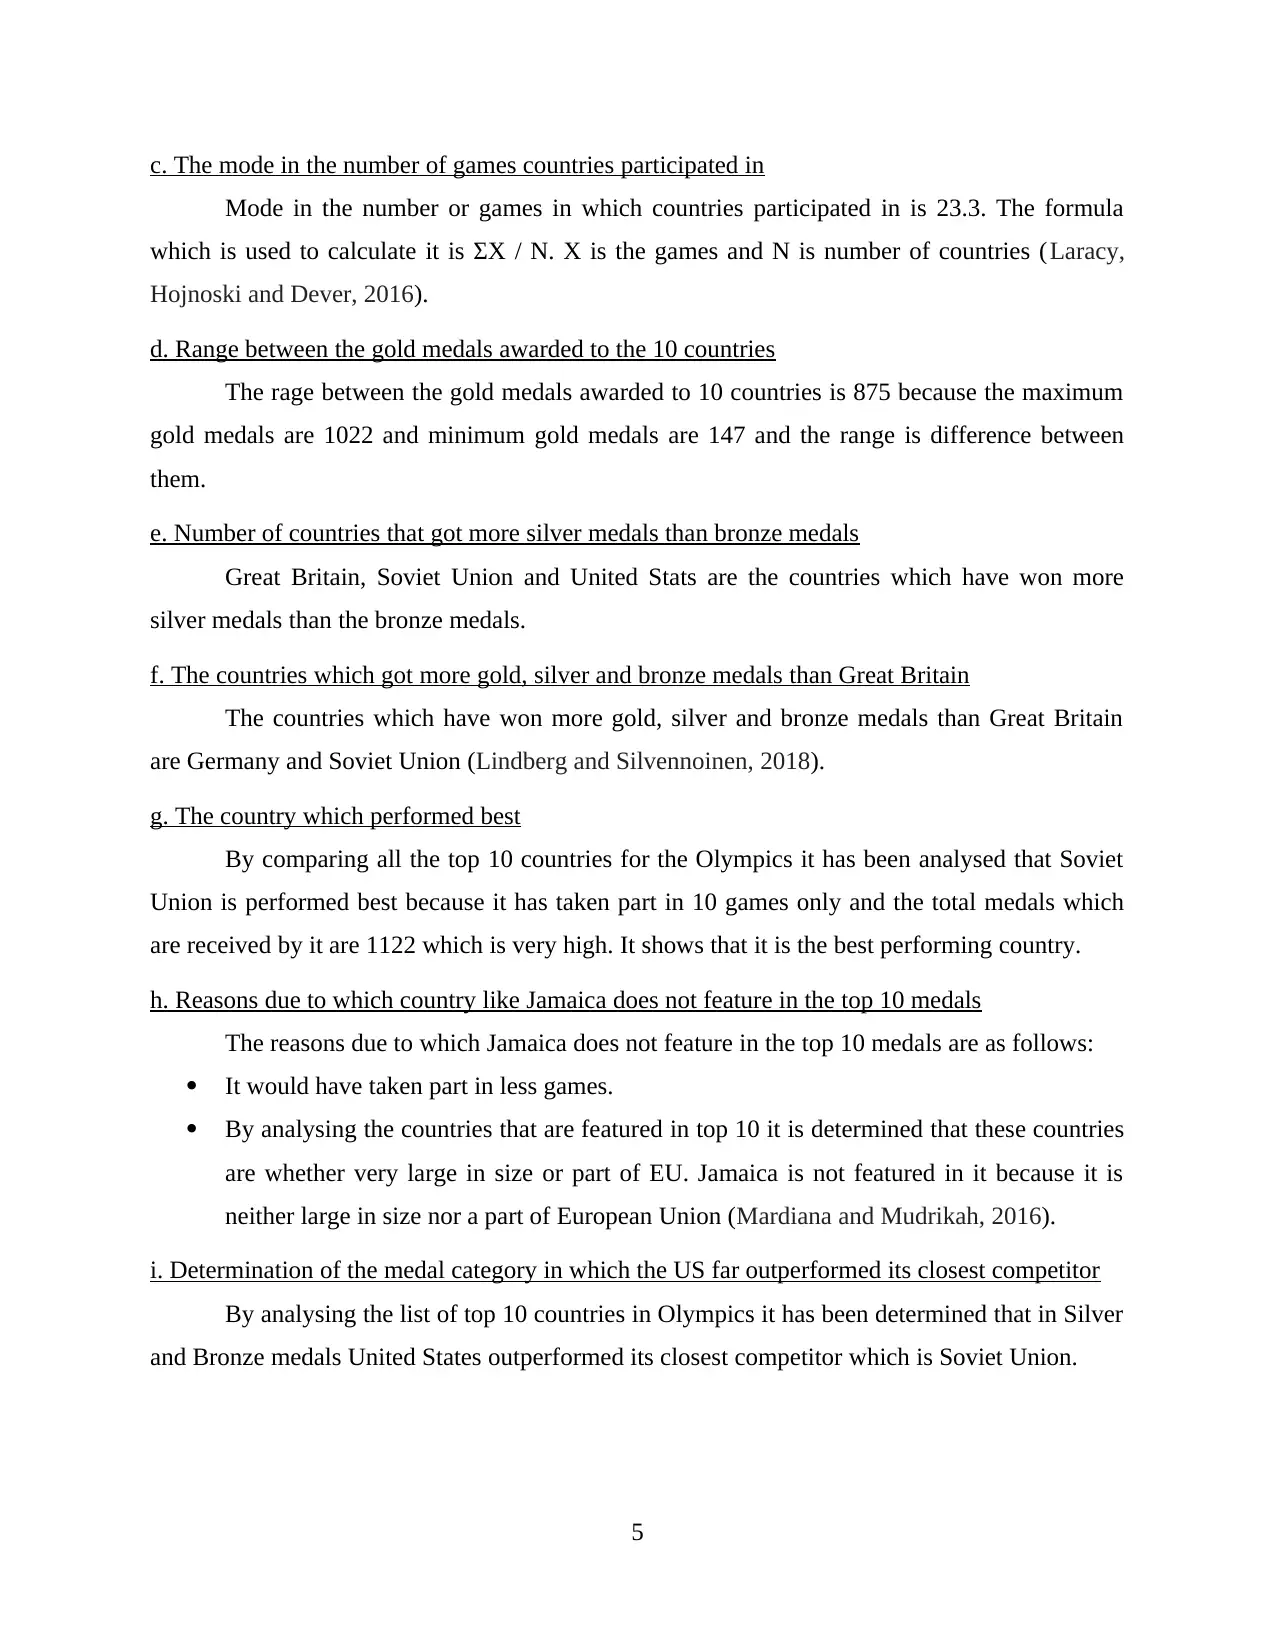
c. The mode in the number of games countries participated in
Mode in the number or games in which countries participated in is 23.3. The formula
which is used to calculate it is ΣX / N. X is the games and N is number of countries (Laracy,
Hojnoski and Dever, 2016).
d. Range between the gold medals awarded to the 10 countries
The rage between the gold medals awarded to 10 countries is 875 because the maximum
gold medals are 1022 and minimum gold medals are 147 and the range is difference between
them.
e. Number of countries that got more silver medals than bronze medals
Great Britain, Soviet Union and United Stats are the countries which have won more
silver medals than the bronze medals.
f. The countries which got more gold, silver and bronze medals than Great Britain
The countries which have won more gold, silver and bronze medals than Great Britain
are Germany and Soviet Union (Lindberg and Silvennoinen, 2018).
g. The country which performed best
By comparing all the top 10 countries for the Olympics it has been analysed that Soviet
Union is performed best because it has taken part in 10 games only and the total medals which
are received by it are 1122 which is very high. It shows that it is the best performing country.
h. Reasons due to which country like Jamaica does not feature in the top 10 medals
The reasons due to which Jamaica does not feature in the top 10 medals are as follows:
It would have taken part in less games.
By analysing the countries that are featured in top 10 it is determined that these countries
are whether very large in size or part of EU. Jamaica is not featured in it because it is
neither large in size nor a part of European Union (Mardiana and Mudrikah, 2016).
i. Determination of the medal category in which the US far outperformed its closest competitor
By analysing the list of top 10 countries in Olympics it has been determined that in Silver
and Bronze medals United States outperformed its closest competitor which is Soviet Union.
5
⊘ This is a preview!⊘
Do you want full access?
Subscribe today to unlock all pages.
Trusted by 1+ million students worldwide
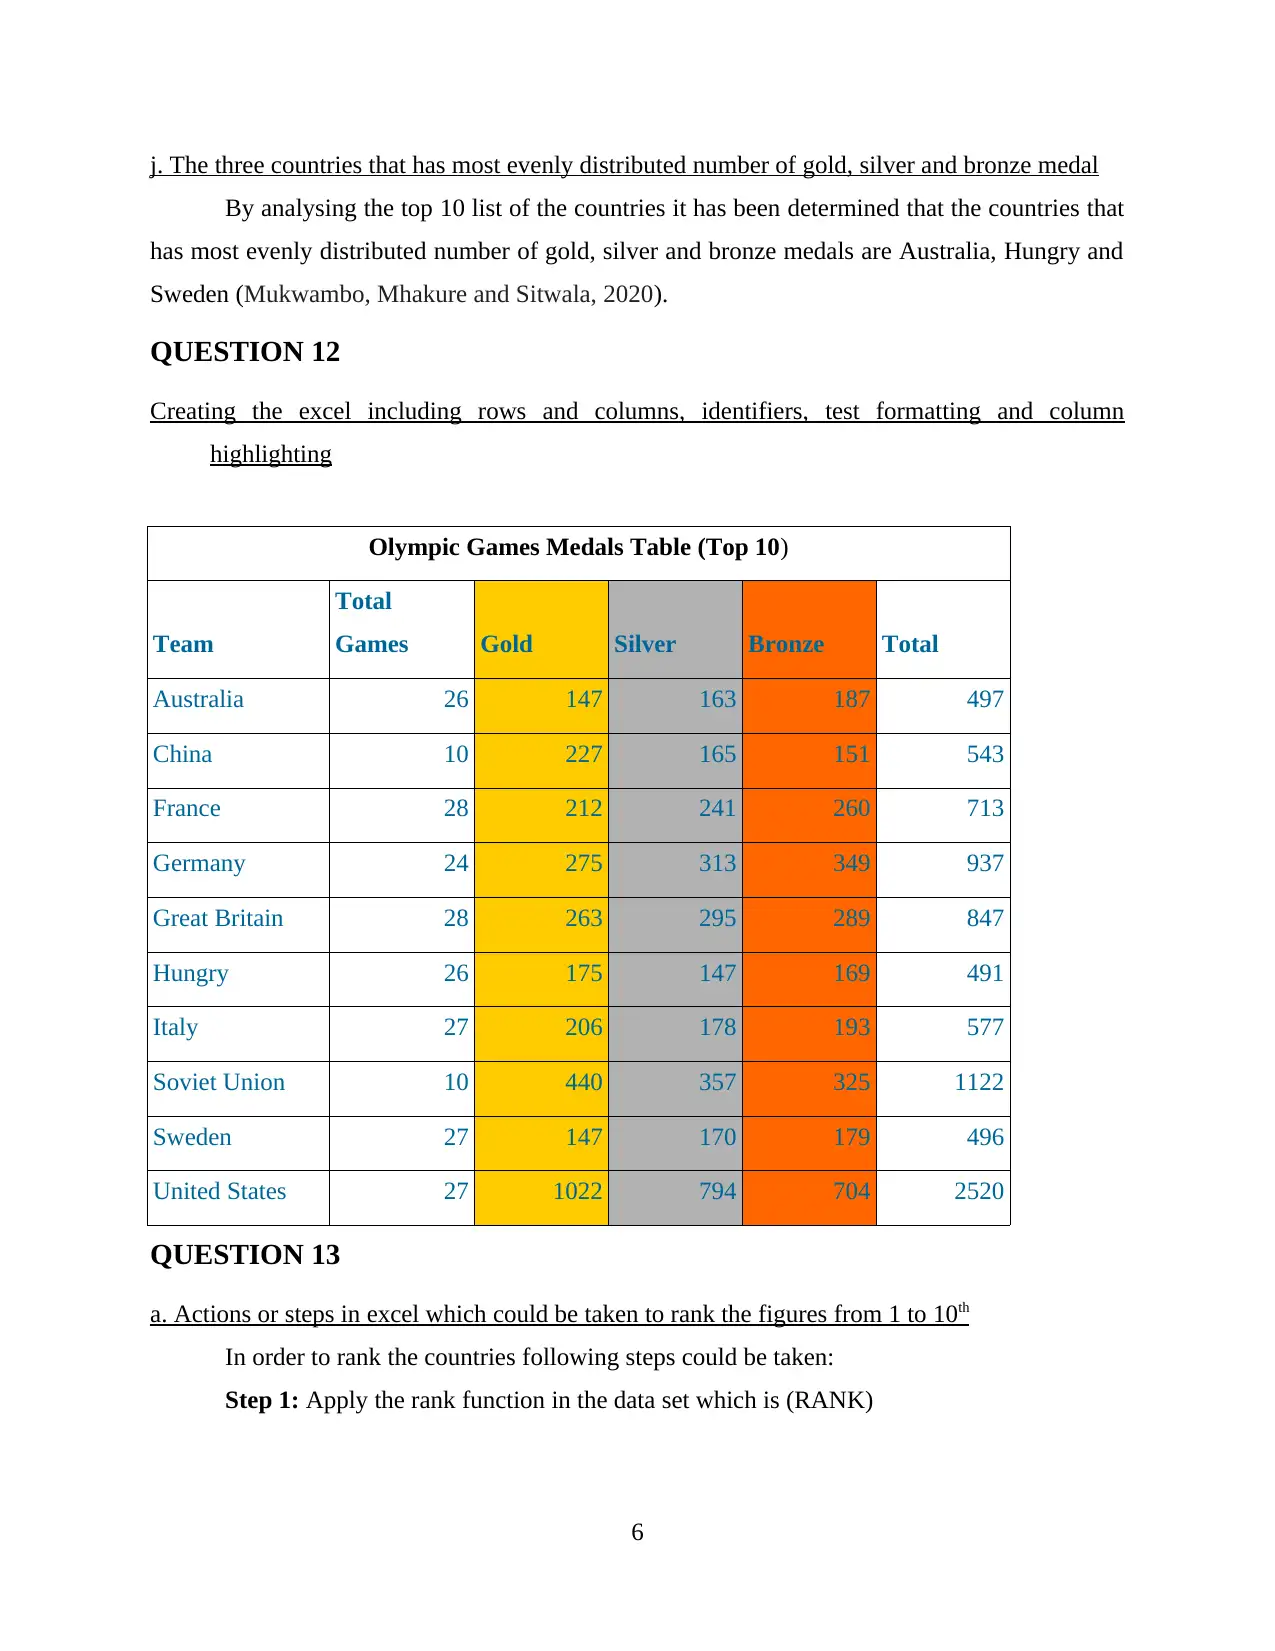
j. The three countries that has most evenly distributed number of gold, silver and bronze medal
By analysing the top 10 list of the countries it has been determined that the countries that
has most evenly distributed number of gold, silver and bronze medals are Australia, Hungry and
Sweden (Mukwambo, Mhakure and Sitwala, 2020).
QUESTION 12
Creating the excel including rows and columns, identifiers, test formatting and column
highlighting
Olympic Games Medals Table (Top 10)
Team
Total
Games Gold Silver Bronze Total
Australia 26 147 163 187 497
China 10 227 165 151 543
France 28 212 241 260 713
Germany 24 275 313 349 937
Great Britain 28 263 295 289 847
Hungry 26 175 147 169 491
Italy 27 206 178 193 577
Soviet Union 10 440 357 325 1122
Sweden 27 147 170 179 496
United States 27 1022 794 704 2520
QUESTION 13
a. Actions or steps in excel which could be taken to rank the figures from 1 to 10th
In order to rank the countries following steps could be taken:
Step 1: Apply the rank function in the data set which is (RANK)
6
Paraphrase This Document
Need a fresh take? Get an instant paraphrase of this document with our AI Paraphraser
Step 2: Now the range which is required to be ranked will be selected. For example:
[=RANK(B2,B2:B11).
Step 3: At last the ranks will be provided to all the figures.
b. Specific actions or steps in excel which will produce a list of the countries with 800 or more
medals in total
In order to produce the list of countries with 800 or more medals specific setps required
are as follows:
Step 1: Selecting the rows that are required to be grouped under the 800 or more medals.
Step 2: Then the user will be required to go to the data ribbon.
Step 3: After than group is required to be selected.
Step 4: At last the group will be selected again.
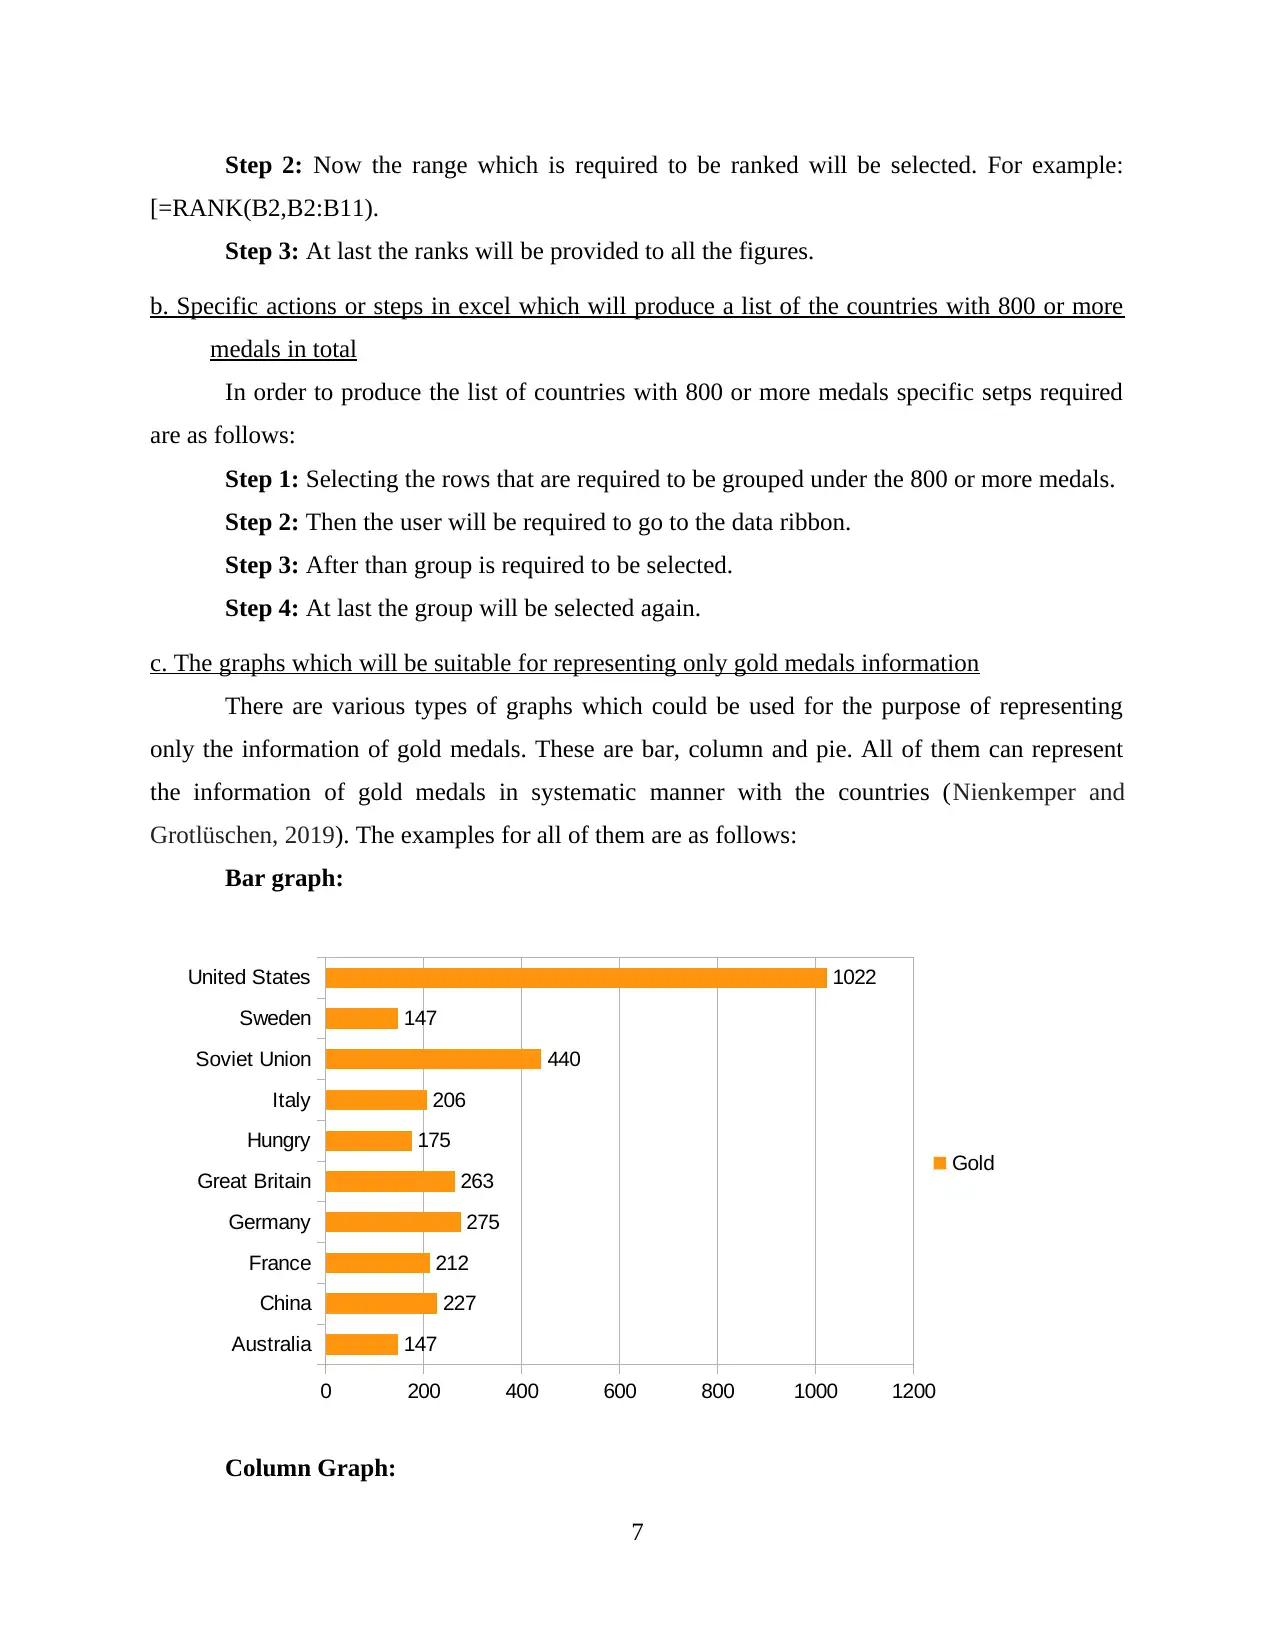
c. The graphs which will be suitable for representing only gold medals information
There are various types of graphs which could be used for the purpose of representing
only the information of gold medals. These are bar, column and pie. All of them can represent
the information of gold medals in systematic manner with the countries (Nienkemper and
Grotlüschen, 2019). The examples for all of them are as follows:
Bar graph:
Australia
China
France
Germany
Great Britain
Hungry
Italy
Soviet Union
Sweden
United States
0 200 400 600 800 1000 1200
147
227
212
275
263
175
206
440
147
1022
Gold
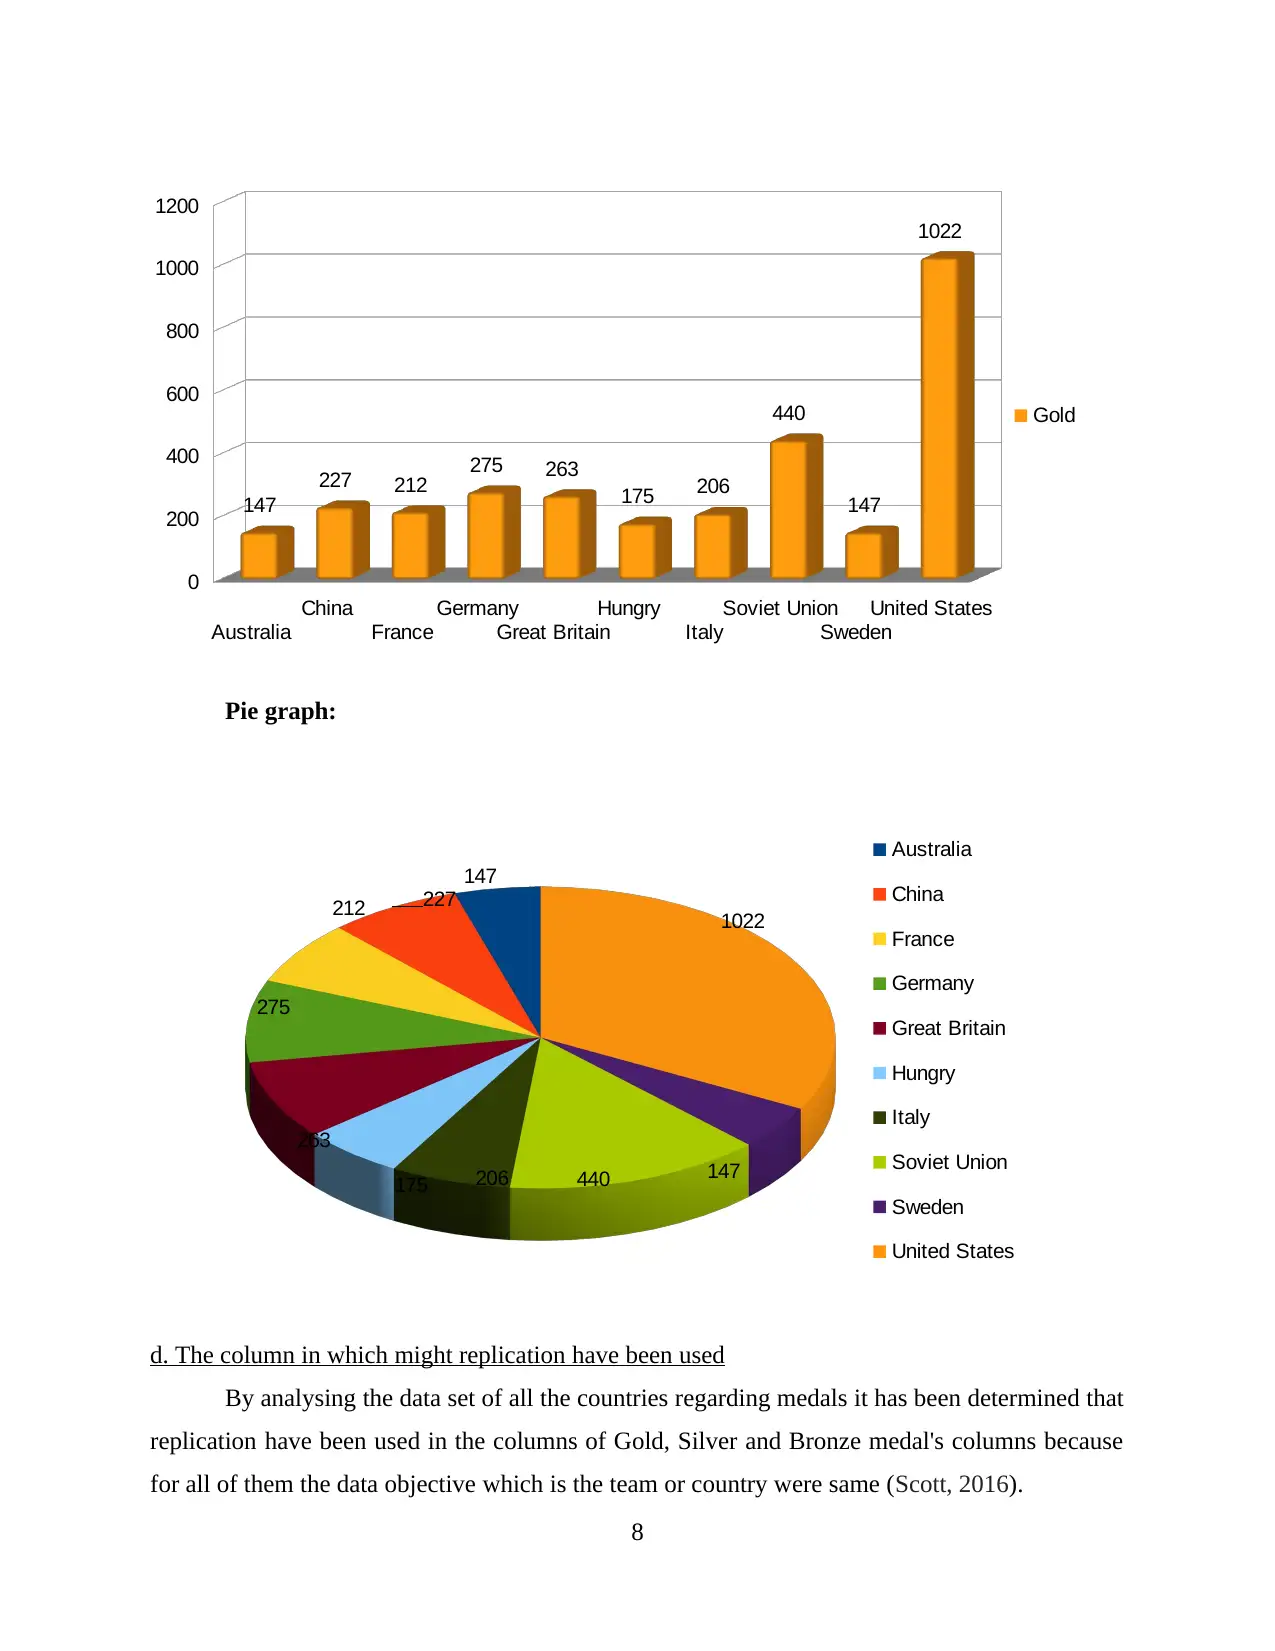
Column Graph:
7
[=RANK(B2,B2:B11).
Step 3: At last the ranks will be provided to all the figures.
b. Specific actions or steps in excel which will produce a list of the countries with 800 or more
medals in total
In order to produce the list of countries with 800 or more medals specific setps required
are as follows:
Step 1: Selecting the rows that are required to be grouped under the 800 or more medals.
Step 2: Then the user will be required to go to the data ribbon.
Step 3: After than group is required to be selected.
Step 4: At last the group will be selected again.
c. The graphs which will be suitable for representing only gold medals information
There are various types of graphs which could be used for the purpose of representing
only the information of gold medals. These are bar, column and pie. All of them can represent
the information of gold medals in systematic manner with the countries (Nienkemper and
Grotlüschen, 2019). The examples for all of them are as follows:
Bar graph:
Australia
China
France
Germany
Great Britain
Hungry
Italy
Soviet Union
Sweden
United States
0 200 400 600 800 1000 1200
147
227
212
275
263
175
206
440
147
1022
Gold
Column Graph:
7
Australia
China
France
Germany
Great Britain
Hungry
Italy
Soviet Union
Sweden
United States
0
200
400
600
800
1000
1200
147
227 212 275 263
175 206
440
147
1022
Gold
Pie graph:
147
227212
275
263
175 206 440 147
1022
Australia
China
France
Germany
Great Britain
Hungry
Italy
Soviet Union
Sweden
United States
d. The column in which might replication have been used
By analysing the data set of all the countries regarding medals it has been determined that
replication have been used in the columns of Gold, Silver and Bronze medal's columns because
for all of them the data objective which is the team or country were same (Scott, 2016).
8
China
France
Germany
Great Britain
Hungry
Italy
Soviet Union
Sweden
United States
0
200
400
600
800
1000
1200
147
227 212 275 263
175 206
440
147
1022
Gold
Pie graph:
147
227212
275
263
175 206 440 147
1022
Australia
China
France
Germany
Great Britain
Hungry
Italy
Soviet Union
Sweden
United States
d. The column in which might replication have been used
By analysing the data set of all the countries regarding medals it has been determined that
replication have been used in the columns of Gold, Silver and Bronze medal's columns because
for all of them the data objective which is the team or country were same (Scott, 2016).
8
⊘ This is a preview!⊘
Do you want full access?
Subscribe today to unlock all pages.
Trusted by 1+ million students worldwide
1 out of 20
Related Documents


Your All-in-One AI-Powered Toolkit for Academic Success.
+13062052269
info@desklib.com
Available 24*7 on WhatsApp / Email
![[object Object]](/_next/static/media/star-bottom.7253800d.svg)
Unlock your academic potential
Copyright © 2020–2026 A2Z Services. All Rights Reserved. Developed and managed by ZUCOL.