MG413 Data Insights Presentation: Correlation, Regression, Time Series

Verified

Added on  2023/06/15

|6
|834
|458
Presentation
AI Summary
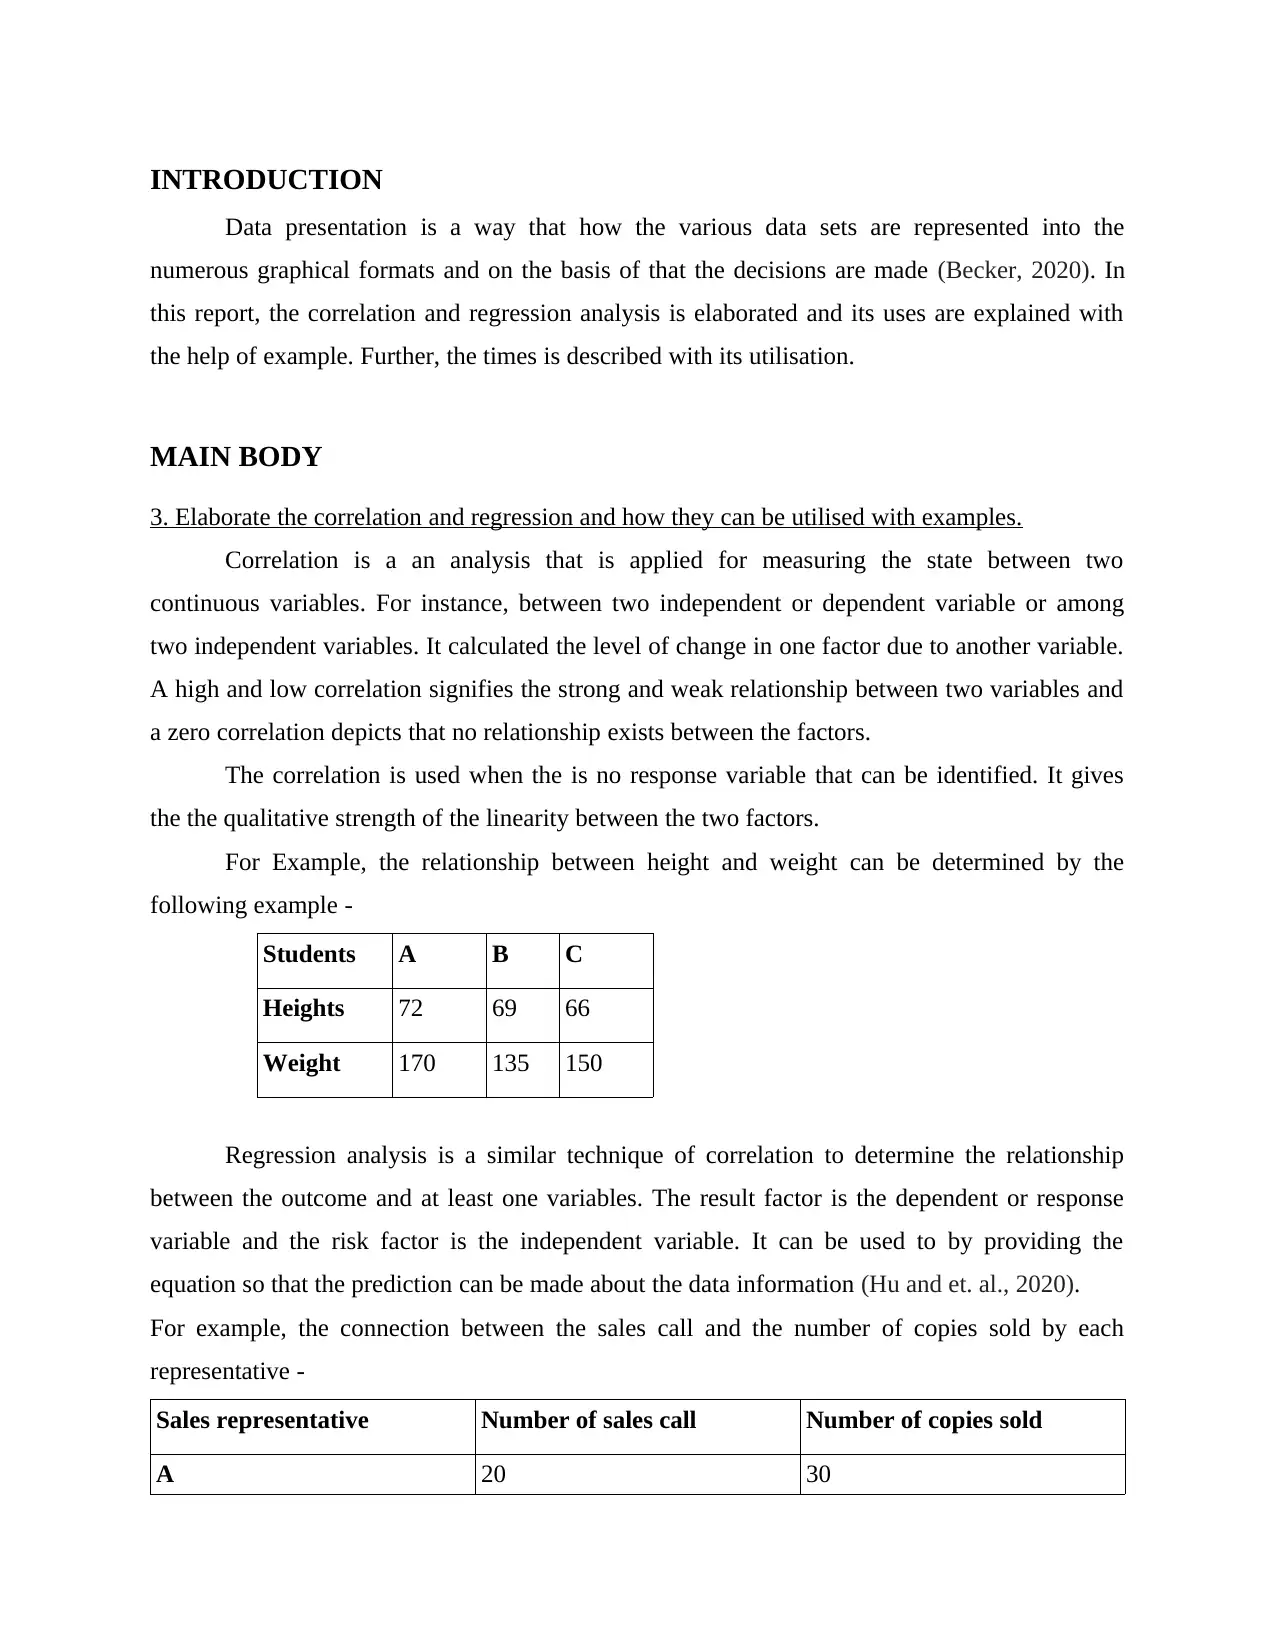
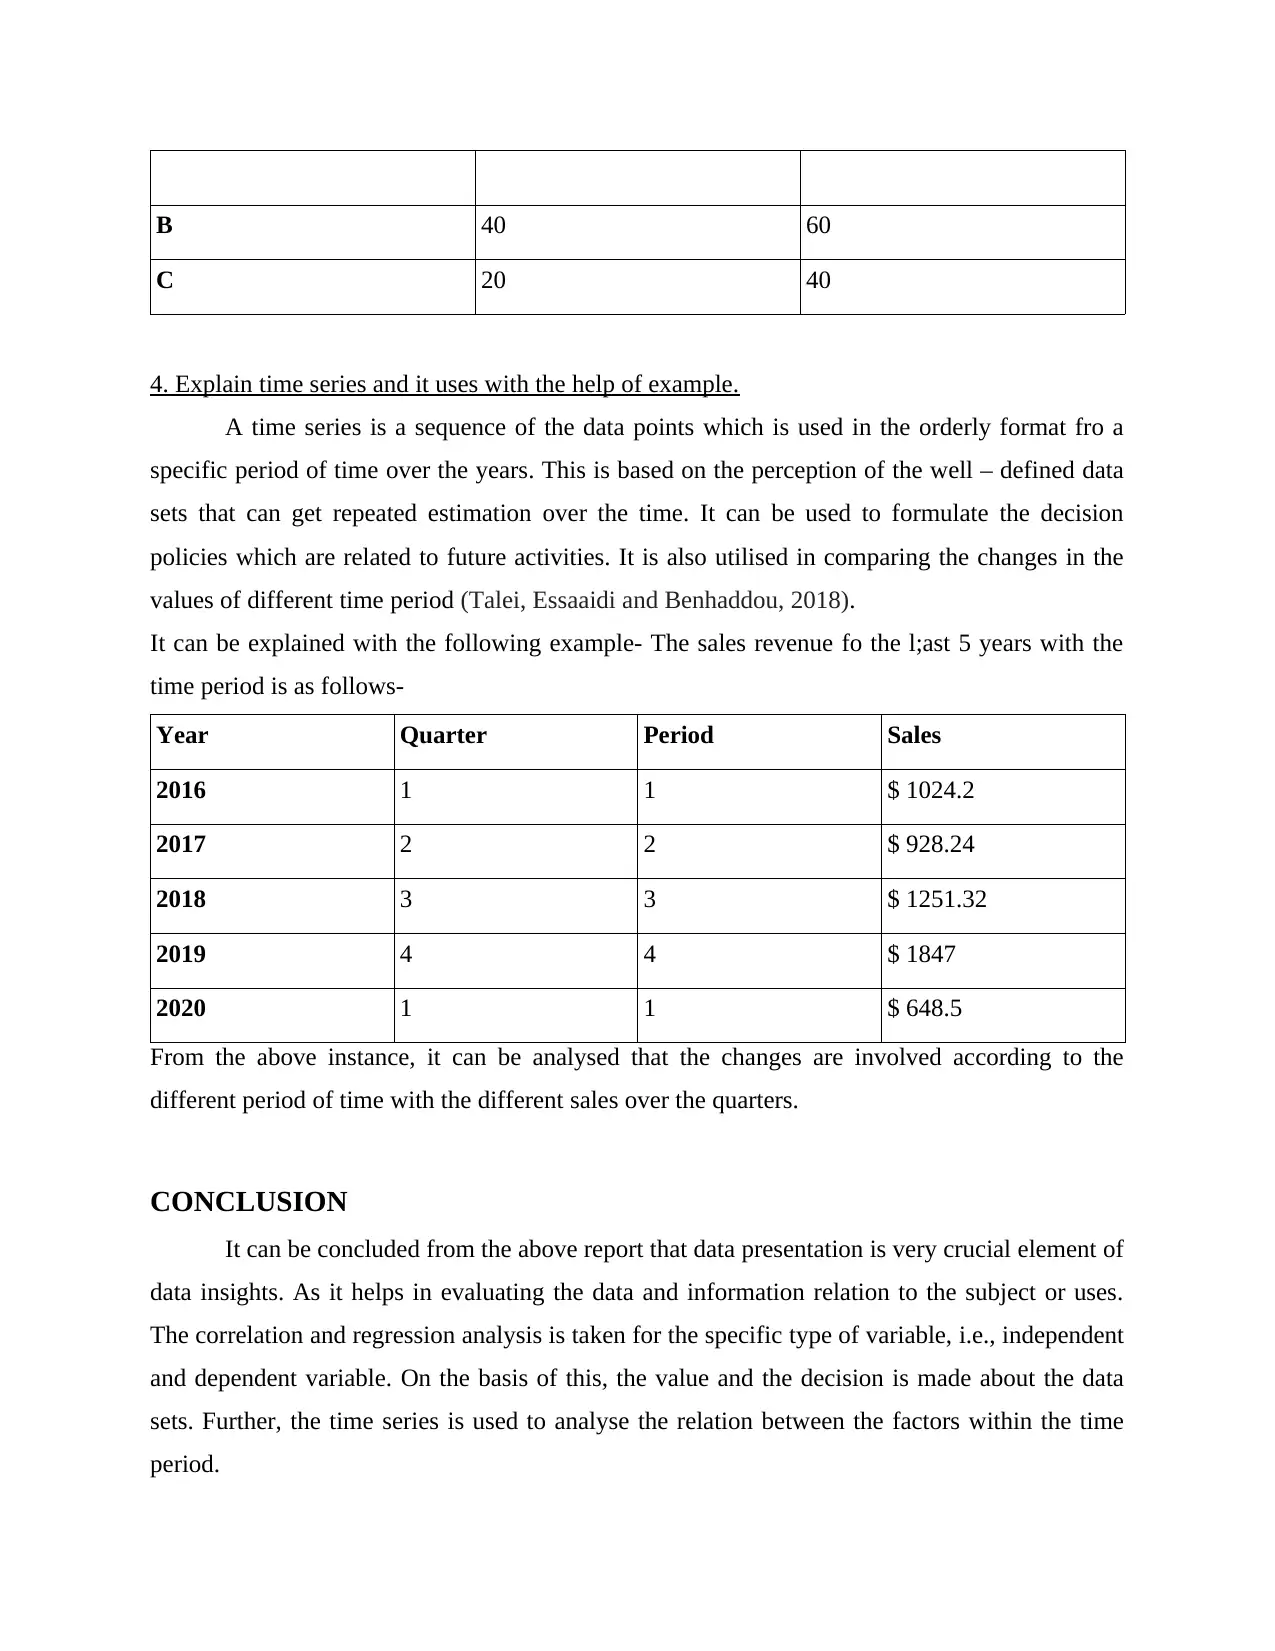
This presentation delves into the crucial aspects of data presentation, emphasizing the significance of effectively representing data sets through various graphical formats for informed decision-making. It elaborates on correlation and regression analyses, explaining their applications in measuring relationships between variables, supported by illustrative examples. Furthermore, the presentation elucidates time series analysis, highlighting its utility in identifying patterns and trends in data over specific periods, with a practical example demonstrating its application in sales revenue analysis. The presentation concludes by underscoring the importance of data presentation in gaining valuable data insights and facilitating sound decision-making processes.
Document Page
Data Presentation
tabler-icon-diamond-filled.svg

Paraphrase This Document

Need a fresh take? Get an instant paraphrase of this document with our AI Paraphraser
Document Page
Table of Contents
INTRODUCTION ..........................................................................................................................3
MAIN BODY...................................................................................................................................3
3. Elaborate the correlation and regression and how they can be utilised with examples..........3
4. Explain time series and it uses with the help of example.......................................................4
CONCLUSION ...............................................................................................................................4
REFERENCES................................................................................................................................6
Document Page
INTRODUCTION
Data presentation is a way that how the various data sets are represented into the
numerous graphical formats and on the basis of that the decisions are made (Becker, 2020). In
this report, the correlation and regression analysis is elaborated and its uses are explained with
the help of example. Further, the times is described with its utilisation.
MAIN BODY
3. Elaborate the correlation and regression and how they can be utilised with examples.
Correlation is a an analysis that is applied for measuring the state between two
continuous variables. For instance, between two independent or dependent variable or among
two independent variables. It calculated the level of change in one factor due to another variable.
A high and low correlation signifies the strong and weak relationship between two variables and
a zero correlation depicts that no relationship exists between the factors.
The correlation is used when the is no response variable that can be identified. It gives
the the qualitative strength of the linearity between the two factors.
For Example, the relationship between height and weight can be determined by the
following example -
Students A B C
Heights 72 69 66
Weight 170 135 150
Regression analysis is a similar technique of correlation to determine the relationship
between the outcome and at least one variables. The result factor is the dependent or response
variable and the risk factor is the independent variable. It can be used to by providing the
equation so that the prediction can be made about the data information (Hu and et. al., 2020).
For example, the connection between the sales call and the number of copies sold by each
representative -
Sales representative Number of sales call Number of copies sold
A 20 30
Document Page
B 40 60
C 20 40
4. Explain time series and it uses with the help of example.
A time series is a sequence of the data points which is used in the orderly format fro a
specific period of time over the years. This is based on the perception of the well – defined data
sets that can get repeated estimation over the time. It can be used to formulate the decision
policies which are related to future activities. It is also utilised in comparing the changes in the
values of different time period (Talei, Essaaidi and Benhaddou, 2018).
It can be explained with the following example- The sales revenue fo the l;ast 5 years with the
time period is as follows-
Year Quarter Period Sales
2016 1 1 $ 1024.2
2017 2 2 $ 928.24
2018 3 3 $ 1251.32
2019 4 4 $ 1847
2020 1 1 $ 648.5
From the above instance, it can be analysed that the changes are involved according to the
different period of time with the different sales over the quarters.
CONCLUSION
It can be concluded from the above report that data presentation is very crucial element of
data insights. As it helps in evaluating the data and information relation to the subject or uses.
The correlation and regression analysis is taken for the specific type of variable, i.e., independent
and dependent variable. On the basis of this, the value and the decision is made about the data
sets. Further, the time series is used to analyse the relation between the factors within the time
period.
tabler-icon-diamond-filled.svg

Paraphrase This Document

Need a fresh take? Get an instant paraphrase of this document with our AI Paraphraser
Document Page
Document Page
REFERENCES
Books and Journals
Becker, B., 2020. 7. Holocene Tree Ring Series from Southern Central Europe for Archaeologic
Dating, Radiocarbon Calibration, and Stable Isotope Analysis. In Radiocarbon Dating.
(pp. 554-565). University of California Press.
Hu, Z. and et. al., 2020. Tracking via context-aware regression correlation filter with a spatial–
temporal regularization. Journal of Electronic Imaging. 29(2). p.023029.
Talei, H., Essaaidi, M. and Benhaddou, D., 2018, December. An end to end real time
architecture for analyzing and clustering time series data: case of an energy
management system. In 2018 6th International Renewable and Sustainable Energy
Conference (IRSEC). (pp. 1-7). IEEE.
Xu, F. and Huang, L., 2018. The analysis of the civil aviation passenger traffic based on the
improved multiple linear regression model. International Journal of Engineering,
Science and Mathematics. 7(9). pp.28-35.
chevron_up_icon
1 out of 6
circle_padding
hide_on_mobile
zoom_out_icon
[object Object]