Analyzing Information & Data for Problem Solving in Germany Stationary
VerifiedAdded on 2023/03/22
|15
|2718
|97
Report
AI Summary
This report provides a comprehensive analysis of the stationary business in Germany, examining market trends, sales data, and potential growth opportunities. It uses correlation and trend line analysis to interpret sales data across various EU nations, highlighting Germany and Switzerland as key markets. The analysis includes product-wise sales comparisons, revealing that writing/drawing materials and office furniture generate significant revenue. The report also covers ISO standards, monthly cost calculations, and confidence interval analysis for order values. Recommendations are made to improve the business situation based on the findings, emphasizing the need for increased sales efforts and technological upgrades. This document is a student contribution available on Desklib, a platform offering a range of study tools and solved assignments.
ANALYSING INFORMATION & DATA
FOR PROBLEM SOLVING
FOR PROBLEM SOLVING
Paraphrase This Document
Need a fresh take? Get an instant paraphrase of this document with our AI Paraphraser
TABLE OF CONTENTS
INTRODUCTION...........................................................................................................................1
TASK 1............................................................................................................................................1
Trends in Germany stationary market.........................................................................................1
TASK 2............................................................................................................................................2
TASK 3............................................................................................................................................3
(a)Total sales value of products from 2015 to 2017....................................................................3
(b) Pie chart for sales amid of 2016 and 2017 productwise.......................................................3
(c) Coorelation cofficient.............................................................................................................4
(d) Making prediction on basis of trend line...............................................................................4
TASK 4............................................................................................................................................5
(a)Completion of table.................................................................................................................5
(b)International standard applied to the firm business................................................................6
TASK 5............................................................................................................................................6
(a)Monthly cost by considering year...........................................................................................6
(b)Monthly cost by considering month........................................................................................7
TASK 6............................................................................................................................................7
Confidence interval......................................................................................................................7
TASK 7............................................................................................................................................8
(a)Recommendation to improve situation...................................................................................8
(b)Descriptive statistics...............................................................................................................8
CONCLUSION................................................................................................................................8
REFERENCE..................................................................................................................................9
Figure 1Wholesale stationary business in Germany........................................................................1
Figure 2Product wise sales value.....................................................................................................3
Figure 3Scatter diagram and coorelation cofficient.........................................................................4
Figure 4Calculation of monthly cost...............................................................................................6
Figure 5Calculation of monthly cost by using 12 months time period............................................7
Figure 6Calculation of confidence interval.....................................................................................7
⊘ This is a preview!⊘
Do you want full access?
Subscribe today to unlock all pages.
Trusted by 1+ million students worldwide
INTRODUCTION
Stationary business is the one of the growing business in Germany. Number of business
firms in stationary busines are growing at rapid rate which are producing scales, pencil,
sharpners and many other stationary items. In the current report stationary business is analyzed
across varied EU nations. Coorelation and trend line like techniques are applied on dataset and
meaningful interpretations are made. Correlation results reflect that with increase in year in
positive manner sales value of stationary also increase at rapid rate. Trend analysis results reflect
that in upcoming time period sales value will increase at rapid pace Means that in futuren time
period sales of stationary products will increase at rapid pace as same thing is reflected by both
coorelation and trend analysis. At end of the report, descriptive statistics are applied and
comparison between variables are made. By forming conclusion research work is completed in
the report.
TASK 1
Trends in Germany stationary market
1 2 3 4 5 6 7 8 9 10 11 12 13 14 15
0
1000
2000
3000
4000
5000
6000
7000
8000
9000 7973 7791 7736 7620 7429 7242 6965 6941 6632 6335 6047 5710 5440 5200 5300
Number of firms
Figure 1Wholesale stationary business in Germany
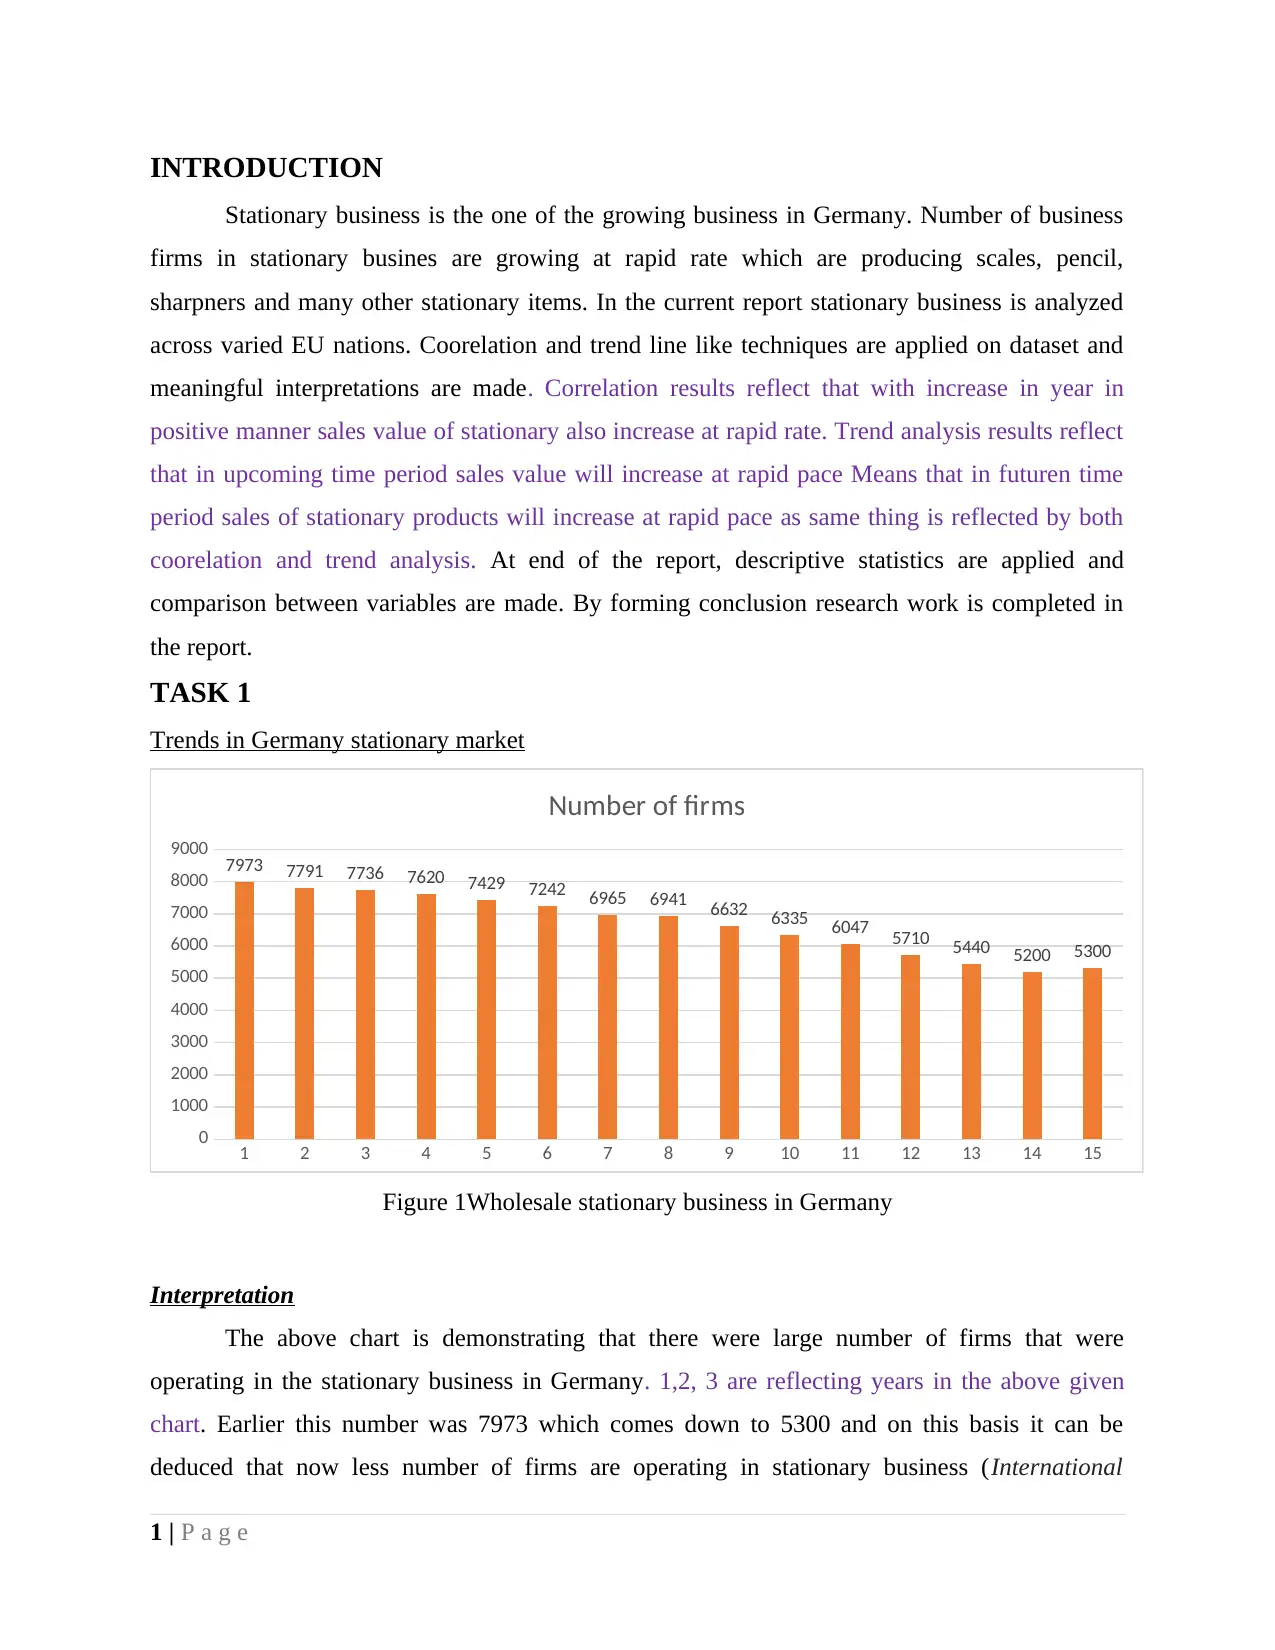
Interpretation
The above chart is demonstrating that there were large number of firms that were
operating in the stationary business in Germany. 1,2, 3 are reflecting years in the above given
chart. Earlier this number was 7973 which comes down to 5300 and on this basis it can be
deduced that now less number of firms are operating in stationary business (International
1 | P a g e
Stationary business is the one of the growing business in Germany. Number of business
firms in stationary busines are growing at rapid rate which are producing scales, pencil,
sharpners and many other stationary items. In the current report stationary business is analyzed
across varied EU nations. Coorelation and trend line like techniques are applied on dataset and
meaningful interpretations are made. Correlation results reflect that with increase in year in
positive manner sales value of stationary also increase at rapid rate. Trend analysis results reflect
that in upcoming time period sales value will increase at rapid pace Means that in futuren time
period sales of stationary products will increase at rapid pace as same thing is reflected by both
coorelation and trend analysis. At end of the report, descriptive statistics are applied and
comparison between variables are made. By forming conclusion research work is completed in
the report.
TASK 1
Trends in Germany stationary market
1 2 3 4 5 6 7 8 9 10 11 12 13 14 15
0
1000
2000
3000
4000
5000
6000
7000
8000
9000 7973 7791 7736 7620 7429 7242 6965 6941 6632 6335 6047 5710 5440 5200 5300
Number of firms
Figure 1Wholesale stationary business in Germany
Interpretation
The above chart is demonstrating that there were large number of firms that were
operating in the stationary business in Germany. 1,2, 3 are reflecting years in the above given
chart. Earlier this number was 7973 which comes down to 5300 and on this basis it can be
deduced that now less number of firms are operating in stationary business (International
1 | P a g e
Paraphrase This Document
Need a fresh take? Get an instant paraphrase of this document with our AI Paraphraser
suppliers, 2017). Post recession trend was begined but after 2008 decline happened at rapid pace
in number of firms that are in stationary business. This also indicates that to some extent
competition get reduced in the market. On basis of results it can be said that in future time period
number of firms may decline in the industry which will prove good for company as number of
competitors will reduced. In next five to ten years if same trend continue firm may become
benefit to large extent.
2 | P a g e
TASK 2
France
Germany
Italy
Romania
UK
Poland
Switzerland
0 5000 10000 15000 20000 25000 30000
15475
24984
16000
17000
14000
19000
20500
14887
24559
14000
17600
16900
19900
21000
14746
24900
14500
18300
17300
20000
21500
14697
25483
15000
18000
17900
23000
22500
15432
26757
15750
18900
18795
24150
23625
Sales value of last five years for EU nations
Series6 Series5 Series4 Series3 Series2 Series1
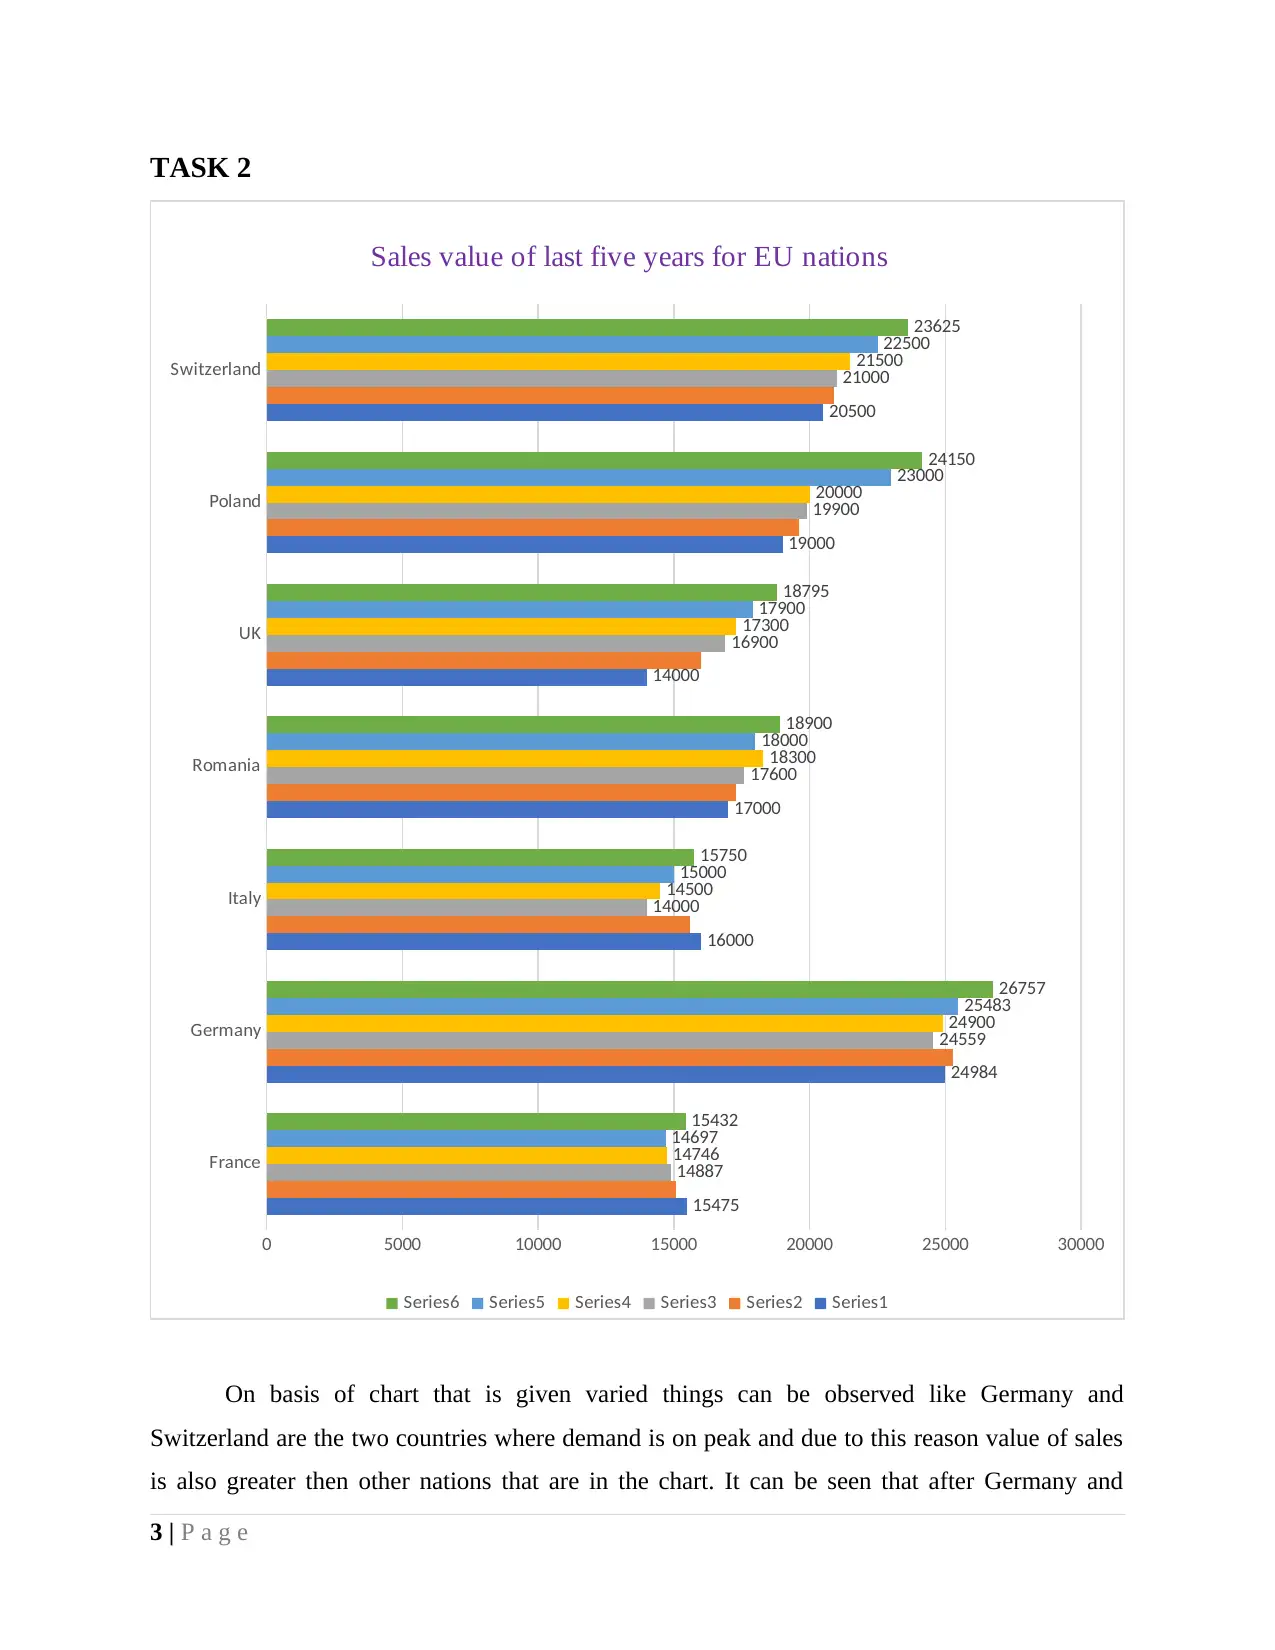
On basis of chart that is given varied things can be observed like Germany and
Switzerland are the two countries where demand is on peak and due to this reason value of sales
is also greater then other nations that are in the chart. It can be seen that after Germany and
3 | P a g e
France
Germany
Italy
Romania
UK
Poland
Switzerland
0 5000 10000 15000 20000 25000 30000
15475
24984
16000
17000
14000
19000
20500
14887
24559
14000
17600
16900
19900
21000
14746
24900
14500
18300
17300
20000
21500
14697
25483
15000
18000
17900
23000
22500
15432
26757
15750
18900
18795
24150
23625
Sales value of last five years for EU nations
Series6 Series5 Series4 Series3 Series2 Series1
On basis of chart that is given varied things can be observed like Germany and
Switzerland are the two countries where demand is on peak and due to this reason value of sales
is also greater then other nations that are in the chart. It can be seen that after Germany and
3 | P a g e
⊘ This is a preview!⊘
Do you want full access?
Subscribe today to unlock all pages.
Trusted by 1+ million students worldwide
Switzerland country where sales value is high is Romania. Apart from these nations Poland,
France and Italy are the nations that comes in fourth, fifith and sixth position in the market. Thus,
it can concluded that in two EU nations which are Germany and Switzerland higher amount of
sales is made. In Germany usually students spend 300 Euro of amount on purchaisng varied
items of stationary. For education purpose number of foreign people comes in mentioned nation
every year. Hence, per capita expenditure on stationary may further increase.
TASK 3
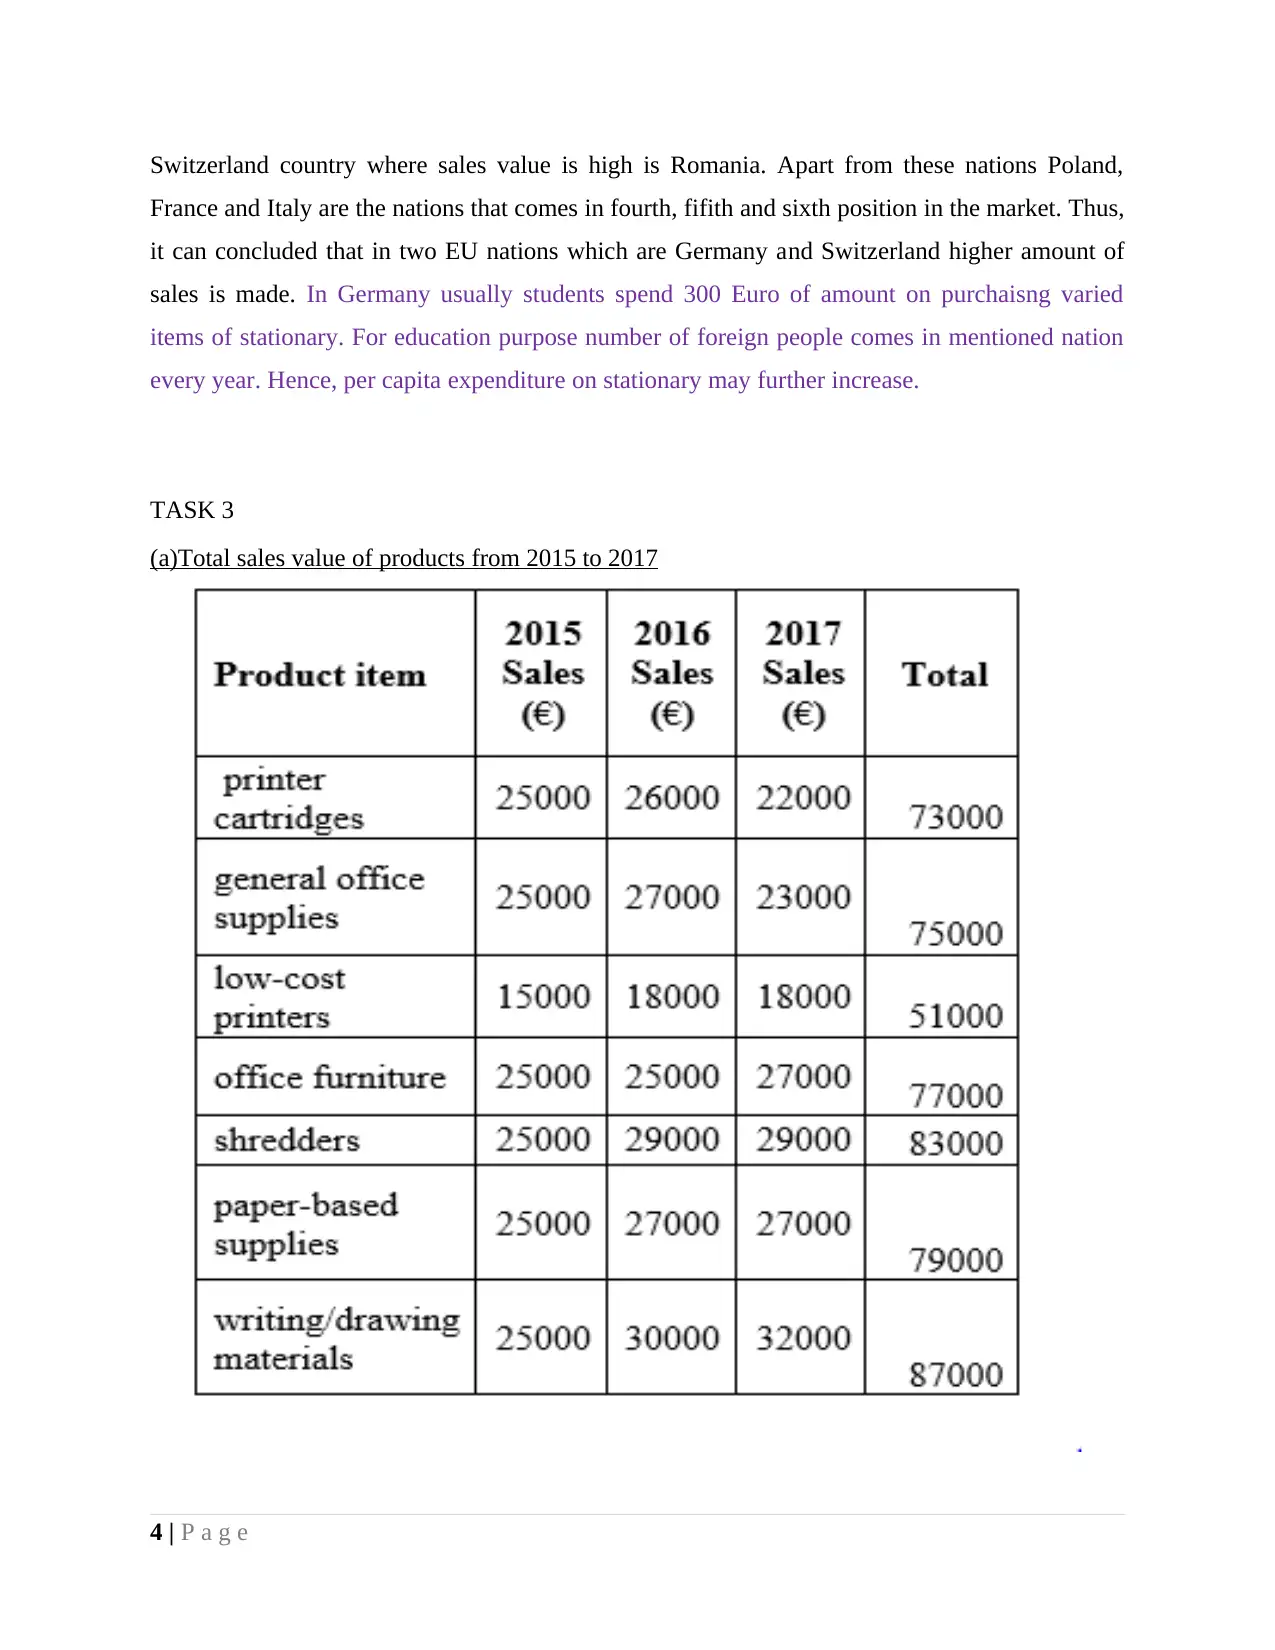
(a)Total sales value of products from 2015 to 2017
4 | P a g e
France and Italy are the nations that comes in fourth, fifith and sixth position in the market. Thus,
it can concluded that in two EU nations which are Germany and Switzerland higher amount of
sales is made. In Germany usually students spend 300 Euro of amount on purchaisng varied
items of stationary. For education purpose number of foreign people comes in mentioned nation
every year. Hence, per capita expenditure on stationary may further increase.
TASK 3
(a)Total sales value of products from 2015 to 2017
4 | P a g e
Paraphrase This Document
Need a fresh take? Get an instant paraphrase of this document with our AI Paraphraser
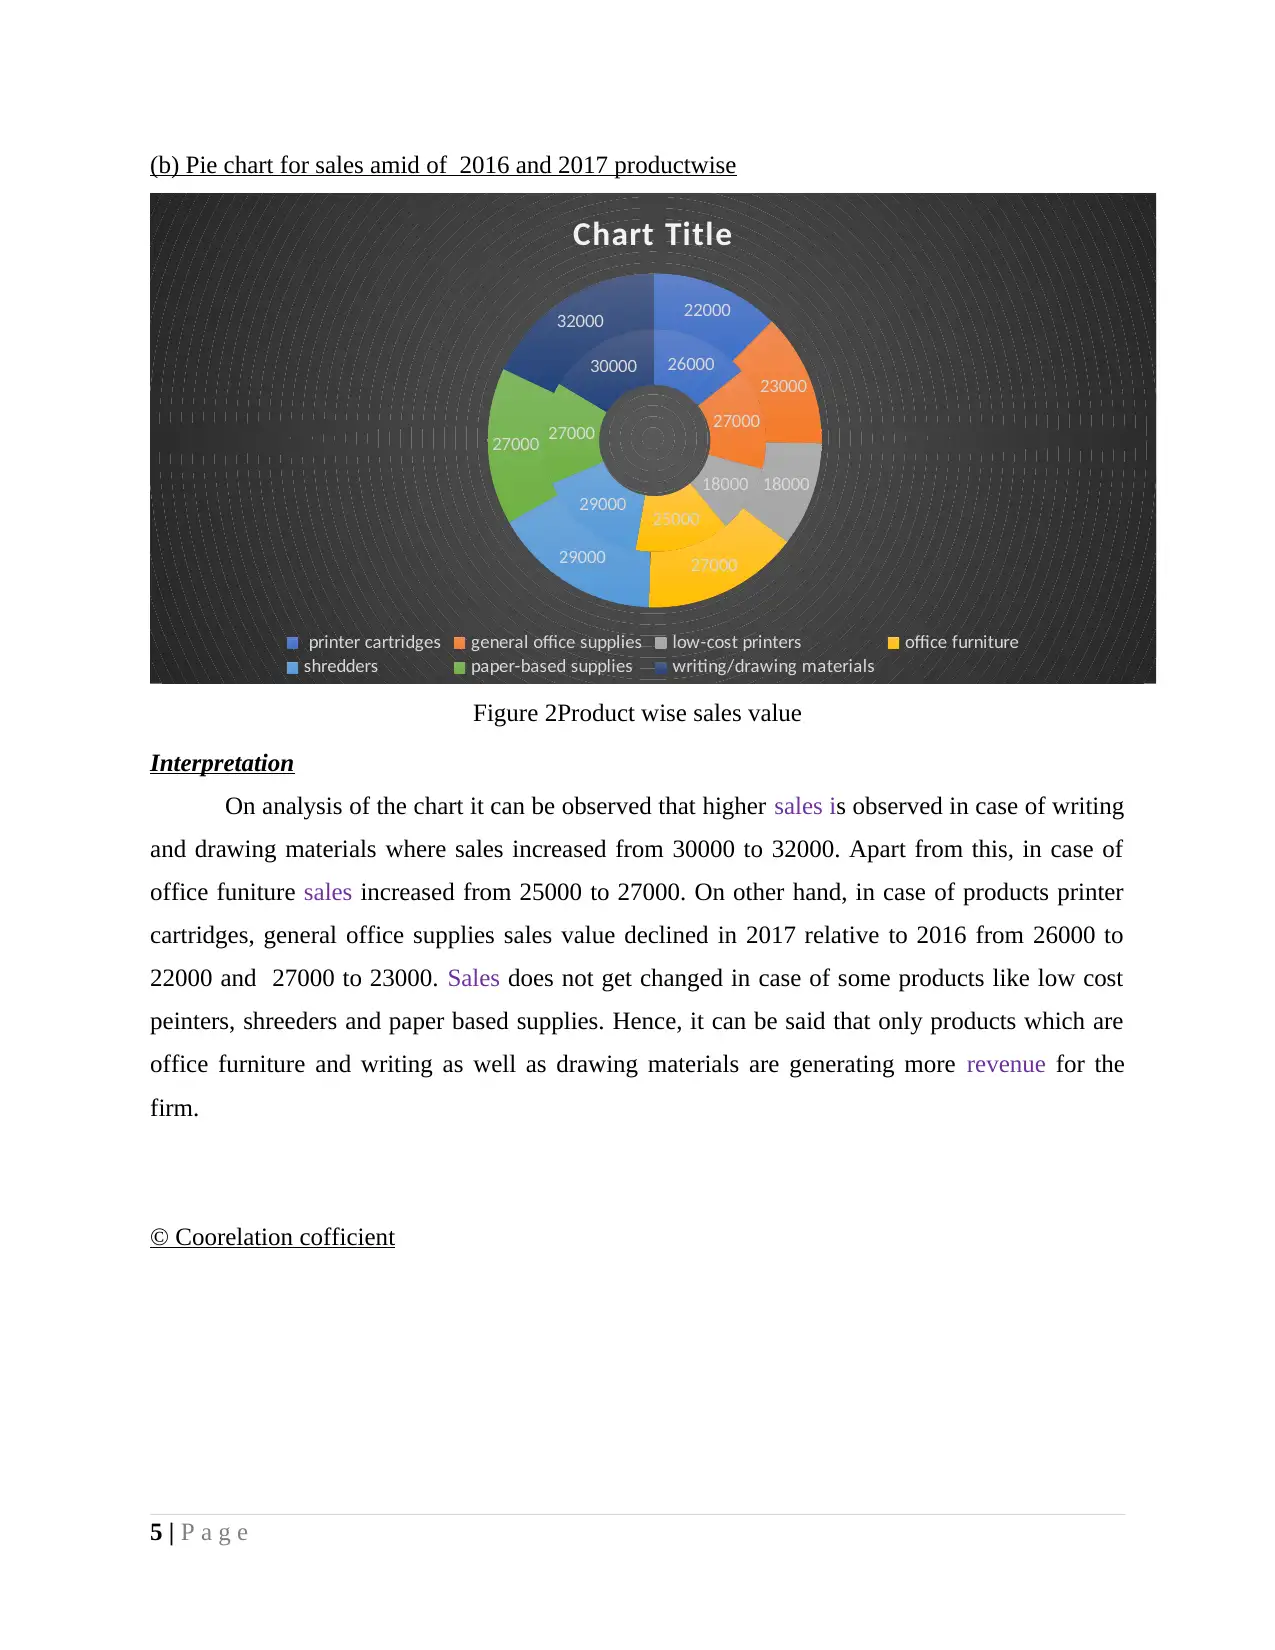
(b) Pie chart for sales amid of 2016 and 2017 productwise
26000
27000
18000
25000
29000
27000
30000
22000
23000
18000
2700029000
27000
32000
Chart Title
printer cartridges general office supplies low-cost printers office furniture
shredders paper-based supplies writing/drawing materials
Figure 2Product wise sales value
Interpretation
On analysis of the chart it can be observed that higher sales is observed in case of writing
and drawing materials where sales increased from 30000 to 32000. Apart from this, in case of
office funiture sales increased from 25000 to 27000. On other hand, in case of products printer
cartridges, general office supplies sales value declined in 2017 relative to 2016 from 26000 to
22000 and 27000 to 23000. Sales does not get changed in case of some products like low cost
peinters, shreeders and paper based supplies. Hence, it can be said that only products which are
office furniture and writing as well as drawing materials are generating more revenue for the
firm.
© Coorelation cofficient
5 | P a g e
2014.5 2015 2015.5 2016 2016.5 2017 2017.5
155000
160000
165000
170000
175000
180000
185000
165000
182000
178000
f(x) = 6500 x − 12929000
R² = 0.534810126582278
Chart Title
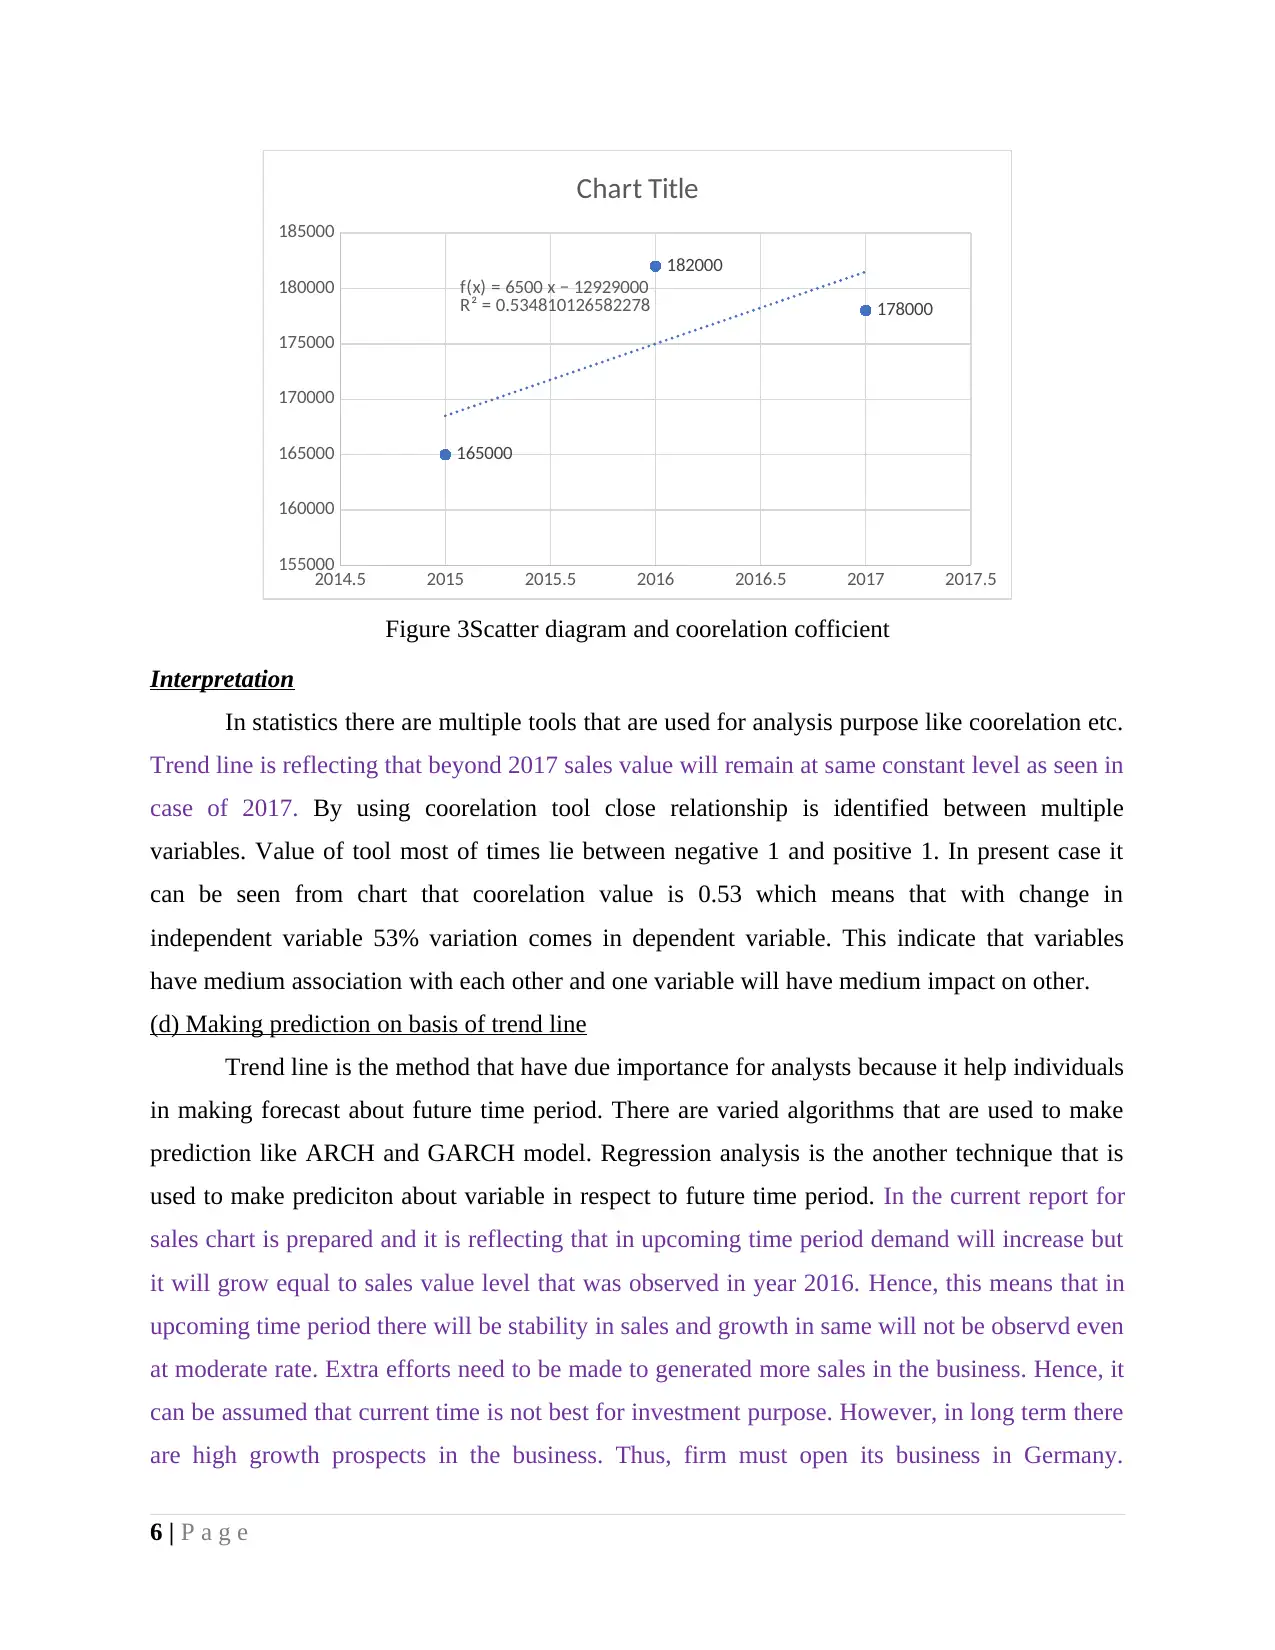
Figure 3Scatter diagram and coorelation cofficient
Interpretation
In statistics there are multiple tools that are used for analysis purpose like coorelation etc.
Trend line is reflecting that beyond 2017 sales value will remain at same constant level as seen in
case of 2017. By using coorelation tool close relationship is identified between multiple
variables. Value of tool most of times lie between negative 1 and positive 1. In present case it
can be seen from chart that coorelation value is 0.53 which means that with change in
independent variable 53% variation comes in dependent variable. This indicate that variables
have medium association with each other and one variable will have medium impact on other.
(d) Making prediction on basis of trend line
Trend line is the method that have due importance for analysts because it help individuals
in making forecast about future time period. There are varied algorithms that are used to make
prediction like ARCH and GARCH model. Regression analysis is the another technique that is
used to make prediciton about variable in respect to future time period. In the current report for
sales chart is prepared and it is reflecting that in upcoming time period demand will increase but
it will grow equal to sales value level that was observed in year 2016. Hence, this means that in
upcoming time period there will be stability in sales and growth in same will not be observd even
at moderate rate. Extra efforts need to be made to generated more sales in the business. Hence, it
can be assumed that current time is not best for investment purpose. However, in long term there
are high growth prospects in the business. Thus, firm must open its business in Germany.
6 | P a g e
155000
160000
165000
170000
175000
180000
185000
165000
182000
178000
f(x) = 6500 x − 12929000
R² = 0.534810126582278
Chart Title
Figure 3Scatter diagram and coorelation cofficient
Interpretation
In statistics there are multiple tools that are used for analysis purpose like coorelation etc.
Trend line is reflecting that beyond 2017 sales value will remain at same constant level as seen in
case of 2017. By using coorelation tool close relationship is identified between multiple
variables. Value of tool most of times lie between negative 1 and positive 1. In present case it
can be seen from chart that coorelation value is 0.53 which means that with change in
independent variable 53% variation comes in dependent variable. This indicate that variables
have medium association with each other and one variable will have medium impact on other.
(d) Making prediction on basis of trend line
Trend line is the method that have due importance for analysts because it help individuals
in making forecast about future time period. There are varied algorithms that are used to make
prediction like ARCH and GARCH model. Regression analysis is the another technique that is
used to make prediciton about variable in respect to future time period. In the current report for
sales chart is prepared and it is reflecting that in upcoming time period demand will increase but
it will grow equal to sales value level that was observed in year 2016. Hence, this means that in
upcoming time period there will be stability in sales and growth in same will not be observd even
at moderate rate. Extra efforts need to be made to generated more sales in the business. Hence, it
can be assumed that current time is not best for investment purpose. However, in long term there
are high growth prospects in the business. Thus, firm must open its business in Germany.
6 | P a g e
⊘ This is a preview!⊘
Do you want full access?
Subscribe today to unlock all pages.
Trusted by 1+ million students worldwide
Completely one can not rely on results of trend line because external enviroment if get changed
have huge impact on business. Trend line can not make prediction about external factors. It make
prediction on basis of past trends. Hence, one need to take in to account external factors also. If
past trends remain continue in future time period then there is high reliability of trend analysis. It
can be said that there is huge significence of trend analysis method for the business firm. Hence,
it can be deduced that value of sales will increase moderately and there is need to take steps to
push sales upward in the business in future time period.
TASK 4
(a)Completion of table
Pros Score/10 Cons Score/10
Facts are revealing that currently
economic growth rate in
increasing in Germany and due to
this reason assumption can be
made that in future time period
demand for stationary products
will enhance.
10 Number of companies in
stationary business are high.
Hence, it is hard to earn sufficient
amount of margin in the business.
6
With passage of time period total
number of firms that are in
stationary business are decreasing.
This reflects that competition to
some extent become soften
(Bendat and Piersol, 2011).
9 Products production cost is high
and due to this reason it is hard to
earn large amount of profit in
stationary business. Hence, major
challanging task is to increase
number of customers in the
business.
5
On other hand, population in
Germany is increasing and this is
the reason because of which it is
assumed that in upcoming time
period demand of stationary
products will enhance.
8
7 | P a g e
Paraphrase This Document
Need a fresh take? Get an instant paraphrase of this document with our AI Paraphraser
Total pros 3 Total cons 2
Average pros 3 Average cons 3
(b)International standard applied to the firm business
In current time period ISO standards are commonly prepared for each and every aspect of
the product. Product quality is one of the factors to which people give due importance and in this
regard if certain conditions are satisfied ISO mark is assigned to product which reflect that item
is good for the customers (International Organization for Standardization, 2017). In present case
also ISO standard is applied on the company and it can be identified that in this regard there are
varied parameters related to quality that if satisfied ISO certificate is issued by relevant authority.
ISO/TC 131/SC 8 is known as standard of product testingthat apply on the company in respect to
testing of products. If company is following all relevant process that must be performed in
respect to testing of product then in that case ISO standard is issued by relevant authority to the
business firm. Data clearly tells that customers are becoming more quality concious and firms
failed to make available that quality of product. Hence, failed to earn required amount of
revenue. Smaller firms need to upgrade their technology base and by doing so they can innovate
their products in proper manner.
TASK 5
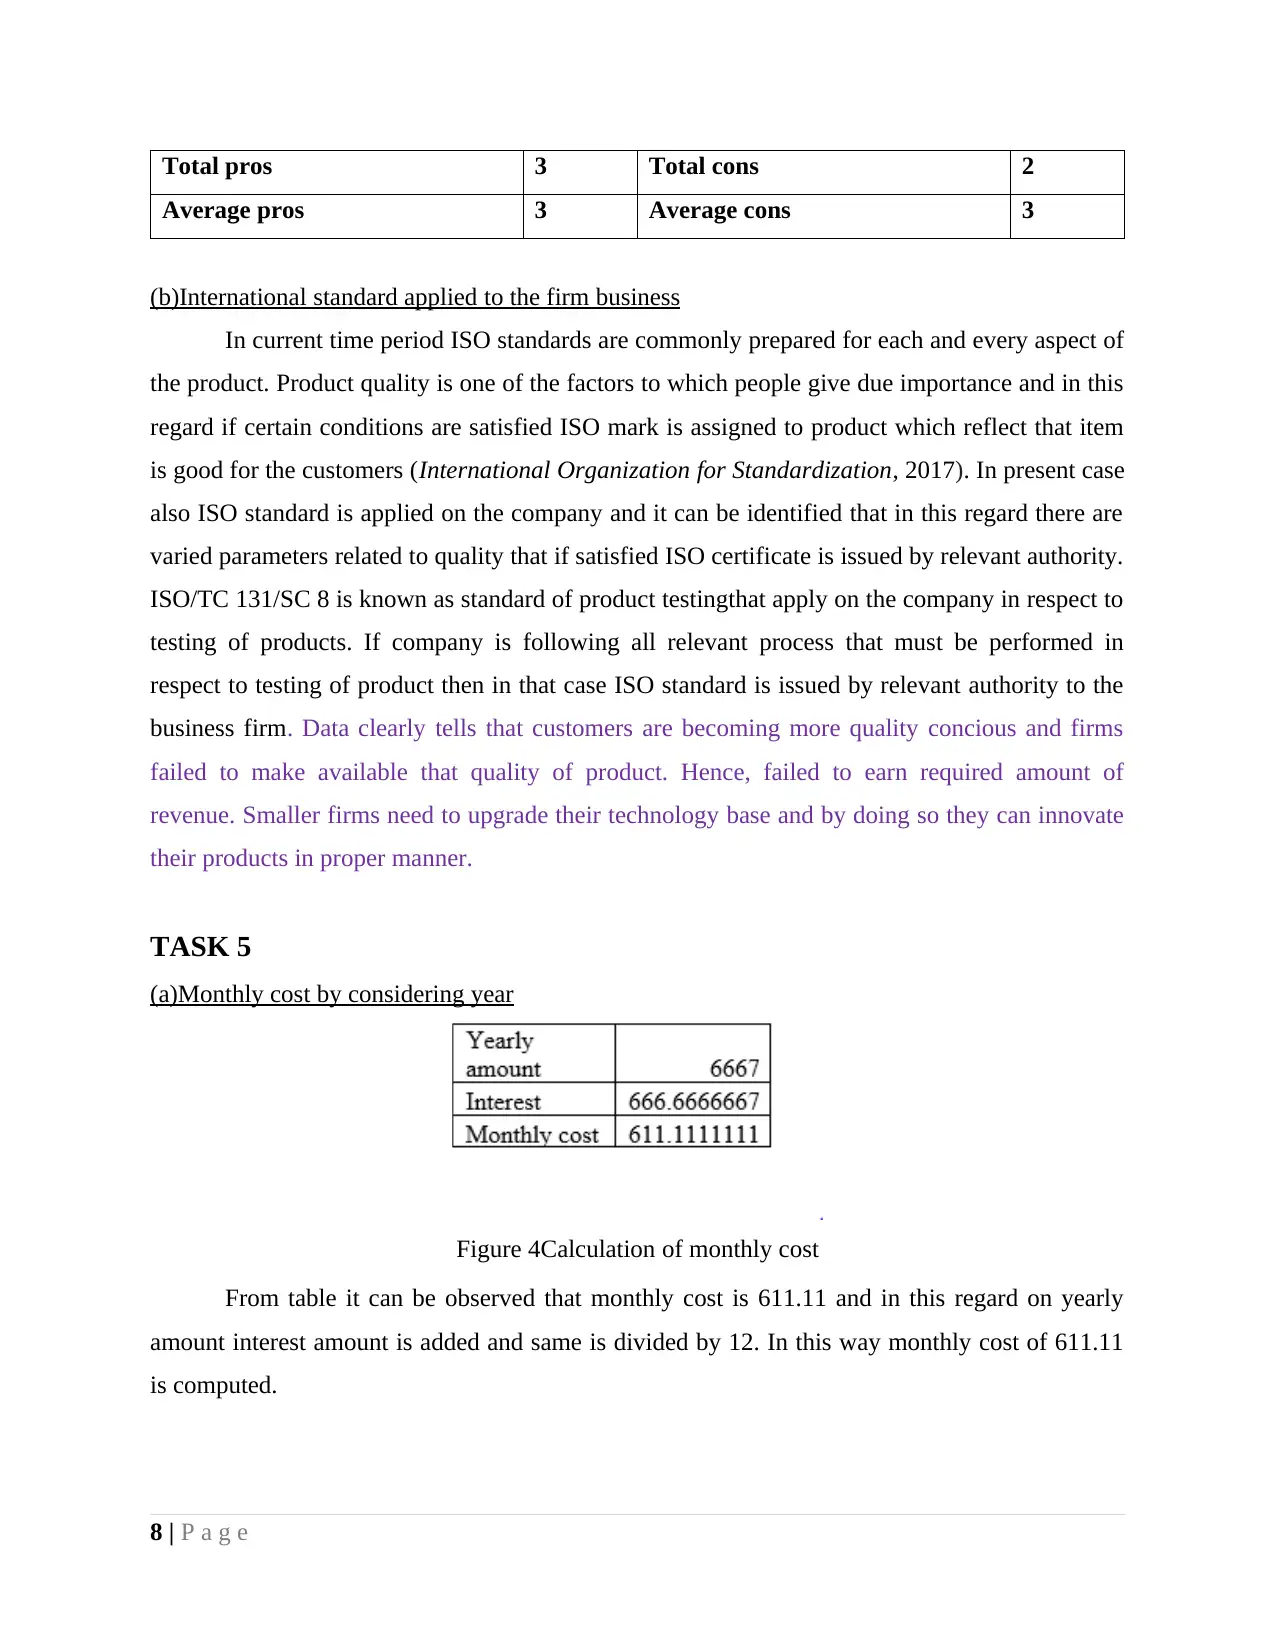
(a)Monthly cost by considering year
Figure 4Calculation of monthly cost
From table it can be observed that monthly cost is 611.11 and in this regard on yearly
amount interest amount is added and same is divided by 12. In this way monthly cost of 611.11
is computed.
8 | P a g e
Average pros 3 Average cons 3
(b)International standard applied to the firm business
In current time period ISO standards are commonly prepared for each and every aspect of
the product. Product quality is one of the factors to which people give due importance and in this
regard if certain conditions are satisfied ISO mark is assigned to product which reflect that item
is good for the customers (International Organization for Standardization, 2017). In present case
also ISO standard is applied on the company and it can be identified that in this regard there are
varied parameters related to quality that if satisfied ISO certificate is issued by relevant authority.
ISO/TC 131/SC 8 is known as standard of product testingthat apply on the company in respect to
testing of products. If company is following all relevant process that must be performed in
respect to testing of product then in that case ISO standard is issued by relevant authority to the
business firm. Data clearly tells that customers are becoming more quality concious and firms
failed to make available that quality of product. Hence, failed to earn required amount of
revenue. Smaller firms need to upgrade their technology base and by doing so they can innovate
their products in proper manner.
TASK 5
(a)Monthly cost by considering year
Figure 4Calculation of monthly cost
From table it can be observed that monthly cost is 611.11 and in this regard on yearly
amount interest amount is added and same is divided by 12. In this way monthly cost of 611.11
is computed.
8 | P a g e
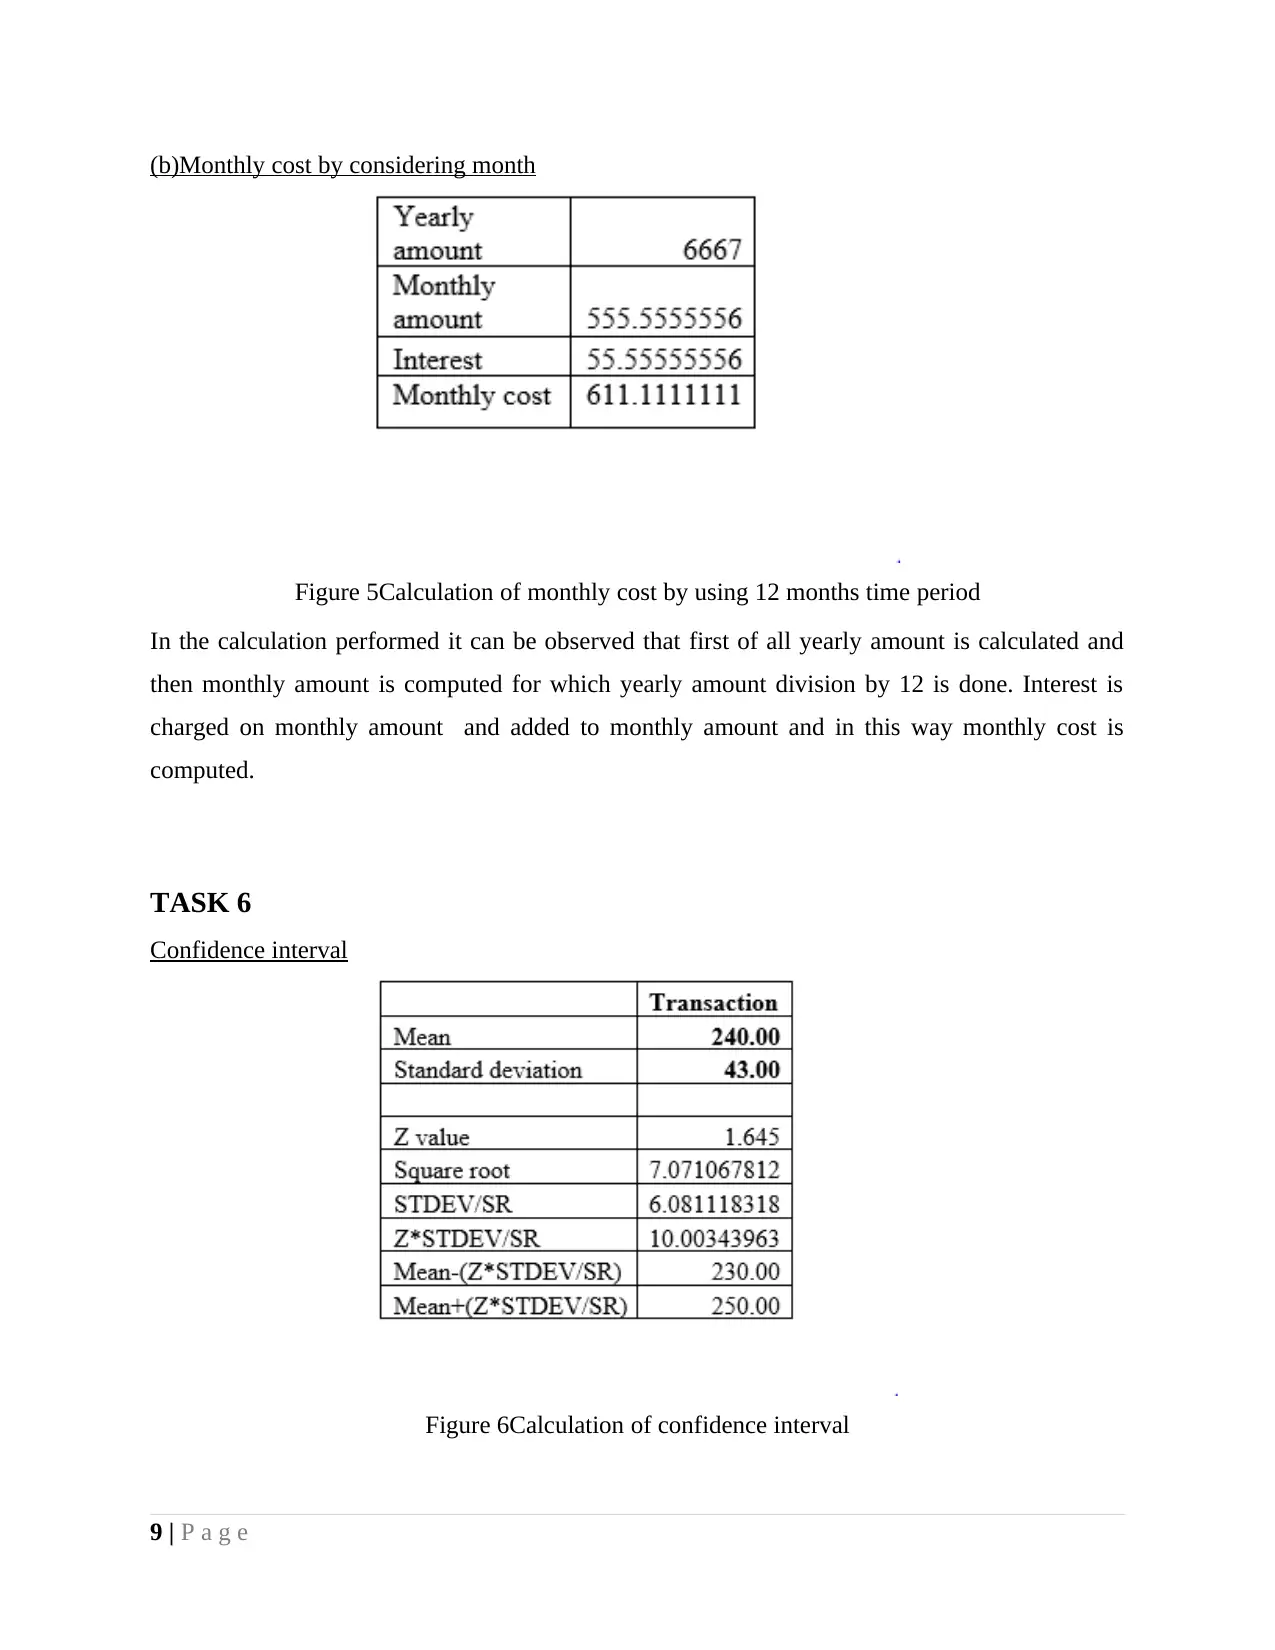
(b)Monthly cost by considering month
Figure 5Calculation of monthly cost by using 12 months time period
In the calculation performed it can be observed that first of all yearly amount is calculated and
then monthly amount is computed for which yearly amount division by 12 is done. Interest is
charged on monthly amount and added to monthly amount and in this way monthly cost is
computed.
TASK 6
Confidence interval
Figure 6Calculation of confidence interval
9 | P a g e
⊘ This is a preview!⊘
Do you want full access?
Subscribe today to unlock all pages.
Trusted by 1+ million students worldwide
1 out of 15
Related Documents


Your All-in-One AI-Powered Toolkit for Academic Success.
+13062052269
info@desklib.com
Available 24*7 on WhatsApp / Email
![[object Object]](/_next/static/media/star-bottom.7253800d.svg)
Unlock your academic potential
Copyright © 2020–2026 A2Z Services. All Rights Reserved. Developed and managed by ZUCOL.