MBS 603: Data, Metrics, Reporting and Analytics Project
VerifiedAdded on 2023/05/28
|22
|4119
|242
Project
AI Summary
This project analyzes the performance of a Disability Services Organization, focusing on data analysis, metrics, and reporting to enhance organizational effectiveness. The project uses quantitative data from 138 employees across four branches and two divisions. Key performance measures, including efficiency, effectiveness, and business outcomes, are examined. Predictive analytics, including correlation and linear regression analysis, are used to determine relationships between factors such as time to fill positions, hiring costs, sponsor satisfaction, and worker productivity. The analysis reveals positive correlations between performance and factors like hiring costs and productivity, while speed to competency shows a negative correlation. Linear regression models assess the influence of factors like age, years of service, work experience, education, and salary on worker productivity. The project provides recommendations to the CEO based on the findings, aiming to improve staffing policies and overall organizational performance. The analysis highlights the significance of work experience and education in predicting worker productivity, offering valuable insights for decision-making.
Data, Metrics, Reporting and Analytics
An analysis of Organizational
performance
Author:
An analysis of Organizational
performance
Author:
Paraphrase This Document
Need a fresh take? Get an instant paraphrase of this document with our AI Paraphraser

Introduction
Background information
Performance of an organization is often thought to be connected to the kind of workers it
employs. To reinforce such as supposition, is the current need of the CEO to determine whether
there exists a difference in employee performance across the four locational branches and the
two divisional branches, which is part of an effort to improve organizational performance. With
the increasing orientation of the labor market toward knowledge and information which has
pushed the management of organizations to need of quality workers. Despite the high
productivity of star workers, “…they cannot constitute a sustained competitive advantage if their
skills are mobile and transferable across firms.”1 In his paper on the myth of talent and
performance portability2 notes that the mantra of “the people make the place”, has been prevalent
in many an organization hence acting as a drive force for choice of human resources.
Generally, organizational performance refers to the measure extent to which an
organization performs in terms of its underlying mission, vision as well as goals3. Therefore,
organizational performance can be split into performance measures and performance referent
where performance measures refer to the metrics employed in gauging organizations while
performance referents are used in assessment of how well the organization is doing.
Usage of a range of performance metrics and referents are key due to the value imported
from the depth and information offered on the organization performance.
1 Groysberg, Boris, Lee, Linda-Eling and Nanda Ashish. “Can They Take It with Them? The Portability of Star
Knowledge Workers' Performance.” Management science 54. No. 7 (2007): 217.
2 Viswesvaran, Vish. “Chasing Stars: The Myth of Talent and the Portability of Performance.” Human resource
management 50, no.3 (2010): 68.
3 Janice, Edwards, Organizational Performance: A Complex Concept (Canada: Press books, 2018), 19.
⊘ This is a preview!⊘
Do you want full access?
Subscribe today to unlock all pages.
Trusted by 1+ million students worldwide
Project objectives
i. To determine the relationship between key performance measures using predictive
analysis in Disability services organization.
ii. Provide recommendations to the CEO on the issue of staffing policy in order to enhance
organizational performance given the results of predictive analysis
Description of data and key measures
Data
The data used in this project contains quantitative information on 138 employees working in
its 2 business divisions (Community outings and Home cares) from the four branches that is:
Community outings from Brighton, Denver, Eaton as well as Victoria and Home cares from
Brighton, Denver, Eaton, Victoria.
In addition, there are 12 descriptive variables which include: employee code, last name, first
name, Location, Division description for each employee, Gender, Employee status code,
Employee position, Year that the employee begun working, date of birth, Work experience, Year
of education.
Key measures
In an article on “Measuring Your Organization’s Performance”, the author reinstates that, there
is importance of performance measurement as a means of keeping track of the organizational
performance4. He further argues that performance measurement includes gauging of the actual
performance outcomes. Profit, productivity, sales and market share, customer services,
4 Hookana, Heli. “Measurement of Effectiveness, Efficiency and Quality
in Public Sector Services - Interventionist Empirical Investigations.” Managing sustainability 4, no.7. (2011): 491.
Paraphrase This Document
Need a fresh take? Get an instant paraphrase of this document with our AI Paraphraser
subjective estimates of financial performance are some of the measures of how an organization is
performing5. Such factors are then classified to performance measurements that is: efficiency,
efficiency and business outcomes.
Therefore, from the organization’s data, there are three key sets of HR process measures
that is, Efficiency measures, Effectiveness measures, and Business outcome measures.
Efficiency measures
Efficiency measures “…focus on cost and report the financial efficiency of human resources
operations”6
In broad terms, efficiency measures are the metrics used to examine the relationship between
production inputs and outputs, it is also viewed as the success rate of the conversion of inputs
into outputs. It is therefore the ability of the organization to implement its plans with minimal
resource expenditure. According to Porter’s Total productivity, an organization should seek to
remove the six losses which comprise:
Reduced yields
Process defects
Reduced speed
Idling and minor stoppages
Set-up and adjustment
Equipment failure
5 Moss, Simon. “Measures of organizational performance.” Academy of Management Journal 39, No.57. (2016): 19.
6 Fitz-enz. and Mattox John. Predictive Analytics for Human Resources. (Wiley, 2014), 214
Thus in measuring organizational efficiency, exploration of how well the inputs are
optimized is key. In analysis of organizational efficiency, factors such as the staffing process,
and focus on time to fill in, hiring cost and salary associated with positions will be analyzed.
Effectiveness measures
Efficiency measures are inclined towards successful input conversion outputs, while
effectiveness examines interaction of outputs with economic and social environment. An
organization’s effectiveness is therefore an examination of how the organization is performing in
both long term and short term targets. As such, analysis of Focus on target groups, beneficiaries,
clients that is, sponsor satisfaction score in the organization.
Therefore, effectiveness has an orientation towards output, sales, profits, cost reduction,
innovativeness etcetera. As a result, in analysis of the organization’s effectiveness factors such as
sponsor satisfaction, the staffing process, focus on speed to competency, and performance rating
are analyzed.
Business outcome measures
“…business performance measures are a set of quantifiable metrics taken from various
sources.”7 Consequently, business performance measures enable the executive to keep track of a
given business process that is being examined. Hence, in measuring the performance of the
business, profitability and worker engagement of the organization are explored.
7 Bartuševičienė, Ilona and Šakalytė, Evelina. “Organizational Assessment: Effectiveness vs. Efficiency.” Social
Transformations in Contemporary Society 1, no 12. (2013): 45.
⊘ This is a preview!⊘
Do you want full access?
Subscribe today to unlock all pages.
Trusted by 1+ million students worldwide
Analysis of the relationship between key measures
Predictive analysis
The initial objective of the project is to determine if there is a difference in employee
performance a factor which is highly correlated with the performance of the organization
In order to explore the relationship between effectiveness, efficiency and business
outcome measures, the method of predictive analytics is used. To achieve successful analysis,
exploration of the two business divisions is done separately i.e. for their independent
organizational performance. Initially, effectiveness measure is measured through which
efficiency can then be measured. Now, regression and correlation analysis will be used to
determine the relationship between the following factors which are drawn from efficiency,
effectiveness and business performance:
i. Outcomes staffing process
ii. Focus on time to fill in
iii. Hiring cost and salary
iv. Sponsor satisfaction
v. Focus on speed to competency
vi. Performance rating
vii. Profitability and worker engagement
Correlation analysis
Used as preparatory for predictive linear regression models8 correlation analysis explores
the association between quantitative variables. For instance, in determination of the relationship
8 Michael, Stanleigh. “Measuring Your Organization’s Performance.” Business improvement architects, 12th June ,
2016, accessed December 1st 2018, https://bia.ca/measuring-your-organizations-performance/
Paraphrase This Document
Need a fresh take? Get an instant paraphrase of this document with our AI Paraphraser
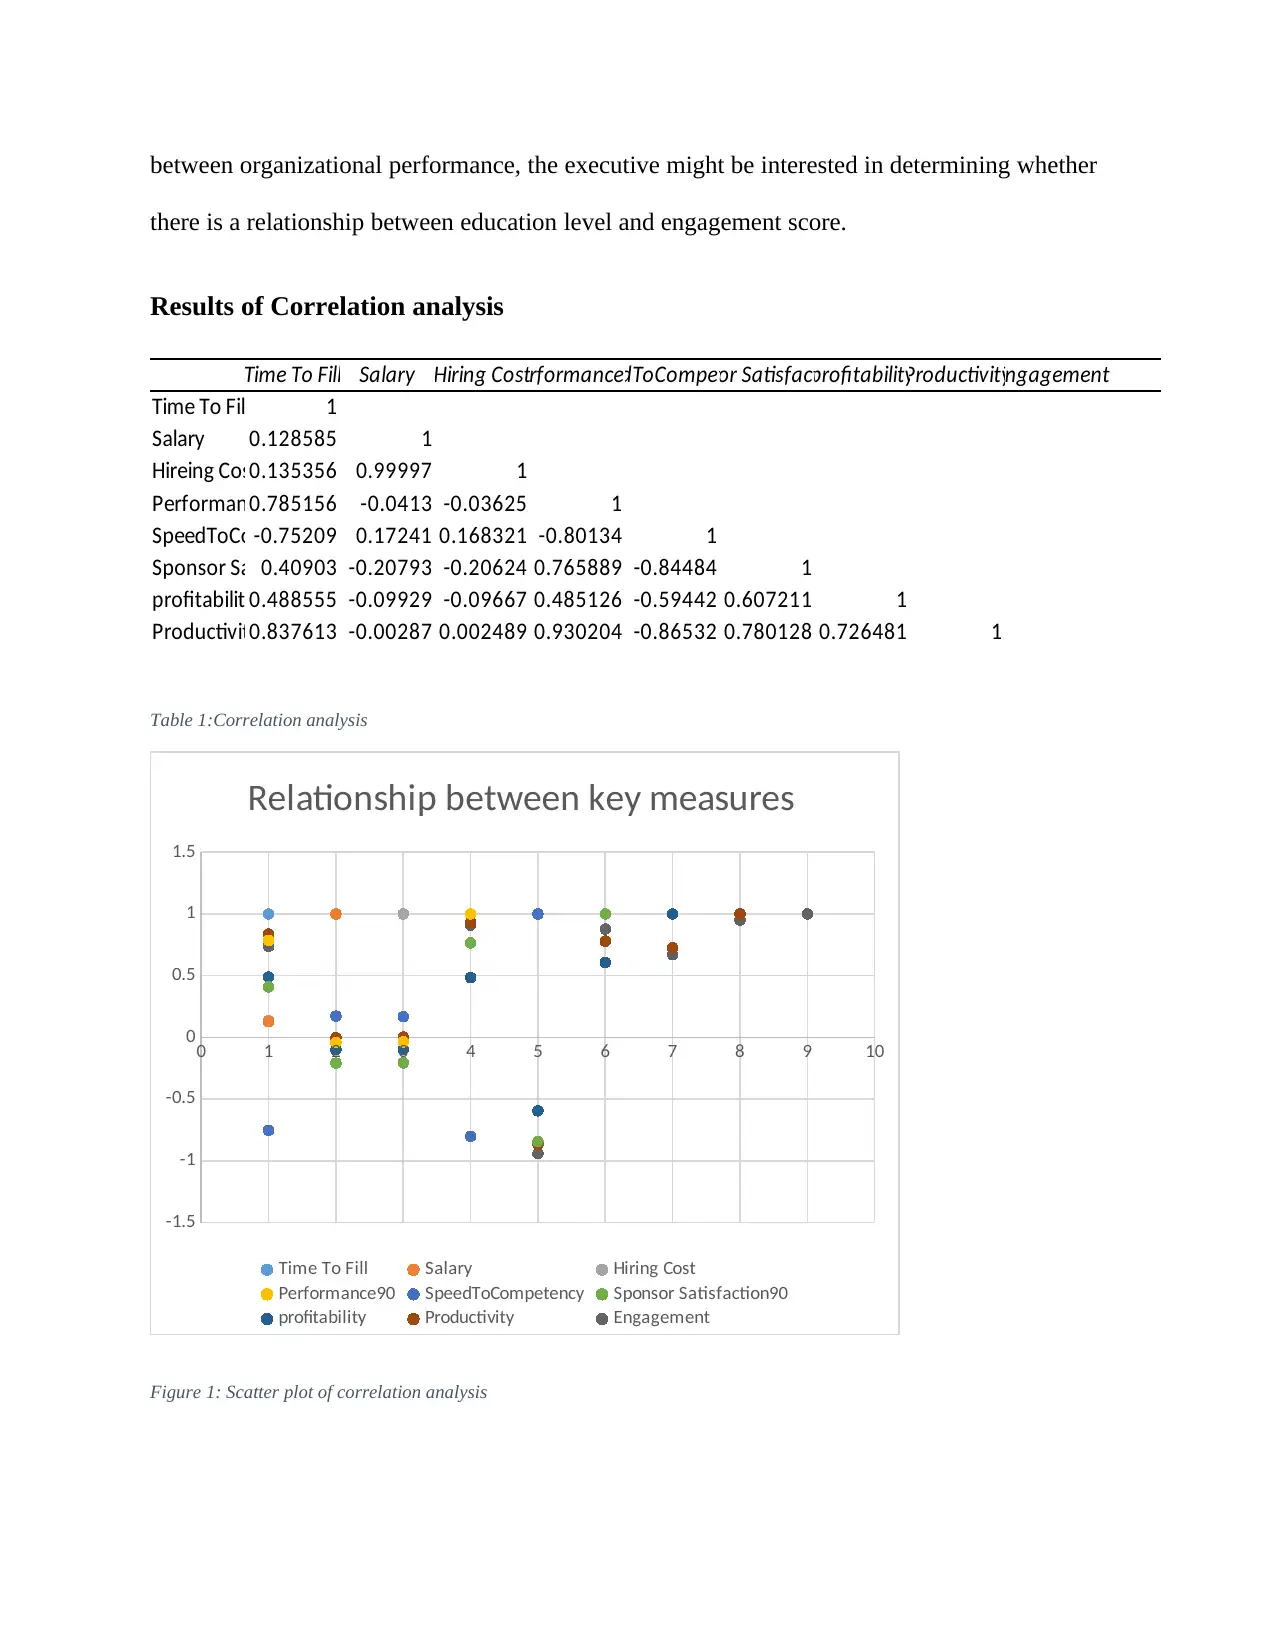
between organizational performance, the executive might be interested in determining whether
there is a relationship between education level and engagement score.
Results of Correlation analysis
Time To Fill Salary Hiring CostPerformance90SpeedToCompetencySponsor Satisfaction90profitabilityProductivityEngagement
Time To Fill 1
Salary 0.128585 1
Hireing Cos0.135356 0.99997 1
Performan0.785156 -0.0413 -0.03625 1
SpeedToCo-0.75209 0.17241 0.168321 -0.80134 1
Sponsor Sa 0.40903 -0.20793 -0.20624 0.765889 -0.84484 1
profitabilit 0.488555 -0.09929 -0.09667 0.485126 -0.59442 0.607211 1
Productivit0.837613 -0.00287 0.002489 0.930204 -0.86532 0.780128 0.726481 1
Table 1:Correlation analysis
0 1 2 3 4 5 6 7 8 9 10
-1.5
-1
-0.5
0
0.5
1
1.5
Relationship between key measures
Time To Fill Salary Hiring Cost
Performance90 SpeedToCompetency Sponsor Satisfaction90
profitability Productivity Engagement
Figure 1: Scatter plot of correlation analysis

Relationship between efficiency, effectiveness and business outcome
Assumptions
From the previous section, organizational efficiency is assumed to be measured by time
to fill in, hiring cost and salary whereas effectiveness is assumed to be measured by sponsor
satisfaction, focus on speed to competency, and performance rating. Business outcome
performance is measured by profitability and worker engagement.
Interpretation
From table 2 and figure 1 above, there is a positive correlation between performance and
time taken to fill the position a worker is holding i.e. with correlation coefficient of 0.7851.
Other factors that indicate a strong positive correlation are:
Hiring cost and salary- 0.9999
Sponsor satisfaction and performance rating-0.7658
Profitability and sponsor satisfaction- 0.6272
Productivity and performance rating- 0.8376
Worker engagement and profitability- 0.6705
Productivity and profitability- 0.7264
Productivity and sponsor satisfaction- 0.7801
Worker engagement and performance rating- 0.9101
Engagement and sponsor satisfaction- 0.8779
Worker engagement and productivity- 0.9501
⊘ This is a preview!⊘
Do you want full access?
Subscribe today to unlock all pages.
Trusted by 1+ million students worldwide
However, speed to competency has got a strong negative correlation with performance
rating, Sponsor satisfaction, productivity and engagement with a Pearson correlation of -0.8013,
-0.8448, -0.8653, and -9405 respectively.
Linear Regression
When exploring how a response variable related with predictor variables, linear
regression models are used as one of the methods of predictive analysis. In regression analysis,
examination of which combination of factors lead to optimum productivity among workers is
examined.
Predictive analytics using linear regression
Linear regression is used to examine the factors that influence a worker’s productivity.
Linear regression model:
Yi= β0 +β1X1+β2X2 +…+ βnXn + £I Where: Yi is the response variable, βi are the
coefficients of the explanatory variables Xi
and £i is the error term
Worker’s productivity model:
Productivity= β0 + β1 (Age)+ β2 (years of service) + β3 (Work experience) + β4 (Years of
education) + β4 (Salary) eqn 1
Hypotheses
At a confidence level of 95% the following two hypotheses are formulated:
Paraphrase This Document
Need a fresh take? Get an instant paraphrase of this document with our AI Paraphraser
Null
There is sufficient statistical evidence to indicate a relationship between productivity and
age, years of service, work experience, years of education and salary.
Alternative
There is no sufficient statistical evidence to indicate a relationship between productivity
and age, years of service, work experience, years of education and salary.
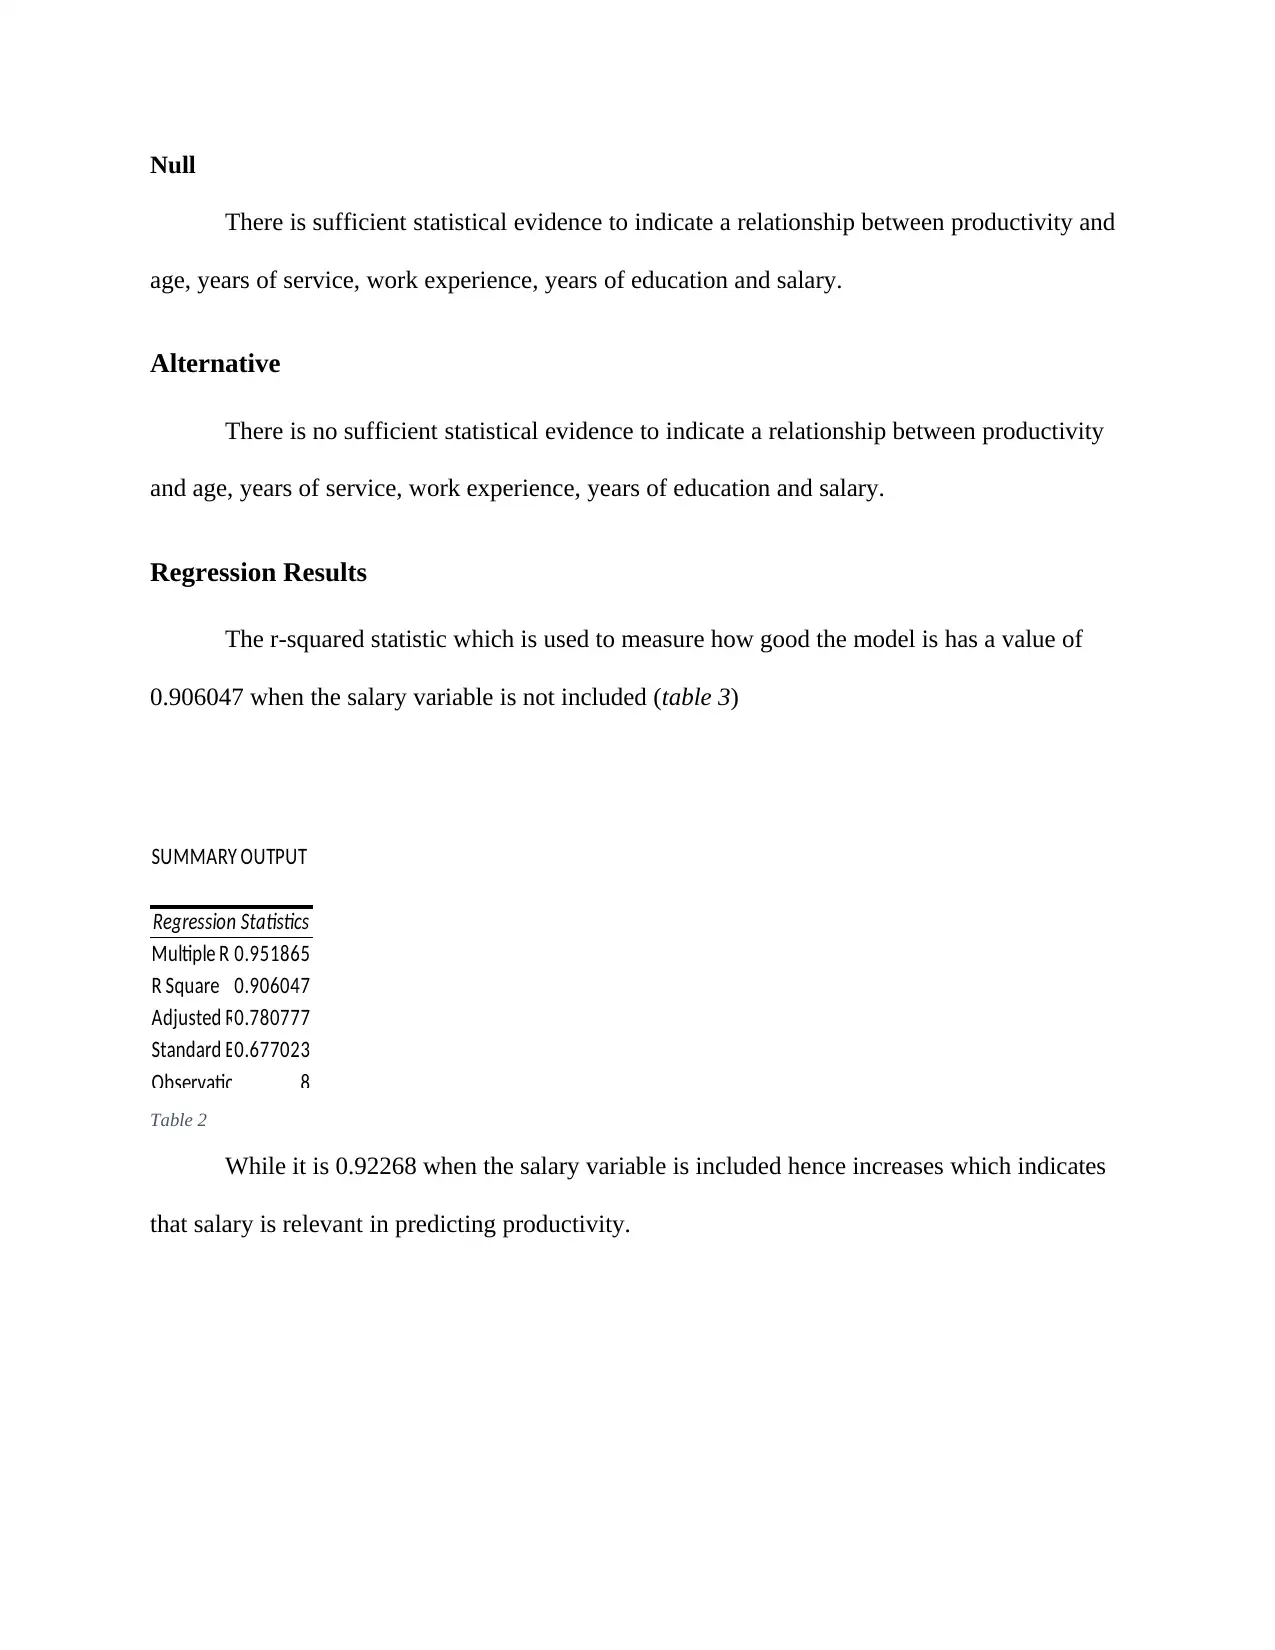
Regression Results
The r-squared statistic which is used to measure how good the model is has a value of
0.906047 when the salary variable is not included (table 3)
SUMMARY OUTPUT
Regression Statistics
Multiple R 0.951865
R Square 0.906047
Adjusted R0.780777
Standard E0.677023
Observatio 8
Table 2
While it is 0.92268 when the salary variable is included hence increases which indicates
that salary is relevant in predicting productivity.
There is sufficient statistical evidence to indicate a relationship between productivity and
age, years of service, work experience, years of education and salary.
Alternative
There is no sufficient statistical evidence to indicate a relationship between productivity
and age, years of service, work experience, years of education and salary.
Regression Results
The r-squared statistic which is used to measure how good the model is has a value of
0.906047 when the salary variable is not included (table 3)
SUMMARY OUTPUT
Regression Statistics
Multiple R 0.951865
R Square 0.906047
Adjusted R0.780777
Standard E0.677023
Observatio 8
Table 2
While it is 0.92268 when the salary variable is included hence increases which indicates
that salary is relevant in predicting productivity.
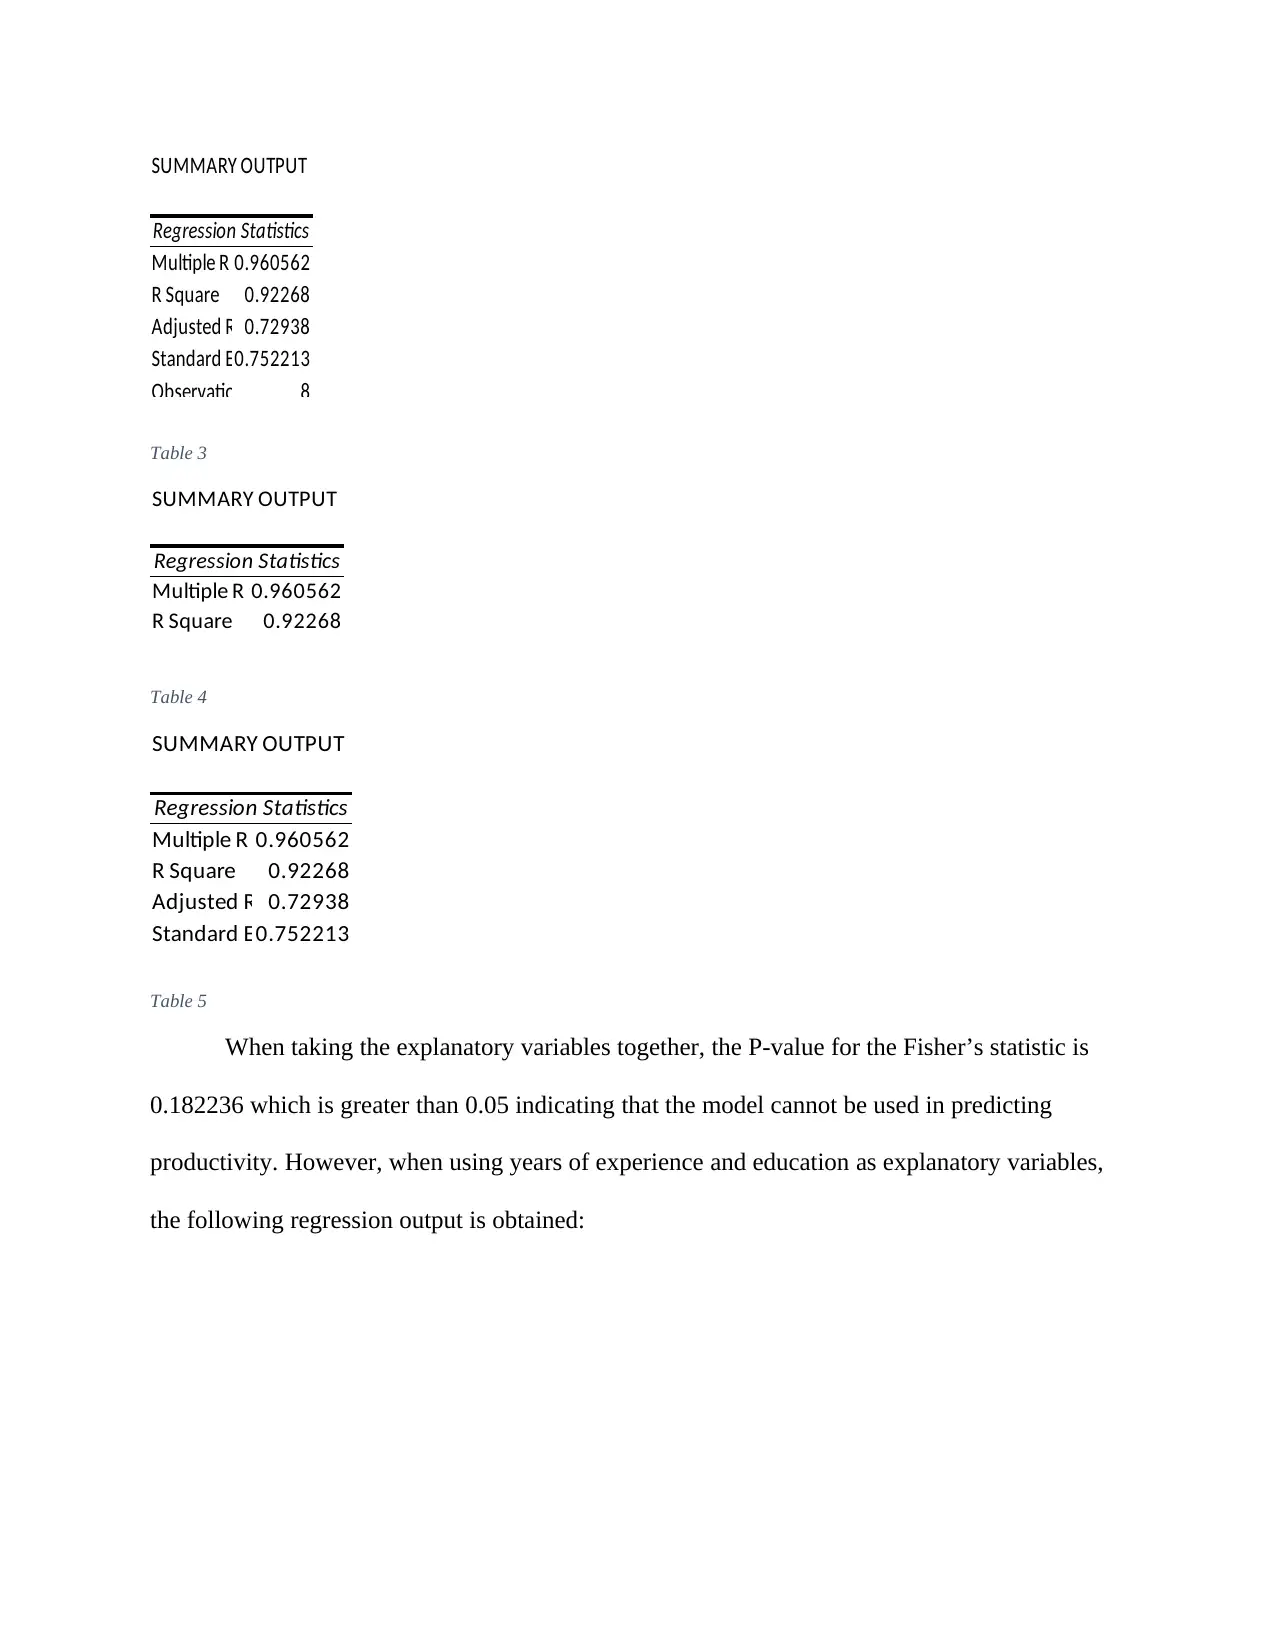
SUMMARY OUTPUT
Regression Statistics
Multiple R 0.960562
R Square 0.92268
Adjusted R 0.72938
Standard E0.752213
Observatio 8
Table 3
SUMMARY OUTPUT
Regression Statistics
Multiple R 0.960562
R Square 0.92268
Table 4
SUMMARY OUTPUT
Regression Statistics
Multiple R 0.960562
R Square 0.92268
Adjusted R 0.72938
Standard E0.752213
Table 5
When taking the explanatory variables together, the P-value for the Fisher’s statistic is
0.182236 which is greater than 0.05 indicating that the model cannot be used in predicting
productivity. However, when using years of experience and education as explanatory variables,
the following regression output is obtained:
Regression Statistics
Multiple R 0.960562
R Square 0.92268
Adjusted R 0.72938
Standard E0.752213
Observatio 8
Table 3
SUMMARY OUTPUT
Regression Statistics
Multiple R 0.960562
R Square 0.92268
Table 4
SUMMARY OUTPUT
Regression Statistics
Multiple R 0.960562
R Square 0.92268
Adjusted R 0.72938
Standard E0.752213
Table 5
When taking the explanatory variables together, the P-value for the Fisher’s statistic is
0.182236 which is greater than 0.05 indicating that the model cannot be used in predicting
productivity. However, when using years of experience and education as explanatory variables,
the following regression output is obtained:
⊘ This is a preview!⊘
Do you want full access?
Subscribe today to unlock all pages.
Trusted by 1+ million students worldwide
1 out of 22

Your All-in-One AI-Powered Toolkit for Academic Success.
+13062052269
info@desklib.com
Available 24*7 on WhatsApp / Email
![[object Object]](/_next/static/media/star-bottom.7253800d.svg)
Unlock your academic potential
Copyright © 2020–2026 A2Z Services. All Rights Reserved. Developed and managed by ZUCOL.